2020/06/08

Wind in Edmonton: Summary

Edmonton Weather Nerdery had never really talked about wind before, and so to make up for that we have done an epic, 9-part odyssey. The whole thing can be a bit overwhelming, be here are the highlights:

  • Nope. Average windspeed each year, highest windspeed each year, and strongest gusts each year are all down at both Blatchford and the International Airport, especially compared to the 1960s.
  • Our average windspeed and windiest hour each day peak in mid-May, and are lowest in August. During the day windspeeds are highest on-average at 1-2PM.
  • Hourly windspeeds stretch from 0 to 87km/h, and are centred around 13km/h. Only 4% of our hours are 30km/h or more, 0.8% are 40km/h or more, and 0.1% are 50km/h or more.
Part 4: How many windy days do we get each year?
  • These have dropped a lot since the 1960s. Now we have about 30 days hit 40km/h each year, compared to 60 days each year in the 1960s. For 60km/h days we might have 1 every few years, but in the 1960s had about 2 per year.
  • Through 60 years of history, May 17th stands out as a particularly windy date in Edmonton
  • Our windiest months were mostly clustered from about 1960~1973. But April and May continue to be fairly windy.
  • Edmonton has a surprising number of hours with winds from the South, BUT those are mostly for low windspeeds. When we look at speeds of 20km/h+ it is mostly from the NW, with a bit from the SE.
  • Windspeeds in Calgary & Winnipeg are also lower than they used to be. The pattern is not identical to Edmonton, but it is similar.
  • Winnipeg really is a lot windier than Edmonton, and Calgary is too.

We can't post something here without including at least one chart, so here is the very fancy wind rose from Part 8: Wind Direction (again)

Wind in Edmonton Part 9: Versus Round

Today we reach the end of our epic look at Wind in Edmonton. A 9-part series is obviously excessive, but each question led to another question which led to another dashboard, and that's how we ended here. 

Something that we saw in the earlier parts of our look at wind was that Edmonton is not as windy as it used to be. And we saw that the 1960s in particular were windy across the board: average windspeeds, peak windspeeds, number of wind days, wind gusts, etc. And that raises the question of why?

We couldn't end this series without at least trying to dig into the mystery of the windy 1960s, and so today we are going to compare Edmonton to Calgary & Winnipeg. Often at Edmonton Weather Nerdery we also have the data for Vancouver, Montréal, Toronoto, etc. but for the wind data we are going to limit it to just Edmonton, Calgary, & Winnipeg. The wind uses hourly data, so there is 24x more of it than the daily temperatures and precipitation which we normally do.

So today we will run through many of the charts which we have already seen, but with Calgary & Winnipeg included as well. And we will start at the beginning:

Is it windier than it used to be?
And again, the answer is: nope.

Here we have the strongest gusts, the windiest hour, and the average windspeed for each year, and for all three cities the numbers are lower than they used to be. For Calgary it has been a gradual decline, whereas for Winnipeg it was more of a big step down in the early 1970s, and mostly flat after that.
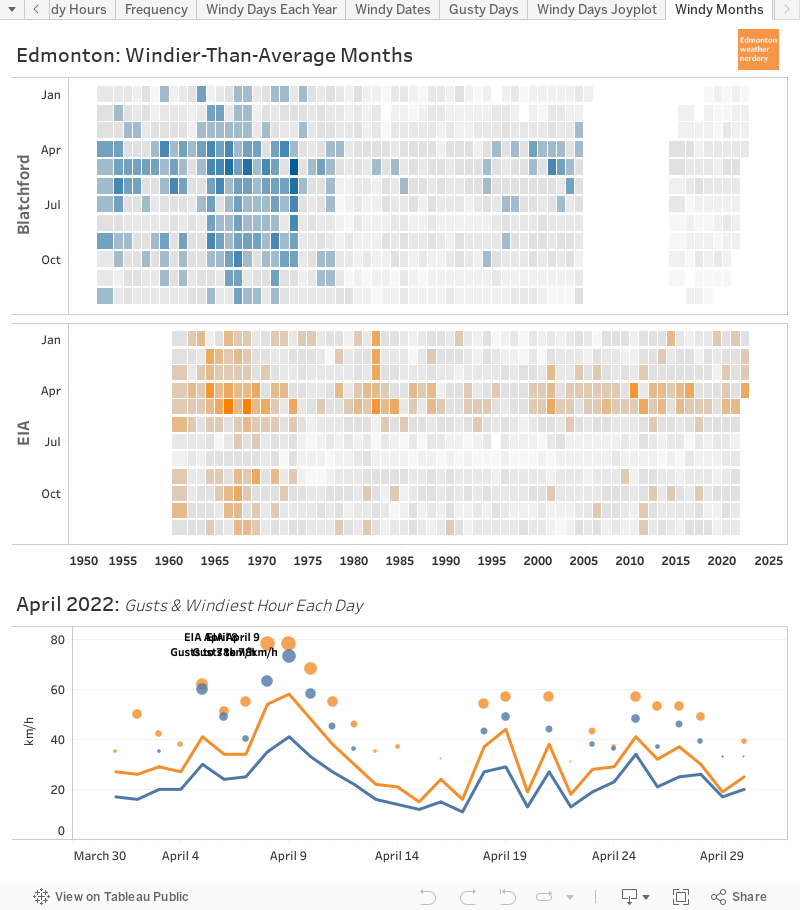

Windy Months
In the top part of this chart each of the coloured blobs represents a month which was windier than average for the city.
  • For Edmonton we saw that at both Blatchford and the International our windiest months were really clustered in the late-1960s and early-1970s.
  • Calgary is a little bit different. Most of its windiest months are between 1960-1975, and things really taper-off after about 1990.
  • And Winnipeg is also a bit different, with most of its windiest months spread from 1953-1970. Then from 1970-today there is a fairly consistent sprinkling of wind~ish months. And I don't know what happened in 1991, but September-December had four top-20 months in a row.
So all three cities have fewer windy months than they used, but that the pattern of those windy months is different.

It's also interesting that Calgary & Winnipeg have had a lot of windy months in the winter, whereas for Edmonton that never really happened outside of the very tight window of 1967-1971.


How many windy days do we get each year?
Here we have the number of days each year which recorded a windspeed of 60km/h or more. 60km/h was chosen here as an example, but you can use the slider to look at 30km/h or 50km/h too.

All of the windspeeds look something like this though, with a lot of windy days in the 1953-1975 range, and a lot few windy days since then.

It is also interesting to see how many fewer windy days Edmonton gets compared to Calgary or Winnipeg, and that that was also the case 60 years ago. In the windy 60s Edmonton averaged two 60km/h days each year, while Calgary had 10 and Winnipeg had 6. 

For 40km/h days Edmonton used to average 60, compared to 110 in Calgary and 100 in Winnipeg. In recent years Edmonton has averaged 30 days which hit 40km/h, compared to about 60 in Calgary and 50 in Winnipeg.


Gusty Days
Here we have all of the days with wind gusts of 100km/h or more, and for all three cities the bubbles are a lot less common than they used to be. Winnipeg has not had a day with 100km/h wind gusts since June 21, 2004. (although Winnipeg is missing gust data for 1997-2004, while Blatchford is missing 1995-2005)

So by all accounts Edmonton, Calgary & Winnipeg are all less windy than they used to be. But how do they compare to one another?


City Comparisons - Average Windspeed
Here we have a comparisons of the average windspeed throughout the year for the 3 cities. This uses all the data for 1953-today. Up top we see each of the cities individually, but at the bottom we can see how they compare to one another.

All 3 of the cities have their highest average windspeeds in May, and are lowest at the end of August. 

Surprisingly (to me, anyway) Winnipeg's average windspeed is about 5km/h (or 30%) higher than Edmonton's, although that depends a bit on the station. Winnipeg is on-average about 5km/h windier than the Edmonton International for most of the year, although the gap closes to 3km/h for June & July. For Blatchford the difference is 7-8km/h for most of the year, although it again narrows to 3km/h for June & July.

Calgary is also windier than Edmonton. Blatchford's average windspeed is about 4km/h less than Calgary's for most of the year, although that decreases to 1-2km/h for the summer. For the Edmonton International the difference is about 2-3km/h for the whole year.

And for Calgary vs Winnipeg, Winnipeg's average windspeed is about 3km/h higher than Calgary's for most of the year, except during July & August when they are a very close match.


City Comparisons - Windiest Hour Each Day
We can also use this chart to look at the average of the windiest hour for each day of the year. "Average Windiest Hour" is maybe slightly unclear, but the windspeed varies during the year as well as during the day. This is looking at the windiest of each day - January 1st, May 17th, August 23rd... - and finding the average for each city.

Winnipeg and Calgary are both at about 30km/h for most of the year: things increase a bit to 33km/h in May and fall to 27km/h in August. The two Edmonton stations are closer to 23km/h for most of the year, with a peak of 28km/h in May and a bottom of 20km/h in August.


And for our final chart of the day, here is how the windspeed varies throughout the day.

We are looking at 60+ years of data here, but on-average all three cities are windiest during the afternoon. For Edmonton and Winnipeg the peak is 1-2PM, while for Calgary its 3-4PM. We can also see the gaps in average windspeed, with Winnipeg's line generally about 5km/h higher than Edmonton's, and with Calgary fitting in the middle.


The End

And so at long last that brings us to the end of our look at Wind in Edmonton.

In previous posts we saw that Edmonton is not as windy as it used to be, and today we saw that something similar is true for Calgary and Winnipeg. The patterns are not identical: Edmonton's peak was firmly in 1965~1973, Winnipeg's was 1953~1975, and Calgary's 1960-1975 was with another big drop after 1990.

When wind recordings started 60 years ago these airports were all new, and in the decade to follow all of the would have undergone construction and expansion. So maybe that the wind patterns were changed as the airports were first developed? Or maybe the wind itself actually has changed? I do not know the answer to that question, and will probably never know the answer.

2020/06/05

Wind in Edmonton Part 8: Wind Direction (Again)

Today we are talking about wind direction again, with two fancy, new dashboards.

Wind Direction & Speed
This is another dashboard which does not fit into the blog well, so I would recommend following the tableau link to view it in all its glory. And for today we will be using some animations to show what it can do.


In Part 8 we looked at some dashboards which showed how often the wind is from each direction, but which didn't address the windspeed.

With this chart though we have got it all. For each little line segment:
  • the length represents the windspeed: from 0-9km/h, 10-19km/h, 20-29km/h...all the way to 80-87km/h.
  • the colours represent the relative number of hours for each windspeed range.
  • the thickness of each line segment represents the total number of hours, going back to 1953. This is logarithmic, and the thickest lines in the innermost rings are for tens of thousands of hours, while the further out rings represents hundreds or dozens of hours.
In the example above we see the most and least common wind directions for windspeeds of 20-29km/h. At both Blatchford & the International winds from the SW (or 220°) are the least common for the range of 20-29km/h, with 132 & 141 hours respectively. For Blatchford the most common direction for 20-29km/h is from the WNW (290°) with 7,248 hours, while for the International it is from the SE (140°) with 6,308 hours.

So there is a lot of information in here, and hopefully that one example helps to give some idea of what is going on.


Wind Direction & Speed Each Month

Here is another example of how the shape of the winds change from month to month.

Winds from the NW & SE are prominent all year, but the size of circles changes from the large and windy May, to the small and calm August.


Wind Direction & Speed Each Hour: 2000-2020

Here is another example of data from recent years for 2000-2020, showing how the wind changes with each hours of the day. (Blatchford is missing data for 2005-2015, so its records here area less complete).

I find that it's tough to see much of a pattern in this one, although the circles do start to get larger from about 10AM-6PM, and then shrink overnight.


Strong Winds: 2000-2020

And here is one more example for 2000-2010, showing where our strongest winds come from.

For the ranges of 30-39km/h, 40-49km/h & 50km/h the NE & SW quadrants are mostly empty because our strong winds usually come from the NW and SE.


Wind Gusts
And finally we arrive at our final dashboard, which is also best viewed at the tableau link.

In this chart each bubble represents a peak, daily wind gust going back to when records began.

Strongest Wind Gusts

This example highlights the strongest windgusts ever recorded at the two Edmonton stations:
  • for the International it was 146km/h from the NW on October 1, 1965
  • for Blatchford it was 117km/h from the W on September 11, 1973, and 117km/h from the SW on June 6, 1960.

Strongest Wind Gusts: 2000-2020

Here we have the strongest windgusts going back to 2000 (although Blatchford data is missing for 15 of those years, from 2000-2015).
  • the International's gustiest recent day was 115km/h from the NNE on August 15, 2015
  • Batchford's gustiest recent day was 105 km/h from the NNE onf July 20, 2015

Wind Dusts Each Month

Here is an example of how the wind gusts change from month to month. Looking at the little profiles along the bottom May, June & July are much more circular, while the other months tend to mostly have gusts from the NW, with a bit from the SE too.


Strong Wind Gusts

And finally, here we emphasizing the strongest wind gusts. For speeds above about 70km/h almost all of our gusts are coming from the NW quadrant, with just a few from the SE.

And that brings us to the end for today. This was mostly just an excuse to play with some fun new chart types, but hopefully it has provided a bit of insight into our windy todays.

Tomorrow we will be back with the final entry in our epic series on Wind in Edmonton.

2020/06/04

Wind in Edmonton Part 7: Wind Direction

In the first 6(!) parts of our series on Wind in Edmonton we looked at the average windspeeds, maximum windspeeds, gusts, windy days, windy months...

And today we are going to throw wind direction into the mix.

Wind Direction Total Hours

This dashboard does not fit well into the blog format, so I recommend following the link to see it in full-size in tableau. For most of today we will be using gifs as examples instead of the dashboard, because they show up better.

The blobs in this chart represent the proportion of the time that the wind comes from each direction. The size of these blobs does NOT correspond to windspeed - we will talk about that later.

In this chart a big blob to the north means a lot of hours of wind from the north. It doesn't actually tell us how windy things were, though. Right now we are looking at any hour with a windspeed of 0km/h+, which works out to over 500,000 hours per station.

Let's take a look at what this chart does tell us:

Monthly Wind Blobs

Here we are cycling through the wind profiles for each month of the year. 

I did not normally think of Edmonton as having winds from the South, but in terms of overall hours it is actually quite common. As we move through the year though the South winds are much less common in the summer months of June through September.

Wind Blobs: High Windspeeds

In this version of the chart, instead of cycling through the months of the year we are cycling through windspeeds: 0km/h+, 10km/h+, 20km/h+, etc. 

As the windspeeds increase the south winds disappear, and by the time we reach 50km/h almost everything is from the NW quadrant. So while Edmonton records a lot of hours of wind from South overall, those are mostly for low windspeeds. When we just look at high windspeeds the direction is from NW, which is what we would typically expect.

Once we hit 60km/h there isn't very much data to play with, and so the chart melts into abstract art.


Monthly Wind Blobs: 30km/h+ for Recent Years

The previous charts included all years from 1953+, but here it is filtered down to only show 2000+, and windspeeds of 30km/h. We saw in Part 3 that windspeeds of 30km/h+ only happen about 5% of the time, and so these represent the fairly "windy" recent hours. Again we see mostly winds from the NW, although the SE is prominent through a lot of the year, and moreso at the International than at Blatchford.


A Bar Graph
The blob chart is fun, but here is a more straightforward breakdowns of wind direction. This is for all the years from 1953+ and all windspeeds from 0km/h+. And as we saw with the blobs winds from the South are surprisingly the most common overall.


A Bar Graph Again: 30km/h+ for Recent Years
When we filter to just show high winds and recent years the wind from the S mostly disappears, while the NW quadrant takes over.


Hourly Wind Blobs
Here is one more version of the blobs chart which shows how the wind direction changes through the day. This is using the data for all years and all windspeeds again, and the NW winds grow from 6AM through 6PM, and then vanish (relatively) overnight.

There are a million different ways to play with this chart, and these were just a few examples.


Wind Direction During the Year
For this look at wind I just couldn't stop making dashboards, so here we have yet another way of visualizing how the wind direction shifts through the year. This is for all the years from 1953+ and all windspeeds from 0km/h+.

The orange band the wind from the South is narrowest in the summer months from June through September, and at the same time that is when the West and NW bands are largest.


Wind Direction During the Year: 30km/h+
Here we have the same chart, but we are only looking at windspeeds of 30km/h+. It is a lot messier and less uniform, but the main thing to notice is that the orange band for South has almost entirely disappeared. And the pink bar for the wind from the W is very large (25% or more) for June, July & August, but is much smaller for the rest of the year.


Wind Direction During the Day
 We are going to end things today with this very soothing looking chart, which shows how the wind directions shifts throughout the day. This is for all the years from 1953+ and all windspeeds from 0km/h+.

It's pretty complicated, and there is also variation between the Blatchford and International. Generally the bands for N, NW & W grow from 6AM-6PM, and fade in the evening and overnight, and the other directions all shift around to make up the gains for those other directions.

This last chart is fun if we filter it for windspeed:


Here we are increasing the windspeeds: 0km/h+, 10km/h+, 20km/h+...all the way to 80km/h. As we get into the higher numbers it runs out of data an collapses in on itself.

But as we initially increase the speeds up from 0km/h the band for winds from the South disappears, and the N, NW & W really take over. For windy hours the W & NW are big during the daytime hours, while strong winds from the N are more common during the evening and overnight.

And that's the end for today.

Just one final reminder that all of these charts have been about the proportion of time that the wind is from one direction or another. So everything adds up to 100%, and if one one direction has more hours then one of the other directions has fewer. And it's also important to remember that when we go from looking at all windspeeds (0km/h+) to windy hours (30km/h+) we are going from 500,000 hours down to only about 25,000 hours.

In Wind Part 8 we will take one final look at wind directions and gusts.

2020/06/02

Wind in Edmonton Part 6: Windy Months

A really short one today as we look at Edmonton's windiest months.


In this chart each of the colourful blobs represents a month that was windier than average. That is calculated based on the average windspeed for each hour of each day during the month.

Blatchford's windiest overall month was May 1973 with an average windspeed of 21.2km/h, while the International was a bit lower at 18.1km/h. 

The International's windiest month was May 1968 at 22.3km/h, and for Blatchford that ranks as #2 at 21km/h.

2 things to take from this chart are:
  • the big clump of colourful months in the 1960s, which reinforces the windy '60s which we have seen throughout this series.
  • the smaller clump of colour for the windy months of April & May.
It doesn't tell us anything that we didn't already know, but it works as a nice high-level summary.

May 2020 actually ranked as the International's 23rd windiest month (out of about 720), with an average windspeed overall of 17.7km/h. April 2020 ranked as #87 at 16.1km/h. 

At Blatchford April & May were unremarkable, with windspeeds of around 14km/h. Ever since Blatchford restarted recording again in 2015 the windspeeds have been way down from where they used to be. And it's not missing data, because all of the hours are recorded, they are just really low. This change might be due to all the construction there, including the giant hill which has been built at the north end of the former airport?

In the final posts of this series we will be looking at something new: wind direction.

Wind in Edmonton Part 5: Windy Dates & Days

Today we are going to take a look at some of the really windy days in Edmonton's history.

In Part 4 we looked at days with hours of 40km/h+ and 60km/h+, and also gusts of 80km/h+ and 100km/h+, and we will use those same breakdowns today.


Hours at 40km/h or more
Out of the 8,760 hours in a year, about 8,690 of them have windspeeds below 40km/h, which leaves on average 70 hours each year at 40km/h or more. That is just the average though, and it is based on all the data going back to 1953 for Blatchford & 1960 for the International. As we have seen earlier in our look at Edmonton's wind, the 1960s had a disproportionately high number of our windy days.

And speaking of disproportionate, May 17 is Edmonton's undisputed champion for 40km/h+ winds. Since records began Blatchford has recorded 62 hours at 40km/h+ on May 17, and the International has recorded 70. The second highest days at Blatchford all total under 35 hours, and for the International they are under 40 hours.

The most recent windy May 17 was in 2019, with 2 hours at the International. But May 17 back in 1965 had 16 hours at 40km/h+ at Blatchford at 18 hours at the International.

One other thing to notice here is how much the 40km/h hours disappear during August, especially for the International. There are a few days in there - August 10, 11, 17, 19 & 21 - which have never recorded an hourly windspeed of 40km/h, going back to 1960. Blatchford also has a few of those days early in the year - on January 15, 26, 29...


Hours at 60km/h or more
For hours at 60km/h+ May 17th loses its crown, a bit. At Blatchford January 1 & May 17 are both tied with 6 hours in total at 60km/h+. For the International June 1 is the leader with 10 hours, all in a single day in 1984.

Looking at the bubbles on the bottom, we once again see that the 1960s has a lot more bubbles than the other years. And in recent years May 24, 2017 had 2 hours with windspeeds above 60km/h, and gusts to 104km/h.


Gusts of 80km/h or more
Here we have all of the days which have recorded windgusts of 80k/h or more.

At the risk of sounding like a broken record, the band of windy days in the 1960s is visible again (and the big gap for Blatchford is 20 years of missing data from 1995-2015).

As we saw in Part 4, in recent years the International averages about 3 days with 80km/h+ gusts each year, and Blatchford is at about 1 or 2 per year.


Gusts of 100km/h or more
And finally, here are gusts of 100km/h+, which is a fairly short list.

In recent years Blatchford had gusts of 102km/h on July 20, 2015. The International had gusts of 100km/h on May 24, 2017; of 106km/h on January 15, 2014; and of 111km/h on August 15, 2015. 

And Edmonton's gustiest and windiest day was October 1, 1965 with hourly windspeeds of 87km/h and gusts up to 146km/h

One thing to notice here is that the gusty days don't necessarily have high hourly windspeeds:
  • July 20, 2015 at Blatchford recorded gusts of 102km/h but its highest hourly windspeed was only 28km/h.
  • August 15, 2015 at the International recorded gusts of 111km/h its highest hourly windspeed was only 26km/h.

Winds Again
Here we have another look at the maximum windspeed each day for the International. If you move the slider around for windspeeds of 0km/h, 20km/h, 40km/h, 60km/h... we can again see the windy 1960s, and also how relatively quiet August is.


Gusts Again
And finally, one more look at wind gusts. These were mostly just an excuse to play with a new type of chart.

And with that we are getting close to the end of our extensive look at wind, although there are still a few more posts and a few more fancy charts to go.

2020/06/01

May 2020 Review / June 2020 Preview

It's time for the month-in-review for May, 2020.

High Temperatures
Our high temperatures for May 2020 were split with 16 days above average and 15 days below. We didn't have any exceptionally hot days, but May 10th's 7.5°C was near the bottom of the 30-year range, and May 22nd's 6.9°C was getting pretty very close to the record-coldest-High of 6.0°C.

Looking at the numbers we had 11 Highs hit 20°C, which is basically right on the average. We also had one High hit 25°C, while we average about 3 of those. Recently 2016-2019 all recorded 30°C temperatures in May, but 2020 ended that 4-year streak.

For cold Highs we didn't record any Highs below 5°C, and had only 2 below 10°C, and that's all fairly typical.


Low Temperatures
Our Low temperatures for the month were also split with 16 days above average and 15 days below. May 30th's Low of 12.5°C was the warmest in 30 years, and everything else was fairly typical.

Blatchford didn't record any Lows below freezing in May 2020, with the closest on May 13th at 0.9°C. May averages about 3 frosts each year, but about half of the time May is frost-free at Blatchford.


Final Frost
Blatchford's average final frost is on May 6th, but for the winter of 2019-2020 it was back on April 19th. That is very early, and in recent years only 2012 & 1998 had an earlier date, with both on April 18th.

This chart also has data for several of the outlying stations (accessible in the upper-right corner), and the final frost in Stony Plain was also April 19th, in St. Albert & Namao it was May 13th, and at the International Airport it was all the way at the end of the month on May 28th.  


Warm & Cold Months
For a bit more historic context here we have the average High temperatures for the month of May going back to 1881. And 2020's average High of 17.3°C was our coolest May since 2014 down at 15.4°C, but it but was still very close to the long-term average and ranked as #83 warmest out of 140.

May is one of the months where our average High temperatures have not changed much over the years. That is not the case for the Lows, though:

The average Low temperature for Low has increased by close to 4°C since records began. May 2020's average Low of 5.7°C was warmer than 2019's 5.4°C, but was still a little cool for for recent years. But overall though it ranked as #37 warmest out of 140.

When we combine the Highs & Lows the mean temperature of May 2020 was just a little bit warmer than the 20th century average. Its small bubble here is on the warmer, orange side of things. Some recent Mays which were cold enough to be on the blue side were 2014, 2010, 2009, 2004, 2003, 2002, 2000...

Looking across the country Vancouver's May was 1.2°C above their average, while Toronto's was -1.3°C below theirs.

Toronto's May was interesting, though:

For Toronto (and Ottawa and Montréal) May 2020 started very cold, and ended very warm. The central cities were all at the bottom of their range at the beginning of the months, and were setting records at the end of it.


Snow
Hopefully we won't see this chart again for a few months, but we should talk about the fact that the International did record 2.4cm of snow on May 4th. We get snow about half of the time in May, and this was one of those years. 2020 and 2019 had snow, 2016-2018 didn't, 2014 & 2015 did, 2011-2013 didn't...

That brought our snow total for the winter of 2019-2020 to 128cm, which is basically right on our average.

...and the International went 210 days from the first snowfall of fall on October 7th to the last day (presumably) on May 4th.


Precipitation
For overall precipitation Blatchford recorded 78.8mm and the International recorded 97.5mm. Our average for May is 50.1mm, so this was a pretty precipitation-y May, but in recent(ish) years 2016, 2010 & 1999 all crossed the 105mm mark.

Both station recorded 12 days with precipitation in May, compared to an average of 11 days.

And that brings our total precipitation for the year so far to 134.3mm at Blatchford which is about average, and to 174.7mm at the International.


June Temperatures
For June temperatures usually about half of the month has Highs above 20°C, and there is also maybe a week of days above 25°C. Last year June 2019 was pretty typical, but then we entered into the summer-that-wasn't. Before that 2018, 2016 & 2015 all had warm Junes, with almost 2 weeks of 25°C days. For Low temperatures the last time that Blatchford had a frost in June was way back in 1942.