
Today: when is it windy?
Average Windspeed Throughout the Year
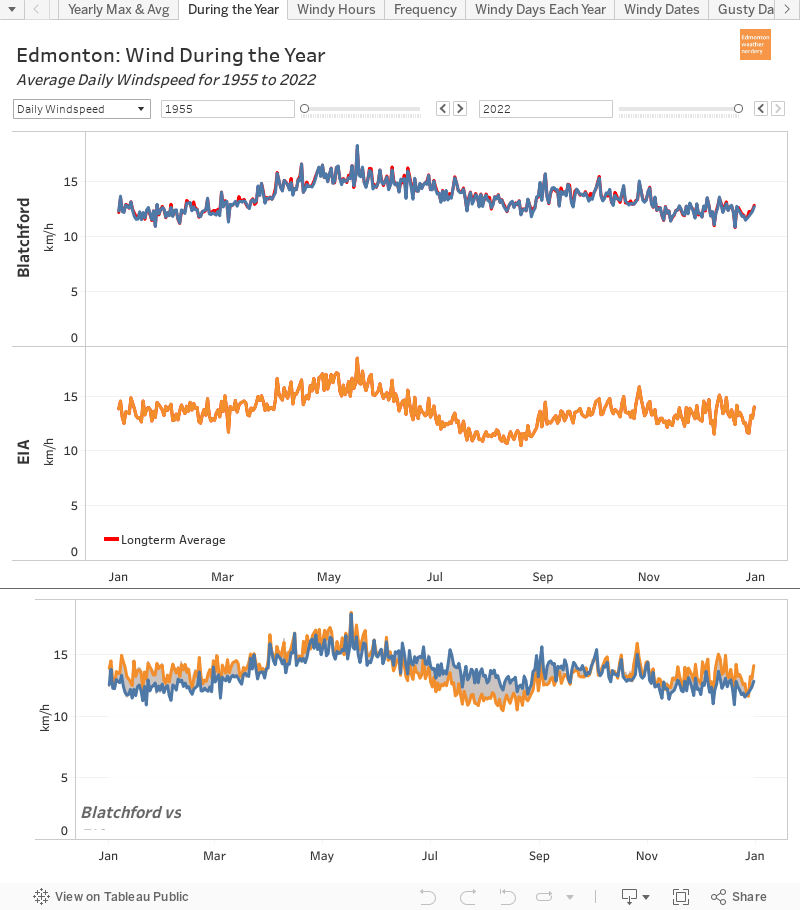
Our average windspeed is highest in mid-April through mid-June, peaking at around 16km/h in mid-May. Winds are lowest in mid-August, with Blatchford averaging about 12km/h and the International at 11km/h.
The chart above has the full history of data from 1953-2020, but in the chart below we are focusing on recent years:
 In this chart the red lines are the longterm averages for 1953-2020, and the orange & blue lines are filtered to just 2000-2020. A caution here is the Blatchford data is missing for 2005-2015, so its dataset is only half the size of the International's, but we will work with what is available.
Average Windspeed 2000-2020
So here we can see that the recent (incomplete) history for Blatchford is generally 2-3km/h below the longterm average. For the International the 2000-2020 data is basically inline with the longterm average, but with a little bit of a dip in September.
Average Windspeed 1953-1980 And here we have the average windspeed for the start of the records in 1953-1980 (the International's records don't start until 1960).
In Part 1 we saw that average windspeeds today are lower than in the 1960s. And we see that here with Blatchford's 1953-1980 average windspeeds about 2-3km/h above the longterm average, and the International's 1960-1980 is maybe 1-2km/h above the longterm.
Windiest Hour of Each Day

We can also filter this chart to look at different ranges of years. For 1953-1980 both stations were above their longterm average by 3-5km/h. For 2000-2020 Blatchford has been 3-5km/h below the longterm average (although half the data is missing) and the International is pretty close to the longterm average.
Wind Gusts During the Year


Here we have the average peak, daily wind Gusts for each station.
The average and maximum hourly windspeed were fairly seasonal, with a noticeable peak in mid-May and a lull in August, but the Gusts are much more consistent throughout the year. The average gust for the whole year is around 45km/h.
And once again we can play with the timeframes. For 1953-1980 both station were a little bit gustier than their longterm average, but they are both still quite close to the red line.
For recent years Blatchford's wind Gust data is missing from 1995-2015. So if we just focus on 2015-2020 Blatchford's Gusts are roughly 10km/h below the longterm average, while the International's are a pretty close match to the red line.
Windy Hours
Finally, here we have a look at which hours of the day are the windiest.
The average windspeed forms a really nice curve, with the windspeed peaking in the afternoon at around 1-2PM at about 15km/h. Overnight and in the early morning the average is closer to 11km/h.
The maximum windspeed doesn't have the same nice curve, and is fairly flat throughout the day.
Using the year range to filter this chart the peak moves around depending on which years are included, while for the average windspeed the peak is consistently in the 1-2PM range.
Continued in Part 3: How windy is windy?
No comments:
Post a Comment