2021/06/29

2021 Heatwave Pre-cap: Part 3 - Why Heatwaves Are Not the Whole Story

This is Part 3 of our primer on heatwaves. In Part 1 we looked at Edmonton's previous heatwaves, and in Part 2 we compared those to other cities around the country.

(if you are reading this in the distant future some of the dashboards below may have updated to reflect new data or formatting, or they may be broken, or they may no longer make sense. To see the original images for this post refer to this twitter thread.)

If your read Parts 1 & 2 (they're super interesting) you might have noticed something strange: heatwaves don't seem to be more frequent today than they were 50 or 100 years ago. What's the deal?

We will not be able to solve that mystery - it will be left to the real climate scientists out there. But we are going to point out a few interesting bits of data, and why a laser focus on heatwaves and broken records misses some of the other stuff which is going on.

We won't recap all of Parts 1 & 2 again here, but this chart from Part 2 gets to the heart of the question:

30°C Days Each Year
Here we have the number of 30°C days each year for 7 Canadian cities, going back to 1880. (Vancouver and St. John's don't get enough to bother including here, but they can be accessed from the dropdown on the upper right)

And the thing is...they're pretty flat, huh? Edmonton, Regina and Winnipeg all had a bit of a peak in the mid-1930s for some reason. For Calgary that peak was around 1920, for some reason. And for the central Canadian cities there was a bit of a lull around 1980 for some reason, and then recently things have climbed back up again.

This is just the 30°C days, but we see something similar at 32°C, 35°C, and even 28°C. There hasn't been a huge increase in hot or super-hot days each summer.

So does that mean that summer is not getting warmer? Let's take a look...


Average Summer Temperatures in Edmonton
Here we have the average High and Low summer temperatures for June, July, and August in Edmonton. Since 1880 our summer High have been fairly flat: up by 0.7°C in June, 1°C in July, and 1.2°C in August. In comparison the Lows for June are up by 3°C, and for July and August they're up by 4°C.

A 1°C change in Highs over 140 years isn't nothing. But when that 1°C is spread over an entire month it hasn't been enough (so far, anyway) to push average ~23°C days up into 30°C heatwave territory.


Average Summer Temperatures Across Canada
Here we have the same idea, with the average temperatures for June, July and August combined for each of these cities.

For all of these cities the Highs have been fairly flat:

  • Vancouver had a weird spike around 1930, but is now at the same level as a century ago.
  • Edmonton is up by 0.9°C.
  • Calgary had a weird spike around 1920, but is flat over the century.
  • Regina had a weird spike around 1940, and is up by 1.1°C.
  • Winnipeg also had a spike around 1940, and is up by 0.4°C.
  • Toronto has 40 years more history than most of the other cities, and is up by 3°C.
  • Ottawa is up by 0.5°C.
  • Montréal is up by 1.4°C.
  • St. John's is flat overall.

Of all of these cities Toronto and Montréal are the only ones which have had a reasonably consistent increase in their Highs. And then Regina and Edmonton are next with more wobbly paths to their 1°C increases.

For the Lows Vancouver, Edmonton, Calgary and Toronto are all way up, by 3~4°C. Below that Regina, Winnipeg, and St. John's have warmed by 1~2°C. And for Ottawa and Montréal the Lows have been fairly flat.

So the point of all of this is that during the summer everyone always wants to talk about the High temperatures, with their heatwaves and new records. But for a lot of Canada (especially western Canada) the Low temperatures are the real news.


Warmest and Coolest Summers
This is another way to look at it, with the history of the warmest and coldest average High temperatures during the summer, compared to the 20th century average. Cities like Edmonton, Calgary, Toronto, Ottawa and Montréal have seen a number of warm summers in recent years, but generally the warm/cold mix is fairly all over the place.

But meanwhile for the Lows...

For the average summer Low temperatures Regina, Winnipeg and Ottawa haven't really seen anything special recently. But all of the other cities have had lots of orange bars since 2000.


It's just cities though, right?
A reasonable assumption is that the reason the Highs and Lows have increased is because Toronto, Vancouver, Edmonton and the others are cities, and cities are warm. And so here we have the average Highs and Lows for June, July and August again, but this time it is for Edmonton and 3 nearby rural stations.

Again we see Edmonton's flat~ish Highs, and a big increase in Lows. But we see something similar for the rural stations as well.

(What was going on with Scion's High temperatures around 1950? No idea. It only happened to the Highs and not the Lows, and it's only at that station, and it's a mystery.)


This chart has the same data as the previous one, but to make it easier to compare here the temperature changes are relative to 1915-1925, when the recordings for the rural stations all started.

Viewed this way Blatchford's Highs warmed a little bit less that Campsie and Calmar, and its Lows warmed a little bit more. Scion is all over the place, and its Highs were similar to Edmonton's, while its Lows were the warmest of the batch. 

The point of all of this is just to show that Edmonton's warming isn't only because it is a city. The rural stations aren't a perfect match to Edmonton, but they are not flat and have warmed along with the city.   


Rural versus Urban Across Canada
And finally, here we have one more example of urban and rural stations across Canada. It's tough to find rural stations with long temperature histories, and these 5 are some of the best that Environment Canada has got.

There is a lot going on here, but the point again is that cities do not warm only because they are cities. The Lows for the rural stations in BC, Alberta, Saskatchewan and Ontario all look very similar to their big city neighbours. And for the Highs for the BC, Alberta and Quebec stations all look like their cities.

Again, these definitely aren't a perfect match. But warming also definitely is not limited to the big cities.

One day here at Edmonton Weather Nerdery we will do a giant series of writeups on the heat island effect, and the temperature differences between urban and rural stations. Today is not that day though, and so we will leave things with this quick comparison of a few cities and their neighbouring stations.

2021/06/26

2021 Heatwave Pre-cap: Part 2

In Part 1 we looked at some of Edmonton's hottest days and longest heatwaves. Today in Part 2 we will compare Edmonton to some of Canada's notably hotter cities.
 

30°C Heatwaves Across Canada
Here are the longest 30°C heatwaves for cities across Canada. (normally we would also include Vancouver and St. John's, but they have so few 30°C days that they're not worth it. They can still be accessed from the dropdown at the upper right, though).

As we saw in Part 1 Edmonton's longest 30°C heatwave lasted 6 days in 1961. For Calgary the record was 8 days back in 1917. Winnipeg, Toronto, Ottawa and Montréal are all in the range of 10-13 days, with Ottawa's happening last summer in July 2020.

This isn't much of a contest though, because the city here with the longest heatwave by far is Regina, with a 24 day run of Highs at 30°C or warmer from June 22 through July 15th 1886. That basically doubles any other city here. It is so long that it seems suspicious, but if you are curious about the data it is available here.

If we ignore the all-time records and look at more typical years, for Edmonton and Calgary most of the 30°C heatwaves aren't more than about 3 days long. For Winnipeg 4 days would be pretty common. And for the other cities 6 or even 7 days are not unusual.


Days Without Hitting 30°C
Flipping things around for a second, in this chart we have how long each of these cities has gone without a 30°C day.

Most of the cities here will hit 30°C each summer, so they don't go more than about 350 days.

Edmonton and Calgary are the exceptions though, with Calgary going 1,449 days from September 1900 through July 1904 without hitting 30°C. For Edmonton the record was 1,063 from August 1998 through July 2001. And in this chart any of the other peaks which are extra-tall are going to be years which missed hitting 30°C.    


30°C Days Each Year
Here we have the number of 30°C days each year, back through history.

Edmonton is down at the bottom averaging 3~4 each year, while Calgary gets 5~6. On the warmer side of things Montréal averages 11~12, while Regina and Winnipeg are at 13~14. And at the top Toronto and Ottawa average 15~18 30°C days each year.

For Edmonton, Regina and Winnipeg the number of 30°C days was highest around the mid-1930s, and for Calgary it was around 1920. For Toronto, Ottawa and Montréal there has all been a slight uptick in recent years, but the level is not too different from where it was in the 1940s or 1920s.


32°C Days Each Year
Here we have the number of 32°C each year. Edmonton barely registers, while Calgary averages 1~2 each year. Montréal is next averaging around 5, although it had a record 13 in 2020. Winnipeg gets around 5, Regina around 6, and Toronto and Ottawa around 8.


32°C Heatwaves
These are the longest 32°C heatwaves for these cities.
  • For Edmonton the record was 4 days, back in 1961 again.
  • Calgary had 5 days back in 1914, but hasn't gone more than 3 days since 1941.
  • Montréal has had two 6-day 32°C streaks, in 1963 and last summer in 2020.
  • Toronto has had two 7-day streaks in 1921 and 1936. The last time it went more than 5 days was 1948, though.
  • Ottawa went 7 days in 2018, and 8 days in 1944.
  • Regina went 7 days in 2003, and 8 in 1920 and 1937.
  • And Winnipeg  also went 7 days in 2003, and 10 days 1936.


35°C Days Each Year
And finally, here we have the super-hot 35°C Highs.

Montréal barely registers, with about 21 of them over 140 years. In Ottawa, Toronto, and Winnipeg it's a little more frequent, hitting 35°C every few years. And Regina is the most reliable city to hit 35°C with many years getting 1 or 2, although there was a gap from 2008-2016.       


35°C Heatwaves
And finally-finally, these are the longest 35°C heatwaves for these cities.

Even though Edmonton has barely had any 35°C days, we did have a 3-day heatwave back in 1924. That is longer than either Calgary or Montréal, which both topped-out at 2 days in-a-row. Winnipeg and Ottawa have both gone 4 days. And Regina and Toronto both went 5 days, in 1931 and 1911 respectively.

Hopefully this has been an exhaustive and trivia-filled look at heatwaves in Canadian cities. We will be back with a Part 3 to look at how the number of hot days doesn't seem to have changed much over the years. And in a week or so we will see how this latest heatwave compared for Edmonton and the other cities.

2021/06/25

2021 Heatwave Pre-cap: Part 1

Heatwave trivia will be in high demand during the next week, so let's take a quick look at Edmonton's history of heatwaves. In Part 2 we will see how Edmonton compares to some other Canadian cities.

Records Highs
The light orange line at the top of this chart is the record High temperature for each day from June 15th through July 15th. When this heatwave is over we will see how many records were broken, and how close we got to others.

At this time of year all of the record Highs are at least 30°C. June 24th and 25th are both at the low end right at 30°C, while for June 26th the record is 34°C. For June 29th the record is 37.2°C, which was Edmonton's warmest temperature on record.


30°C Days In-A-Row
For heatwaves, here is Edmonton's history of the longest stretches of days with Highs of 30°C or more. 

The record is 6 days, ending on June 7th 1961. Next up is July 1941 with a 5 days. And 4 days stretches happened in 1912, 1919, 1922, 1924, 1933, 1936, 1965, 1975, 2002 and 2008.


The Summer of 1961
These are what the Highs looked like for the summer of 1961.

The 6-day heatwave was at the start of June on the far left, and it set records on June 4, 5 and 6 which still stand today. That summer also had 3 other records which are still standing: June 15th, July 14th and August 15th.

The average High for June-August 1961 was 24.7°C, which ranks as our #1 warmest-recorded June-August. The #2 warmest was just a few years ago in 2015 at 24.6°C, and more typically the average is around 22.5°C. 


30°C Days Each Year
Edmonton isn't known for hot days, but on average we hit 30°C about 3~4 times per year. That average has gone up and down over the years, and it peaked in the mid-1930s at an average of 8 30°C days each year.

From year to year there is still a lot of variation though, with most years only getting 1 or 2 (2020, 2019, 2016, 2013), while others get more (2018 with 7, 2017 with 6, 2015 with 2015 with 9, etc). 

The year with the most 30°C days was 1961 with 14, which includes its 6-day heatwave. 2002 and 1933 both had 13.


35°C Days Each Year
The chart above shows the count of Edmonton's 35°C days, and it's a pretty bare chart because there have only been 5 of them.
  • Edmonton's most "recent" 35°C was June 29, 1937 at 37.2°C. That was our warmest-ever recorded temperature, and our only day above 37°C.
  • August 18, 1933 hit 35.6°C.
  • July 1-3, 1924 had 3 35°C days in-a-row, with Highs of 35.6°C, 36.7°C (our 2nd warmest-ever day), and 35.0°C respectively.

So super-hot 35°C days don't happen very often (and haven't happened in 84 years) but:
  • In recent years we hit 34°C in 2018, 2015, 2008, 2006, and twice in 2002.
  • 32°C happens about every other year. Recently 2018, 2015, and 2009 had 2 of them; 2008 and 2006 had 3; and 2002 hit 32°C 6 times.


The Summer of 1937
Here we have the Highs for 1937, which included our warmest-ever day at 37.2°C. The day before that was a toasty 32.2°C, and the day after was down at 23.3°C. Overall 1937 was only our 48th warmest June-August.


The Summer of 1924
And for one more, here are the Highs for the summer of 1924. This included 3 35°C days in-a-row on July 1-3. Overall though this only ended up as our 78th warmest June-August, with lots of blue, below-average days from mid-July through the end of August.


So that is a quick primer on Edmonton's heatwaves. In Part 2 we will take a look at some other Canadian cities.

2021/06/01

May 2021 Review

It's time for our look back at May 2021. This one will be a little long, because this month had a bit of everything.

High Temperatures
May 2021's High temperatures were probably the least interesting part of the month, with 13 Highs below average and the rest above.

We didn't have any scorching hot days, or any days that were really, really cold, although the 8th, 19th and 20th did dip down near the bottom of our 30-year range.

On average in May we have about 10 days with Highs which hit 20°C, and in 2021 we were just a bit above that with 11. 

May also averages around 2 days which hit 25°C, and 2021 didn't have any, although the 30th came very close at 24.6°C. In recent years the only Mays which didn't hit 25°C were 2021, 2011, 2009, 2005, 2000 and 1996.

We had 3 days with Highs below 10°C, which is right on the average for May. Our coldest High was 5.6°C on May 20th. The last time that we had a May day with a High below 5°C was 2015.


Low Temperatures
The Lows were a little bit more interesting than the Highs. A record warmest Low of 13.4°C was set on May 16th, and then 2 days later temperatures plunged down to near the bottom of the 30-year range for the 18th through 21st, and that included 2 late frosts on the 20th and 21st.

Frost in May is fairly common at Blatchford, and will happen about half of the time. But that frost usually comes early in the month, and after May 15th Blatchford is usually "fairly" safe from frost. But that didn't happen this year, with frosts on May 20th and 21st, which were the latest frosts that Blatchford had seen since 2009.


Final Frost
Around the region Blatchford and Stony Plain both recorded their final frost on May 21st, which is several weeks later than their average.

For the International Airport and Campsie right now the final frost was on May 22nd, and that would actually be early for both of those stations, although at those stations there's always a chance of a later frost coming in June.

For some of our prairie neighbours, assuming that things don't cool off again then Calgary and Winnipeg had their final frosts right around their average, while Regina's was a week and a half early.


Warm and Cold Months
May 2021 wasn't cold, but it wasn't particularly hot either. Its average High of 16.9°C ranked as only our 96th warmest since 1880, while the average Low of 5.2°C was 56th warmest.

In this chart months which were warmer than the 20th century average are orange bubbles, and cooler months are blue.
...May 2021 is a tiny bubble here, because it's overall temperature matched May's 20th century average.
Recently May 2018 & 2017 were warm, while 2014, 2010 & 2011 were cool.
For 2021 so far we've had a warm Jan, cold Feb, warm Mar, slightly warm Apr, and an average May.


May 2021 shows up as a tiny little bubble here, because its overall temperature was a perfect match for May's 20th century average. Recently May 2018 and 2017 were above average, while 2014, 2010 and 2011 were notably below.

So far for 2021 we've had a warm January (relatively), cold February, warm March, just slightly warm April, and an average May.

Looking across Canada May 2021 was average~cool in Vancouver and the prairie cities, and warm-ish in the cities in Ontario and Quebec, as well as in St. John's. Montréal had the largest difference at 1.3°C warmer than its long-term average for May.


Snow
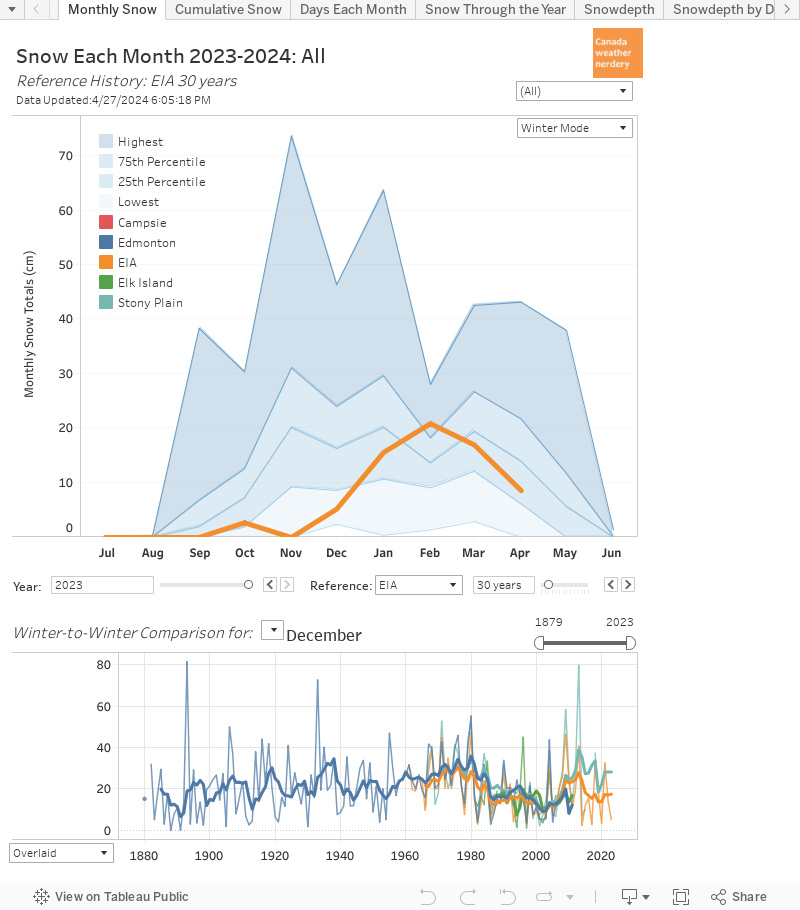
So yeah, we got snow in May, with the International recording 9cm. That's about double May's average of 5cm.

About half of the time May doesn't get any snow: recently May 2021, 2020, 2019, 2015 and 2014 all had some snow, while 2018, 2017, 2016, 2013, 2012 and 2011 were snowfree.

While May gets some snow about half of the time, the average date of our final snowfall is April 29th. 2021's final snow on May 19th was several weeks after the average, and was the latest snowfall since 2011's June 4th. 

Our first snowfall of the winter was back on October 16th, and so the winter of 2020-2021 went 216 days (7 months) from first to final snow, and that is right around average.

It wasn't only Edmonton with May snow, because Calgary recorded 7.8cm and St. John's had 3.6cm. (Regina and Winnipeg also maybe got some snow, but Regina doesn't record snow anymore and Winnipeg's snow records are a little spotty)

For the winter overall the airport recorded 82.5cm of snow. That was well below the average of 125cm, and ranked as the airport's 10th least-snowy winter, going back to 1960.

This chart is always pretty messy, but it shows the cumulative snow totals for other Canadian cities for the winter of 2020-2021. Vancouver is predictably at the bottom with 12.6cm. Winnipeg was next with 66cm (a combination of a truly dry winter, and spotty measurements), and then Edmonton is next with its 85cm. St. John's was at the top with 289cm.


Precipitation
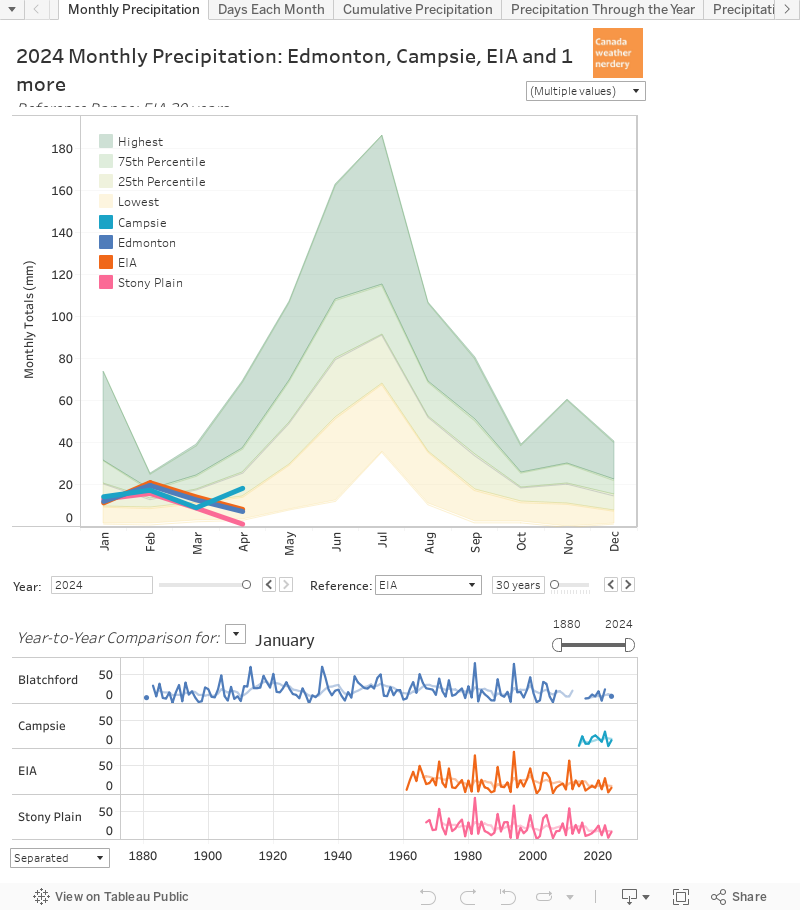
Along with the late snow we also had a fair amount of rain in May 2021. May averages about 52mm of combined precipitation (rain + snow), and Blatchford, Stony Plain and the International were all about that.

The International had the most with 91.2mm, which was its 7th rainiest May on record, and just a bit below 2020's 97.5mm.

We had had a very dry start to 2021, but the above-average precipitation in May has pushed the International up to a total of 132mm, which is right on the average for the end of May. Blatchford and Stony Plain are still below average, but they aren't cruising along the very bottom of our typical range like they were a month ago.

Even though the total precipitation in May was above average, the number of days with precipitation wasn't unusual. 

In May we average 11 days with precipitation, and Stony Plain and the airport were right around average, while Blatchford was a little low. As we head into summer we are also heading into our rainy season, with June and July both averaging around 15 rainy days. 

The bubbles at the bottom of this chart show the individual precipitation events, and the International had a really large 45.8mm day on May 18th, while Blatchford and Stony Plain peaked at a little below 30mm.

45cm of precipitation in a day is a lot for Edmonton, and this chart has the history of 45cm+ days for the International going back to 1960. 

The last time that it happened was July 25, 2014 with 46mm of rain, and before that July 29, 2001 with 57mm.

May 18th's storm was the earliest 45cm day recorded at International, because normally when we get that much precipitation it will be during a summer thunderstorm. The next earliest was June 15, 1973.


June Temperatures
As we head into June usually about half of the month has Highs above 20°C, and there is also maybe a week of days above 25°C. For Low temperatures the last time that Blatchford had a frost in June was way back in 1942. The last time that June had snow was 2011, so it's not impossible, but it has only happened in 2011, 1967, 1922 and 1888.