2020/05/28

Wind in Edmonton Part 4: How many windy days do we get each year?

A quick recap:
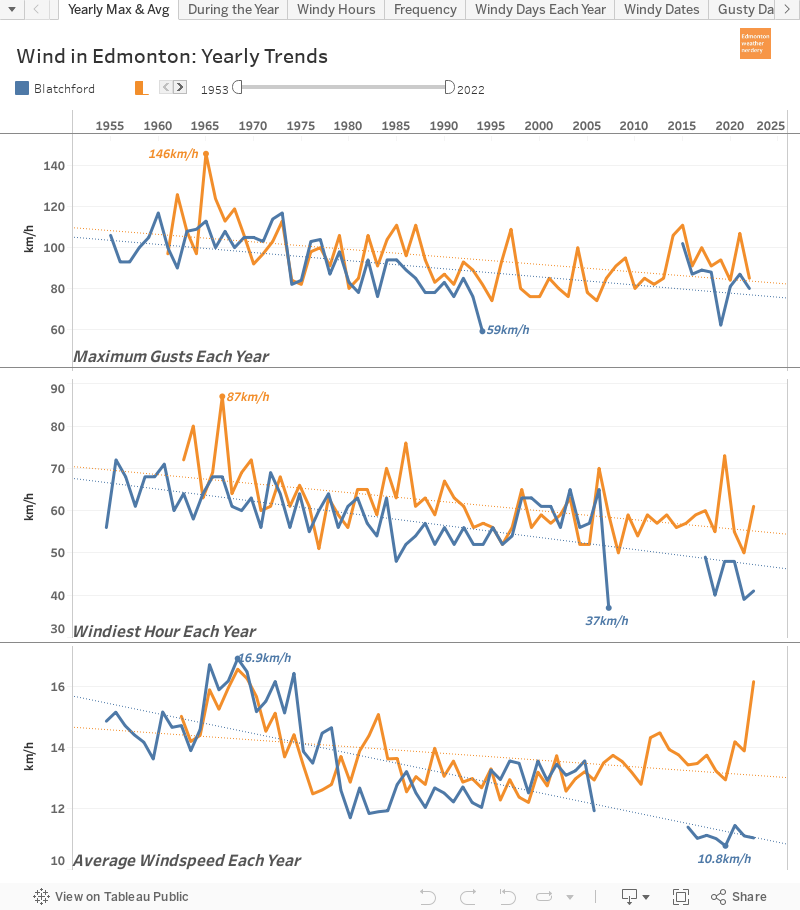
  • In Part 1 we saw that our average windspeed is about 13km/h, and that windspeeds have dropped since the 1960s.
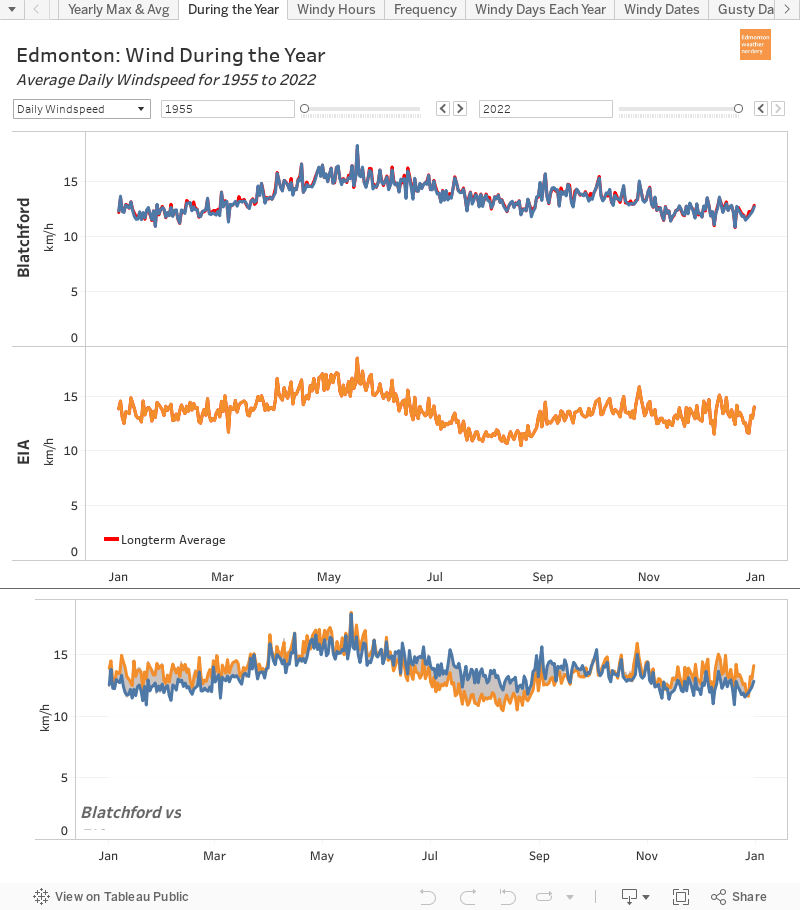
  • In Part 2 we saw that windspeeds vary throughout the year, and typically peak in May.
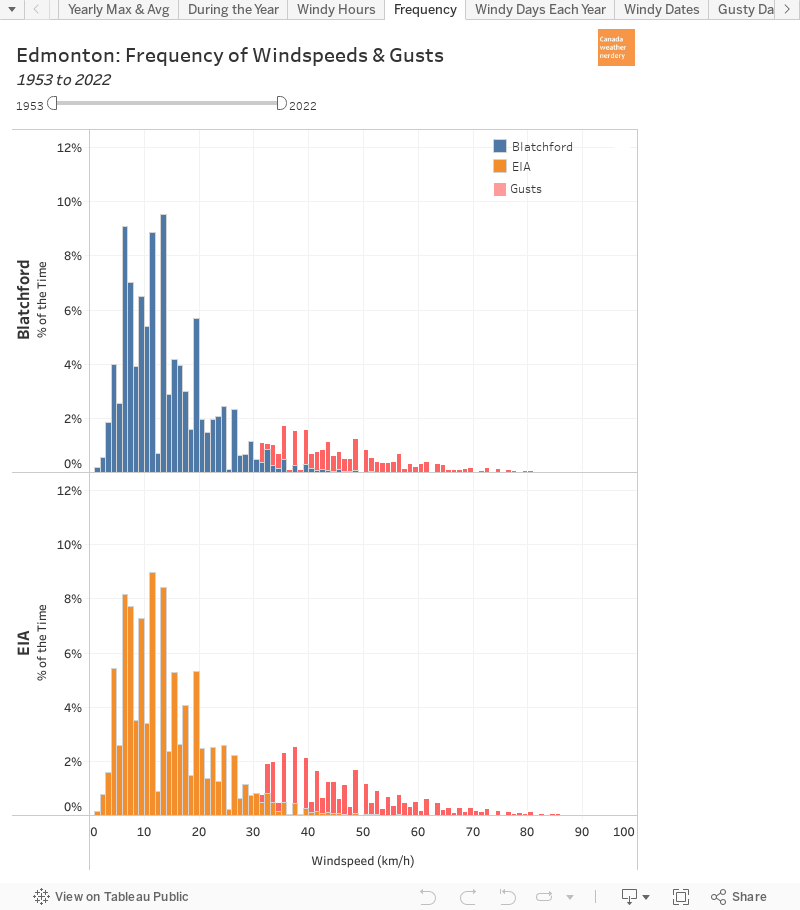
  • In Part 3 we saw that hourly windspeeds of 30km/h or more are pretty uncommon (4% of the time), at 40km/h are very uncommon (0.8% of the time), and at 50km/h are extremely uncommon (0.1% of the time, or about 9 hours each year).
Today we are going to take a close look at Edmonton's windy days.


Days with Windspeeds of 40km/h+
This chart has a lot of things going on.

The top section is a count of the days each year with any hourly windspeeds of 40km/h or more. The 1960s stand out with an average of more than 40 days per year at the 40km/h mark at both stations. After that things quickly drop off to 20 days or less per year, and for Blatchford the 1980s were very low down at 10 days per year. Blatchford's data is missing for 2005-2015, and after 2015 its numbers are very low, although the International's are still around the 20 day mark.

The lower left section of the chart shows the windiest hour of each day, with highlights for any at 40km/h or more. So far in 2020 the International has recorded 17 km/h days, while Blatchford has only had 1: April 26th at 41km/h.

The lower right section shows the windspeeds and gusts for a specific date: in this case April 26th, 2020 with Blatchford peaking at 41km/h and the International at 42km/h

By clicking through the chart you can select different years, different dates, different windspeeds, etc.


Days with Windspeeds of 60km/h+
For another example, here are the 60km/h+ days.

The 1960s stand out again, with a average of 3 days per year. For every other decade 60km/h+ are much less frequent, if they happen at all.

The most recent year with an hourly windspeed of 60km/h+ was 2017, which is shown at the bottom. On May 24, 2017 the International hit 73km/h at 3pm, while Blatchford's windiest hour reached 48km/h.


Days with Gusts of 80km/h+
Here we have switched from hourly Windspeeds to daily Gusts of 80km/h or more. So far in 2020 the International has recorded 2 days with gusts that high (April 26th & 30th) and Blatchford hasn't had any.

Right now the International averages about 3 days per year with 80km/h gusts, and back in the 1960s it was up at 12 days per year. In the 1960s Blatchford averaged 8 gusts days per year, and unfortunately its recent years are unreliable because the wind Gust data is missing for 1995-2015.


Days with Gusts of 100km/h+
And here we have taken one final step up to gusts of 100km/h or more.

In recent years the International has hit the 100km/h mark:
  • on May 24, 2017 at 100km/h
  • on January 15, 2014 at 106km/h
  • on December 19, 2004 at 100km/h
  • and Blatchford hit 102km/h on July 20th, 2015
Before that we have to go back to 1997, and before that 1987 for the International. And for Blatchford we have to go all the way back to 1977 (although again, 1995-2005 as missing).

And one last time we see that the 1960s were the peak for gusty days, with Blatchford hitting 100km/h about once per year, and the International way up at about 5 days per year for 1965-1968.

So in Part 1 we saw that our average windspeeds today are lower than they were when records started in the 1960s. And today we have also seen that the 1960s recorded consistently more really windy days than what we are used to today.

2020/05/27

Wind in Edmonton Part 3: How windy is windy?

Earlier in our epic look at Wind in Edmonton we saw that Environment Canada records two types of wind data:
  • Hourly windspeed
    • From Environment Canada: "The average speed during the one-, two- or ten-minute period ending at the time of observation."
  • Daily speed of maximum gusts
    • From Environment Canada: "The gust is the maximum or peak instantaneous or single reading from the anemometer (the instrument used to observe wind speed) during the day. The duration of a gust typically corresponds to an elapsed time of 3 to 5 seconds."
 Today we are going to take a closer look at what those actually look like.

Here the hourly windspeeds are in blue and orange. The recorded windspeeds stretch from 0 to 87km/h, but they become pretty rare after about 30km/h. Only 4% of our hours are 30km/h or more, 0.8% are 40km/h or more, and 0.1% are 50km/h or more.

The hourly windspeeds are centred around 13km/h, which matches what we saw in Parts 1 & 2.

The daily gusts are shown in pink. They stretch from 30km/h to 146km/h, although to keep things simple this chart cuts them off at 100km/h. Most of the gusts are clustered in the 30-50km/h range, and they start to taper off over about 60km/h. 

We will take a closer look at the windiest hours and the gustiest days later in this series.

Weird Data
There are a few fun quirks in the data to point out:
  • From 1953-1975 neither station recorded windspeeds of 4, 7, 9, 12, 15, 17, 20, 22, 25, 28 or 30km/h. There are 0 records during those two decades for those windspeeds.
  • From 1980-2020 things sort of reversed, and 4, 6, 7, 9, 11, 13, 15, 17, 19, 20, 22, 24, 26 & 28km/h were all recorded nearly 10x more frequently than their neighbours.
So it's not quite the odd numbers, and it's not quite the even numbers. Once the numbers flip the end result is that neither station has recorded very many hours at either 12km/h or 25km/h (two notable gaps in the first chart from today).

And also, in this second chart Blatchford's recorded gusts are much lower than the International's because the data is missing for 1995-2015.

2020/05/26

Wind in Edmonton Part 2: When is it windy?

Today we are continuing our multi-part look at wind data for Edmonton.

Today: when is it windy?

Average Windspeed Throughout the Year
Here we have the average windspeed throughout the year, and how Blatchford and the International Airport compare.

Our average windspeed is highest in mid-April through mid-June, peaking at around 16km/h in mid-May. Winds are lowest in mid-August, with Blatchford averaging about 12km/h and the International at 11km/h.

The chart above has the full history of data from 1953-2020, but in the chart below we are focusing on recent years:

Average Windspeed 2000-2020
In this chart the red lines are the longterm averages for 1953-2020, and the orange & blue lines are filtered to just 2000-2020. A caution here is the Blatchford data is missing for 2005-2015, so its dataset is only half the size of the International's, but we will work with what is available.

So here we can see that the recent (incomplete) history for Blatchford is generally 2-3km/h below the longterm average. For the International the 2000-2020 data is basically inline with the longterm average, but with a little bit of a dip in September.

Average Windspeed 1953-1980
And here we have the average windspeed for the start of the records in 1953-1980 (the International's records don't start until 1960).

In Part 1 we saw that average windspeeds today are lower than in the 1960s. And we see that here with Blatchford's 1953-1980 average windspeeds about 2-3km/h above the longterm average, and the International's 1960-1980 is maybe 1-2km/h above the longterm.

Windiest Hour of Each Day
This chart also includes the average windiest hour for each day of the year. That also peak in mid-May at 28-30km/h for the two stations. Blatchford's lowest-highest winds are in January and December at 20km/h, while the International bottoms-out in August also at 20km/h.

We can also filter this chart to look at different ranges of years. For 1953-1980 both stations were above their longterm average by 3-5km/h. For 2000-2020 Blatchford has been 3-5km/h below the longterm average (although half the data is missing) and the International is pretty close to the longterm average.


Wind Gusts During the Year
Here we have the average peak, daily wind Gusts for each station.

The average and maximum hourly windspeed were fairly seasonal, with a noticeable peak in mid-May and a lull in August, but the Gusts are much more consistent throughout the year. The average gust for the whole year is around 45km/h.

And once again we can play with the timeframes. For 1953-1980 both station were a little bit gustier than their longterm average, but they are both still quite close to the red line.

For recent years Blatchford's wind Gust data is missing from 1995-2015. So if we just focus on 2015-2020 Blatchford's Gusts are roughly 10km/h below the longterm average, while the International's are a pretty close match to the red line.

Windy Hours
Finally, here we have a look at which hours of the day are the windiest.

The average windspeed forms a really nice curve, with the windspeed peaking in the afternoon at around 1-2PM at about 15km/h. Overnight and in the early morning the average is closer to 11km/h.

The maximum windspeed doesn't have the same nice curve, and is fairly flat throughout the day.

Using the year range to filter this chart the peak moves around depending on which years are included, while for the average windspeed the peak is consistently in the 1-2PM range.

2020/05/25

Wind in Edmonton Part 1 (of many): Is it windier than it used to be?

Today is the start of what will be a multi-part look at wind in Edmonton. We have never really talked about wind before, but we are going to make up for that right now with an epic odyssey of posts and charts.

Hopefully at the end of it we will have answered a whole bunch of questions about wind...or at least provided some pretty dashboards to dig further into the data.

For this we are using two types of data for both Blatchford & the International Airport:
  • Hourly windspeed
    • From Environment Canada: "The average speed during the one-, two- or ten-minute period ending at the time of observation."
  • Daily speed of maximum gusts
    • From Environment Canada: "The gust is the maximum or peak instantaneous or single reading from the anemometer (the instrument used to observe wind speed) during the day. The duration of a gust typically corresponds to an elapsed time of 3 to 5 seconds."
  • At Blatchford the Hourly windspeed data is missing for 2005 through 2015, and the Daily gust data is missing for 1995 through 2015. That's unfortunate, but what are you going to do?
There is a lot to talk about here, and so we are going to break it down into bite-sized chunks. 

To get things started we will look at what is perhaps the most important question:

Is it windier than it used to be?

The short answer is: No.

This chart shows three things:
  • the maximum daily wind gust each year
  • the windiest hour each year
  • the average windspeed each year
And all three of those metrics are down from when records began in the 1950s & 1960s.


Blatchford's Lost Years
One thing to point out is the gaps in Blatchford's data, and that when recordings resumed in 2015 things were quite a bit lower than they used to be. We will look at how these gaps affect the Blatchford data in later parts of this series. But generally:
  • The average windspeed was very high in the late 1960s at 16-17km/h, and by 1980 had fallen to 13km/h. It hung out there until the readings stopped in 2005, and since 2015 it has been below 12km/h.
  • The windiest hour each year was around 60-70km/h in the late-1960s, dropped to 50-60km/h for the 1980s and early-1990s, and then bounced back up a little bit for 1995-2005. But since 2015 it's been way down around 50 km/h.
  • The strongest gust each year was on a slow decline from about 110km/h during the 1960s to 90km/h by the 1990s. And since 2015 it's been in the 90km/h range again.

The International Airport
For the International:
  • The average windspeed was also very high in the late 1960s at 16-17km/h, and by 1990 had fallen to 13km/h. Focusing on the range from about 2000-2020, it is fair to say that the average windspeeds have maybe edged up a bit.
  • The windiest hour each year was around 60-70km/h in the late-1960s, but since 1990 it has typically been in the 50-60km/h range.
  • The strongest gust each year was in the 100-120 km/h range in the 1960s, but dropped to the 80-100km/h range from about 1980 onward. And in the past few years there's maybe been a tiny bump, but it's below the 1980s and well below the 1960s.
"Is it windier than it used to be?" is a complicated question, because new construction and development can definitely create localized windtunnels in certain areas. But if you are standing in the middle of an airport, a soccerfield, a golfcourse, or in the rivervalley, theoretically it is less windy now than it used to be.

May 2020 Mini-Flood

On the weekend there were warnings to stay clear of the North Saskatchewan, because the big rain from last week was leading to a big increase in water.

Recent History
Here we the river depth and streamflow going back to 2015, and every spring/summer there are spikes.

This one was a fairly large one though, with the depth jumping from 4m on May 19th up to 7.6m on the 23rd. Along with that the streamflow increased by about 6x from 350m³/s up to 1,811m³/s.


1911+
For a bit more context here we have the full recorded history. Streamflow readings go all the way back to 1911, but unfortunately daily depth measurements only go back to 1999 (although some of the notable floods are also shown).

May 2020's 7.63m was well below the biggest floods. The great flood of June 29, 1915 was way up a 13.73m, July 19, 1986 was around 12m, and 4 other floods were close to the 10m mark.

And recently the mini-floods of 2013 reached 9.25m, 2005 hit 8.85m, 2003 hit 8.17m, and 2011 hit 7.82m.

So May 2020's mini-flood was a lot of water, but not all that unusual.


During the Year
This chart shows how the river depth and streamflow vary throughout the year.

And the mini-flood of May 2020 was definitely big enough to makes its presence known, but it's well below the really big years.

We are right in the middle of high-water season, although the really big floods usually happened in June & July.


1,800m³/s
Here is the same chart, but it is cleaned up a little bit to only show the years with streamflows of 1,800m³/s.

There have only been 19 years to get that high, most recently 2013, 2011, 2005...


Streamflow History (again)
Here's one more pretty chart which collapses all of the streamflow data for 1911-2020.

Here the various spikes are nicely visible, and you get a sense of how they are spread throughout the year, and throughout the years.

This chart can also be filtered to only show the 1,800m³/s+ years:

...and we can see that our little flood was pretty early in the year, and there might be more to come?

So that was a quick look at this recent mini-flood. If you are interested in a bit more historical context we took a deeper dive into the river data last year in: The North Saskatchewan River - from Top to Bottom

2020/05/01

April 2020 Review / May 2020 Preview

It's time for our look back at April 2020. Things ended pretty well, which almost makes it easy to forget how it started.


High Temperatures
The High temperatures started the month right at the bottom of the 30-year range, with 3 30-year-coldest Highs on the 1st, 2nd and 12th. And we finished the month with 12 days above average, including a 30-year-warmest High on the 29th at 21.5°C.


Looking at the numbers, we had 1 High below -10°C with a -10.9°C on April 1st. The last time that we had a High below -10°C in April was almost 40 years ago, with a -12.4°C on April 2nd, 1982. We also had 3 other Highs below -5°C, compared to the April average of about 1.

On the warmer side of things we had 2 Highs hit 20°C, with 20.3°C on April 20th & 21.5°C on April 29th (and the 21st came very close, with 19.9°C). April averages about 2 Highs at 20°C, and recently 2015, 2016 & 2018 also had 25°C days.

April's average High of 8.1°C wasn't as cold as recent years like 2002's 4.3°C or 2013's 5.2°C, but it was still on the cooler side of recent years.


Low Temperatures
The Lows also started the month right at the bottom of the range, with 3 30-year-coldest Lows on the 1st, 2nd & 12th. Things warmed up to above average at the end of the month, and the Low of 7.1°C was a 30-year-warmest Low.


The Low of -20.8°C on April 2nd was the first -20°C in April since -21.7°C way back on April 3rd, 1982. We also had two more Lows below -15°C, and since 2000 only 2002 and 2018 had any temperatures that cold. In total we had 6 Lows below -10°C, and on average April on has 1.2 of those.

On the warmer side of things we had 12 Lows above freezing, compared to an average of about 14.

April's average Low of -2.7°C was warmer than the -5°C in 2002 or -3.5°C in 2013 & 2018. but it was still cooler than most recent April.


Warm & Cold Months
Here we have a history of the average of the High temperatures for each April. April is one of the few months (along with October) where the average temperatures have stayed fairly constant over time.

2020's 8°C was below the recent average and the longterm averge. But it was above recent cool years like 2002 & 2013. It was also far above our coldest April's like 1920, 1948 & 1954 which averaged around 2°C, or almost 6°C cooler than April 2020. Overall it the Highs ranked as #107 warmest since 1880.

If you flip this chart to show the Lows, 2020's -2.7°C was again below average, but was similar to 1997, 2008, 2013 & 2018. And then years like 1887, 1948 & 1954 were down below -7°C. The Lows ranked as #103.


When we add up the Highs & Lows, April 2020's mean temperature of 2.7°C was -1.9°C cooler than the 20th century average, which makes it a medium-sized blue bubble on our chart here. March 2020 was similarly cool, at -1.5°C below the 20th century average.


And April wasn't just cool in Edmonton. All 9 of the cities which we have data for came in cooler than the 20th century average. Regina's very cool April was -2.9°C below their average, which followed a warm March for them at 3.9°C above their average.

And for some trivia, two years ago April 2018 was another month of mostly blue bubbles, with Vancouver as the only city above its average.


As always, this chart is more about looking cool than being readable.

But the circles down at the bottom do a nice job of showing our progression through the year so far. The orange & blue spikes of the 20th Century Average circle show when we were warmer or colder than normal. And the blue of the Compared to 0°C circle shows our long stretch of below-freezing average daily temperatures, and the recent shift to above-freezing days.


Snow
If you are curious about snow we already looked at that in exhaustive detail in:
The gist of that was that we had a fairly unremarkable year in terms of snowfall: most months were pretty average, with February & March a little bit high, and now April fairly low at 5.5cm. So far the total snow of 125.6cm for the winter of 2019-2020 is basically a perfect match for our yearly average.


Snowdepth
If snowfall this winter was sortof boring, the snowdepth was a bit more interesting...if only because it lasted so very long.

Blatchford's last day with snow on the ground was April 15th, and at the International it was April 21st. Since records began in 1955, only 4 years had melts later than April 21st: April 25th 2013, April 22nd 1974, April 24th 1967 & April 23rd 1965.

And we talked about all of that, and took a look at some of the other Canadian cities in the big Winter-in-Review.


Precipitation
We haven't looked at this chart for Total Precipitation (Rain + Snow) in forever, but both Blatchford and the International were well below April's average of 29.5mm.

For 2020 so far the International's 77.2mm of Precipitation is close to the average, while Blatchford's 55.5mm is a little low. But mid-May is when our monsoon season usually starts and the rain really ramps up.


May Temperatures
Looking ahead to next month, May has not had a High below freezing since 1959. But last month I said that April hadn't hit -20°C since 1982, so who knows how things will go? About one third of the time we will have a few days that stay below 5°C. 

On the other side of things we should probably see a week or two of days above 20°C. And May 2015, 2016 & 2017 all had almost a week of 25°C days, while 2018 had almost 2 weeks. And we have hit 30°C in for 4 May's in-a-row, from 2016-2019.

For Low temperatures, about a quarter of the time our final frost will be in April, and so May will have no Lows below 0°C. More typically though, May will have a handful of frosty nights.

And no one want to hear this, but the International records snow about half of the time in May. Recently May 2016, 2017 & 2018 were snowless, but 2014, 2015 & 2019 all had sizeable snowfalls.