2021/01/20

The Wind of January 19, 2021

 Environment Canada issued a rare "Snow Squall" warning on January 19th, and it didn't disappoint.

How windy did it get?

This dashboard is a little cramped, but each little circle here is a gusty day at Blatchford and the International Airport. For January 19th Blatchford's maximum wind gusts were 87km/h, while the airport hit 107km/h. Both stations have had gustier days, but this was certainly in the upper range.

History of Gusty Days
Here we have the chronological history of all of the days with wind guts of at least 87km/h, and at the bottom is the wind timeline for January 19th.

In "recent" years Blatchford crossed the 100km/h mark, with gusts up to 102km/h on July 20, 2015. And the International hit 111km/h on August 15, 2015, and 106km/h on January 15, 2014.

The gustiest days at Blatchford hit 117km/h on June 6, 1960 and September 11, 1973. For the International it was 146km/h on October 1, 1965.

Environment Canada measures windspeeds each hour, and peak wind gusts each day. For January 19, 2021 the hourly windspeeds were around 15km/h for most of the day, but they picked up at around 7pm and spiked at 8pm. The International's highest hourly windspeed hit 63km/h at 8pm, while Blatchford reached 39km/h. It's very typical for the hourly windspeeds to be much lower than the peak wind gusts.


Looking Back to 2020
Here is a quick look back at 2020. 

In 2020 the airport had a lot of "windy" days, with 78 days with gusts of at least 50km/h. The windiest day was October 30th, with the airport gusting to 84km/h and Blatchford at 50km/h. And the International's highest hourly windspeed was 61km/h, with Blatchford only at 30km/h.


January 2021
And finally, here is a quick look at the winds for January 2021.

Compared to history, January 2021 hasn't been particularly windy. Aside from January 19th, the 13th also got a little windy with gusts up to 72km/h at the International and 55km/h at Blatchford.

For some reason, most of Edmonton's windiest months occured long, long ago in the 1960s and 1970s/ We talked about that in Wind in Edmonton Part 6: Windy Months

2021/01/17

The Warm Start to the Winter of 2020-2021

On January 16th we crossed a milestone: the average High from December 1, 2020 through January 16, 2021 was 1°C. That made this the warmest December 1 through January 16 on record, going back to 1880.

The warmest December 1 through January 15th is held by the winter of 2011-2012, but its temperatures dropped in mid-January which let 2020-2021 take over the top spot starting on the 16th.


Here's the horserace of how 2020-2021 took over the top spot. If you are viewing this in the future the chart will show where the temperatures for January ended up, but as of January 16th the Highest wre the warmest and the Lows were in the #3 spot. 

The "X°C above the 20th century average" in these charts is a little hard to explain, because it's annualized over an entire year, even though here we are only talking about 1.5 months of data. Possibly the easiest way to explain it is that in 2020, the temperatures for the entire calendar year added up to 1°C warmer than the 20th century average. And now just for December 2020 + January 2021 the temperatures have also added up to 1°C, but this only took two months.


There's still plenty of winter left for the winter of 2020-2021.

Going back to November through mid-January the Highs ranks as the 9th warmest, with the Lows as the 8th warmest. But if you happen to be looking at this chart in March then you will be able to see the whole history of the winter.

2021/01/08

The Bottom of Winter: 2020-2021

It feels strange to say this given the mild winter so far, but...we've made it. January 9th and 10th is when Edmonton's average temperatures bottom-out for the year.


Average Highs

Using the 30-year averages our Highs are at their coldest on January 9th, with a average High of -8.6°C. After that the average starts climbing again, although not particularly quickly. By January 18th the average is above -5°C, but then it hangs out there for a month-and-a-half. It doesn't start to really shoot up towards spring until the first week of March.

That is all just the average, though. The blue range in this chart shows the coldest single days from the last 30-years, and the coldest January 9th had a High of "only" -24.6°C. Meanwhile, December 29th and January 19th both got all of the way down to -30.9°C (in 1992 and 1996, respectively).


Average Lows

The 30-year average Low is at its lowest on January 10th, at -17.8°C. By January 15th that will be up above -15°C again, but it will hang out there and doesn't rise above -10°C until March 10. So we still have aways to go.

In the past 30 years our two coldest Lows were last winter at -37.6°C on January 15 2020, and -37.8°C on January 19th 1996.


Cold Days During the Winter

This charts shows when during the year we get Lows of -20°C. Each tiny little dot is a Low which hit -20°C, and the shaded area in the background is our whole history back to the 1880s, while the purples & blues are just for 1990-today.

Since the 1980's we've averaged around 23 Lows at -20°C, but going back a few decades that number was closer to 35-45. Historically the peak of our -20°C season was late~ish January, but more recently January 10-12th have had the most.

That doesn't mean that we we are all done with -20°C Lows for the rest of the winter - we will almost certainly get some more. But from November through January 10-12th the likelihood that we will hit -20°C is going up, but from here to April those -20°C Lows become less likely.


Here is the same chart, except that this time it has our -25°C Lows. Since 2000 we've averaged about 9 of those each winter, and that's down from 20-25 a century ago.

Historically our -25°C Lows peaked in late-January, but more recently it has been around January 10th again.


Warm Days During the Winter

Here we have the flip side, with all of the Highs that hit 0°C. Historically those bottomed-out around New Year's, and that's also been the case recently. The likelihood of 0°C Highs slooooowly climbs over the next month-and-a-half, and takes off once we hit March.


And here are our 5°C Highs. They also bottom-out around New Year's, and then do a slow climb until March.


Recent Winters


Finally, here is a quick look at the Lows for recent winters going back to 2015-2016. We have made it to the bottom of the winter of 2020-2021, and things have been very mild. But there is still plenty of time left for this winter to make its presence felt.

2021/01/03

2020 in Review - Part 4 - Snow

At long last we reach the end of our 2020 Year-in-Review with Part 4: Snow. In Part 1 we looked at Edmonton's temperatures, Part 2 looked at temperatures in cities across Canada, and Part 3 was about Precipitation.

A caveat for today is that the Blatchford weather station in central Edmonton does not record snowfall anymore. Many of the charts today will include Blatchford's snowfall history for 1880-2007, but the 2020 numbers are from the International Airport. Blatchford does still record the depth of snow on the ground, and so 2020 snowdepth data will include both Blatchford and the International.

Also, snowdepth data can be a little odd. There doesn't seem to be anything glaringly wrong with the 2020 numbers, but generally snowdepth is the Environment Canada measurement with the most wiggle-room. 


Snowy Months

The charts today are usually used to show the snowfall during each winter, from roughly September to the following May. Today we are talking about calendar years though, and so the charts will look a little strange with the end of one winter, a gap for the summer, and then the start of the next winter.

Most of our main winter months of November-April average around 18cm of snow. January's average is on the higher end at 22cm, and February is lower at 15cm. For the shoulder season October averages 9cm and May averages 5cm. While we do get snow in September and very occasionally in June, those months are pretty hit-or-miss.

So for the main winter months of 2020 January, February, March & November were all above average in the 23-31cm range. April was low at 5.4cm, and December's 3.4cm was a bottom-5 for the International. The shoulder-season months of May and October were both below average, and there was no snow in September.


Total Snow

This chart looks very strange for calendar years, but what it shows is that for January-May we had a total of 84cm of snow. Then there's a plateau for the summer until things picked up again in October. From October-December we received another 39cm, and that pushed the total for 2020 up to 123.7cm.

On average we get 125cm of snow each calendar year, and so 2020 was right on the average.


Snow Across Canada

This chart is pretty messy, but it shows the total snowfall for 9 cities across Canada. To clean things up a bit you can turn off cities from the dropdown on the upper left, but having them altogether is good for context.

The totals:

  • St. John's averages 343cm and got 370cm in 2020
  • Ottawa averages 223cm and got 173cm
  • Montréal averages 203cm and got 168cm
  • Calgary averages 140cm and got 162cm
  • Toronto averages 118cm and got 140cm
  • Winnipeg averages 119cm and got 137cm (there is some missing data there, though)
  • Edmonton averages 125cm and got 124cm
  • Vancouver averages 31cm and got 45cm

Just as a fun comparison, here are the 2020 monthly snowfalls for St. John's compared to Edmonton's 30-year range:


Last & First Snowfalls

Edmonton's final snowfall of the spring of 2020 was May 4th, which is a week later than the average of April 26th. The first snowfall of fall was on October 16, which is a pretty typical first snowfall looking back over the long-term. It was quite late compared to recent years though, because recently 2014, 2016, 2017 & 2018 all had really early September snowfalls.


This chart has the spring and fall snowfalls for the Canadian cities. To keep it clear only Edmonton, Vancouver & Montréal are shown, but the other cities can be selected from the dropdown on the upper right.

The averages for the cities are interesting, with Edmonton's final spring snowfall typically coming 2 weeks after Montréal's, and the first fall snowfall possibly a month before Montréal's. Vancouver isn't a fair comparison for any other city, but when it gets snow it might happen between December & February.


We are going to talk about Snowdepth next, and to do that we will break 2020 in two: the spring melt, and the return of snow in the fall.

The Spring Melt

Spring came late in 2020. For January & February the snow on the ground was a bit above average, but by the end of March the snowdepth at the Airport was the highest that it had been in 30 years. The big melt didn't really start at either Edmonton station until around the 2nd week of April, and Blatchford hit 0cm of snow on April 16, with the International following a week later.

And how did things look across the country?

This is another messy chart where turning off some of the cities makes things easier to see.

Everything here is dwarfed by St. John's which had a massive storm in January which pushed its snowdepth up over 120cm for a few days. Ottawa and Montréal saw spikes in early February, but had mostly melted-off by mid-March. Winnipeg was down to 0cm by the first week of April, and St. John's and Edmonton both took an extra week.


Fall Snowdepth

For fall snowdepth both Edmonton stations took off in the first week of November, and were above average for most of the month. The warm weather in December cut the snowdepth at the International in half, but Blatchford stayed fairly flat at around 15cm. 


In the fall the snowdepth data is pretty spotty, because nowhere except Edmonton has any snow. That makes this chart difficult to read, but what we have is:

  • a blue line for Edmonton's fairly constant snowdepth through November & December.
  • a bouncing orange line for Calgary which had several big storms, which quickly melted away.
  • a brown line for Winnipeg which wasn't showing much show until the last week of December.
  • one cyan spike for a storm in Ottawa

The main takeaway from this chart is that Edmonton was the only one of these 9 stations to have sustained snowdepth through November & December 2020.

Snowdepth Through the Years

For one final look at snowdepth here we have a comparison of recent years in Edmonton, Calgary, Winnipeg, Ottawa & Montréal. St. John's isn't shown because it dwarfs everything, but it can be selected from the dropdown on the upper-right.

  • 2020 was a low-snow year for Ottawa, but it will often have a big spike up to 50cm or more in snowdepth in January or February.
  • Montréal also sees February spikes, but usually not above about 30cm of snow on the ground.
  • Winnipeg's snowdepth usually peaks between 20~30cm, and hangs out there for a few months. But in spring it disappears a week or two before Edmonton, and in the fall it shows up several weeks after.
  • Calgary has lots of early spikes, but also lots of melts.
  • Edmonton usually gets started in mid-November and hangs on through the end of March.


2020 Snowstorms

This chart shows all of Edmonton's 10cm+ storms that occurred over 2 days. Why 2 days? Often a storm rolls in at night and continues through the next morning, so 2-day-totals are probably a better representation of the big storms. This chart is organized by winter rather than by calendar year though, so to talk about 2020 we need to use a bit of imagination.

In 2020 Edmonton had two storms which crossed the 10cm mark: 10.5cm on January 22nd, and 15.6cm on November 7th. In a given winter we average about 3 10cm storms, and about 6 5cm storms.


2020 Snowstorms Across Canada

And here we have one final messy chart with big storms for Calgary, Ottawa, Montréal & St. John's. The Edmonton chart was showing 10cm+ storms, but here we have moved up to the big leagues with 25cm+ over 2 days.

  • Calgary had 1 25cm+ storm on December 12th at 27.2cm
  • Ottawa had 1 on February 7th at 26cm
  • Montréal had 1 also on February 7th at 35cm
  • St. John's had 2, on January 6th at 43cm and then on January 18th at 78cm(!)

Finally, for some context here is how often throughout history Edmonton, Calgary, Ottawa, Montréal and St. John's have had 25cm+ 2-day storms:

And that brings us to the end of our look at snow in 2020, and to the end of our 2020 Year-in-Review.

2021/01/02

2020 in Review - Part 3 - Precipitation

In Part 1 of our 2020 Year-in-Review we looked at Edmonton's temperatures, and Part 2 looked at temperatures in cities across Canada. Part 3 will be about 2020's Precipitation, and the focus will be on Edmonton, but we will bring in Canadian data for some extra context. We will end things of with Snow in Part 4.


Precipitation Each Month

Looking back at the months of 2020, things were around average for January-March, but then April was bottom-5 driest April at both Blatchford and the Airport. That flipped in May with both stations well above average, and that continued through August. September & October were both below average, November was above, and finally December was another bottom-5 for both stations.

For May, June & July Blatchford recorded 320mm, which was its 5th rainiest May-July since 1880, and the rainiest since 1953. The International recorded 311mm which was its 2nd rainiest since 1961.


Total Precipitation

For 2020 as a whole Blatchford and the International both ended-up above average. Each year we get about 440mm of combined precipitation (rain + snow) and Blatchford recorded 498.7mm with the International at 513.3mm.

How does that compare to other cities?


Precipitation Across Canada

Edmonton's 500mm~ish of yearly precipitation is definitely on the low end of things compared to other Canadian cities. In 2020 St. John's was up over 1,500mm, Vancouver & Montréal were over 1,000mm, and Ottawa & Toronto were above 750mm. And those numbers were fairly typical for all of those cities.

Winnipeg and Regina were both below 300mm. Winnipeg's 272mm is its lowest ever recorded, and Regina's 203mm is a bottom-10. Apparently 2020 was actually dry, but also Environment Canada's automated stations for those cities 

Calgary's 554mm ranked as its #14, and was the most precipitation it has had since 1965. Its May & December were very High, and June was also well above average:


Edmonton's Monsoon Season

Edmonton gets most of its yearly precipitation in big storms during May through August.

This chart doesn't work exactly the way that I would like it to, but each spike represents going back 20 years. There is some data missing from 2007~2015 which makes the winters look extra-dry, but the general pattern is always the same.


In comparison to Edmonton, in Montréal and St. John's the precipitation is much more evenly spread throughout the year. And famously-rainy Vancouver is the reverse of Edmonton, with a very busy winter but a very quiet May-August.


Big Storms in Edmonton

"Big" storms is relative, but in 2020 Blatchford had 4 days with Precipitation of 25mm or more. The biggest was May 21st at 35.8mm. If you switch the chart of the International there were 3 25mm storms, with May 21st the biggest again at 39.4mm.


Big Storms Across Canada


In this chart we have a comparison of the 25mm+ storms across the country. A link to the dashboard is here.

  • St. John's was the big winner with 14 25mm+ storms, the biggest of which was 58mm on July 15th.
  • Montréal had 8, and the biggest was 43.4mm on January 11th.
  • Vancouver had 7, with the two biggest just under 35mm in January and November.
  • Calgary had 5, including 54mm on June 13th
  • Toronto had 3, including 59mm on January 11th.
  • Ottawa had 4, including 52.1mm on June 5th.
  • Regina & Winnipeg did not record any 25mm+ storms in 2020 (possibly because of measurement error) so they are not included here. 

And that brings us to the end of Part 3, and our look at 2020's Precipitation. Calgary was quite high, and Edmonton was a little high, while Winnipeg & Regina were very low, and everywhere else was pretty typical. 

In Part 4 we will end our 2020 Year-in-Review with a look at Snow.

2021/01/01

2020 in Review - Part 2 - Temperatures Across Canada

In Part 1 of our 2020 review we took a detailed look at temperatures in Edmonton. In Part 2 we will be expanding that out to 8 other major cities across the country. Part 3 will be about 2020's Precipitation, and Part 4 will be Snow.


2020 Across Canada

In this chart each year since 2000 appears as a bubble. Orange bubbles were warmer than the 20th century average for the city, and blue bubbles were colder. The size of the bubble represents how warm or cold it was, and if you hover over them you will get a bit more information. These are calculated using the Mean temperatures (the average of the daily Highs and Lows), but with the dropdown on the lower right you can switch to look at the Highs or the Lows.

In 2020 all of the cities that we look at were warmer than their 20th century averages, with Edmonton at the cooler end of things:

  • Vancouver 0.7°C warmer than the 20th century average
  • Edmonton 1°C, Calgary 1.2°C, Regina 1.2°C, Winnipeg 1.1°C
  • Toronto 1.1°C, Ottawa 1.4°C, Montréal 1.9°C
  • St. John's 0.9°C

Something to notice here is that almost all of the bubbles in this chart are orange. This covers 21 years and 9 cities, and so there are a total of 189 bubbles here, and only 24 of them are blue. Since 2000 Winnipeg & Regina have each recorded 6 below-average years, Ottawa & St. John's have had 3, Toronto & Calgary 2, Montréal & Vancouver 1, and Edmonton none.

That is quite a change from how things used to be:

This chart has the yearly temperature bubbles for 20-year time periods, from 1880-1899 through 2000-2020.

2000-2020's 21 years had 24 blue bubbles across the country. 1980-1999 had 52, and 1960-1979 had 100. Way back in 1880-1899 there were 114 below-average years versus 29 above-average (some of the cities are missing data for those years, so the total number of bubbles is lower).

There have always been some years which were warm and others which were cold, but in the past 20~40 years the cold years have mostly disappeared for Canada's cities.


1841+

Here are all of the years of records together in context. 2020 was not a particularly warm year in Edmonton, with temperatures "only" 1°C warmer than the 20th century average. 

Vancouver was below that at 0.7°C, however Vancouver has a much more moderate (or less extreme) climate than Edmonton because of the ocean. So 0.7°C warmer than the 20th Century average in Vancouver ranks as #26 warmest, while 1°C warmer in Edmonton is #28.

So across the country 2020 ranged from #28 warmest in Edmonton, all the way up to #5 warmest for Montréal. So for all of the cities here 2020 was at least a top-30 year, and for Ottawa, St. John's, Toronto and Calgary it was a top-20.

The last time that all 9 of these cities had a top-30 year together was 2016, which was very warm: #3 warmest for Edmonton, Calgary & Regina, #4 for Winnipeg, #7 for Vancouver, #9 for Montréal...


Canadian Climate Stripes

This is another way of looking at that history all in one place, with the climate stripes for all of the cities. The prairie cities have been mostly in the reds since about 1980, while for the rest of the country it happened a little later around 2000.


2020 in Montréal

2020 was a top-5 warmest year in Montréal, and so we are going to take a closer look at what that means and where the number comes from.

This chart tracks how much warmer or colder each day of 2020 was compared to the 20th century average. Warm days get points and push the red line upward, and cold days drop the line down. It is split into Highs, and Lows because the Lows tend to have warmed up more than the Highs have. And then the average of Highs and Lows gives us the Mean, and the overall ranking of...

In Edmonton most of our warming comes from the Low temperatures. In 2020 Edmonton's Mean temperatures was 1°C warmer than the 20th Century average, but that comes from the Lows which were 1.42°C warmer and the Highs which were only 0.49°C warmer. And that pattern is typical, going back years.

Montréal is the opposite, with more of its warming coming from the Highs. In 2020 the Highs were 2.08°C above the 20th century average, while the Lows were only 1.79°C, which gives the 1.9°C total. And warming Highs are pretty typical for Montréal, happening in 2020, 2019, 2018, 2016, 2015...with 2017 as a rare year where the Lows had warmed more than the Highs.

Getting back to 2020, if we follow the red line along we can see that it climbs from January through April, and then takes a little bit of a dip. It then climbs again through September, and takes another little dip. And then it climbs through the end of the year.


Montréal's 2020 Highs

Here are what Montréal's daily High temperatures actually looked like. (just a note that the average line in this chart is the 30-year average, while the other charts today use that 20th century average as their baseline. Sorry about any confusion. This chart is more about the current picture rather than long-term trends)

This chart is a little cramped in this format, but in January-April we see a lot of red, with the temperatures only rarely dipping below 30-year average into the blues. April & May were cold, but then in late-May through July there were a bunch of new records. August, September & October all had a mix of above & below average days. And then there were a few more new records in November and December.

Montréal finished 2020 with 215 Highs above the 30-year average, and 151 below. That included 8 new records for warmest-High, and 1 for coldest-High. So even in a top-10 warmest year there are going to be some cold days.


Warm & Cold Months Across Canada

Here we have the monthly bubbles for all of the cities. Sticking with Montréal we see that January-March were warm, April-May were cool~ish, June-August were warm, September & October were cool, and November & December were warm.

On a month-by-month basis:

  • January was above-average across the country, but it was least-above average in Edmonton & Calgary.
  • Things flipped for February, with Edmonton, Calgary and Regina well above average, while the rest of the country was just a bit above average.
  • Edmonton & Calgary got an extra-cool March, while on the coasts Vancouver and St. John's were a little cool, and the rest of warm.
  • April was cool from coast-to-coast, and especially in Edmonton & Regina.
  • May was pretty middling, with Vancouver a little warm and Toronto a little cold.
  • June was pretty warm from Winnipeg through St. John's.
  • July was really warm in Ontario & Quebec, meh in the west, and cold in St. John's.
  • In August things flipped, with Edmonton, Calgary & St. John's the most above average.
  • That continued into September, with Edmonton, Calgary, St. John's & Vancouver warm, and Winnipeg through Montréal cool.
  • October was really cold on the prairies, meh in central Canada, and warm in St. John.s
  • November was pretty warm everywhere except Edmonton.
  • And finally, December was warm across the country, and especially across the prairies.
With all of that, that is how each of these Canadian cities ended up with a 2020 that was warmer than their 20th century average temperatures. 


And that brings us to the end of Part 2 of our look back at 2020. In Part 1 we looked at Edmonton's Temperatures. Part 3 will be about Precipitation, and Part 4 will be Snow.

2020 in Review - Part 1 - Edmonton Temperatures

Today we are taking a look back to see how Edmonton's 2020 temperatures compared to other years. In Part 2 we will expand that to cities across Canada. Part 3 will be about 2020's Precipitation, and we will close things out in Part 4 with a look at snow.


Warmest & Coldest Years

We'll get the big news out of the way: Edmonton's average temperature for 2020 was the 28th warmest overall, at 1°C warmer than the 20th Century average. That's warmer than 2019 (#56) and 2018 (#36), but below 2017 (#15), 2016 (#3) and 2015 (#4)

9 months were warmer than their 20th Century averages, including December at 6°C warmer than average and February at 4.3°C. The 3 cooler months were March, April & October, with October -2.5°C cooler than its average.


For the Climate Stripes chart that makes 2020 a light pink. It is darker than 2019 at 0.4°C, but much lighter than 2016 at 2.9°C

The last time that we had a blue stripe was back in 1996, at -1.7°C colder than the 20th century average.


The Horserace

This chart shows where the "28th warmest year" calculation comes from. 

It tracks how much warmer or colder each day of 2020 was compared to the 20th century average. Warm days get points and push the red line upward, and cold days drop the line down. It is split into Highs, and Lows because the Lows tend to have warmed up more than the Highs have. And then the average of Highs & Lows gives us the Mean.

Following the line for the Highs:

  • in January it climbed and then dropped
  • it climbed in February and into March
  • it dropped in late-March and into April
  • it was basically flat for May all the way through September
  • in October it climbed a bit, and then dropped a bit again
  • it climbed through most of December.

The Lows look pretty similar, except that they slowly a bit during the summer.

So at the end of the year the Highs ended up at 0.49°C warmer than the 20th Century average, for our 49th warmest Highs. And meanwhile the Lows were 1.42°C warmer for 24th warmest Lows. The average of the two gives us 2020's total of 0.96°C above the 20th century average, and 28th spot.


Warm & Cold Months

In this chart each month since 2000 appears as a bubble. Orange bubbles were warmer than the 20th century average, and blue bubbles were colder. The size of the bubble represents how warm or cold it was, and if you hover over them you will get a bit more information. Here we are back to using the Mean temperatures, but with the dropdown on the lower right you can switch to look at the Highs or the Lows.

2020 was 1°C warmer than the 20th century average, and the bubbles here give us a way to compare the various months:
  • January was warmer than the 20th century average, but most recent Januarys have been "warm." 2020 was actually the coldest January that we had had since 2004.
  • February was fairly warm, and was very different from the giant blue bubble for the very cold February of 2019.
  • March & April were both below average. But a cold March & April together happens fairly frequently: 2018, 2017, 2014, 2013, 2011... 
  • May through September were all warmer than the 20th century average, but not by much. And if you switch this chart to show the Highs, May through July were all basically right on the 20th century average, so it was the Lows which made up the difference.
  • October was quite cold, and the last time that we had a "warm" October was 2015.
  • November was right on the 20th century average.
  • December was quite warm, although not quite as warm as 2011.


High Temperatures

This chart is a little cramped, but it has the daily High temperature rollercoaster for the whole year. During the year our temperatures don't spend much time right around the average, and instead bounce back and forth between warm days and cold days.

In particular here we can see the coldsnaps that we had in mid-January, early-April and late-October with the temperatures right down at the bottom of the 30-year range. Overall there were 197 days above the 30-year average and 168 below.


For "warm" days 2020 ended up with 100 days which hit 20°C. That was up from the 82 we had in 2019, but down just a bit from warm years like 2015-2018.

For warmer days, 2020 had 23 Highs which hit 25°C, and that's down from the average of about 40. And 2020 had 2 days hit 30°C, when we average around 6 or 7.


Low Temperatures

And here are the daily Low temperatures for 2020.

The coldsnaps in January, February, March, April and October all stand out. And those included two notable days:

  • On January 15, 2020 we hit -37.6°C. That was the first time that Blatchford had broken -35°C since December 13, 2009, and the first -37°C since January 19, 1996. The last time that Blatchford hit -38°C was also the last time that it hit -40°C, back in January 1972.
  • On April 2nd the Low was -20.8°C. That was the first time we had hit -20°C in April since April 3, 1982.


Looking at the cold days, 2020 had 19 days with Lows which hit -20°C, which is close to the average. That included 9 Lows which hit -25°C, which is also right on the average. And each year we average about 2 Lows at -30°C, and 2020 recorded 4 including the ridiculous -37.6°C.
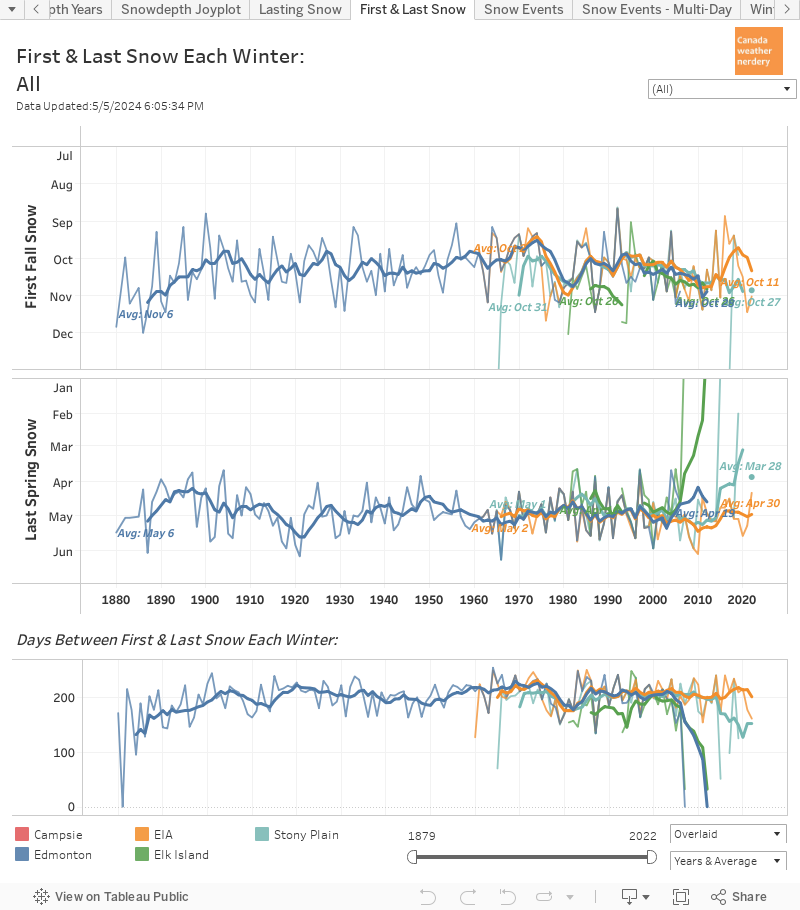
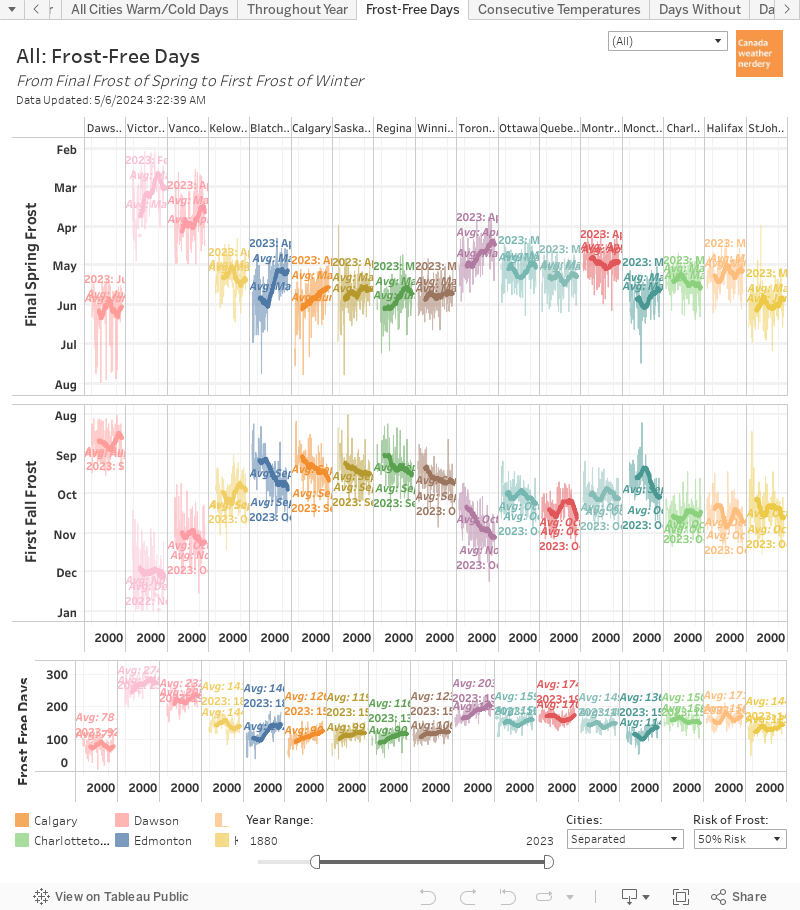

Frost-Free Days

Edmonton's final frost of the spring of 2020 was quite early, on April 19th. The average is around May 6th. The first frost of fall was also a little late on October 9th, compared to an average of around September 25th.

The early final spring frost and late first fall frost meant that 2020 had 173 frost-free days, which is about a month longer than the average of 142. In recent years 2011 had 174 frost-free days, and 1980 was the longest with 185.


Edmonton versus Calgary

And finally, just for fun here is a comparison of the daily temperatures in Edmonton & Calgary for 2020. Generally the two cities move together, although sometimes some big gaps open up.

The largest difference was on January 19th with Edmonton's High at -16.5°C, while Calgary was 21.4°C warmer at 4.9°C. That was that was the start of a warming trend that reached Calgary first, and Edmonton was above freezing by the 21st. The largest difference in Lows was in that same gap on January 20th with Edmonton at -17.6°C and Calgary 13.5°C warmer at -4.1°C.

In the charts there's a thin line (it's a little tough to see) which shows the average difference each week. During the winter Calgary's Highs average about 4~5°C warmer than Edmonton's, while the Lows are a little bit closer at 2~3°C warmer. In the summer Edmonton's Lows are usually 1~2°C warmer that Calgary's, while the Highs are a bit of a mix.


With that we have reached the end of Part 1 of our review of 2020. In Part 2 we will look at temperatures in some of the major cities across Canada. Part 3 will be about a Precipitation. And we will end things off in Part 4 with a look at snow.