It's time to take a look back at Edmonton weather for August, 2021.
We're going to keep things relatively short today and mostly stick to August, but after labour day we will be back with a full recap of the summer of 2021.
(if you are reading this in the distant future some of the dashboards below may have updated to reflect new data or formatting, or they may be broken, or they may no longer make sense. To see the original images for this post refer to this twitter thread.)
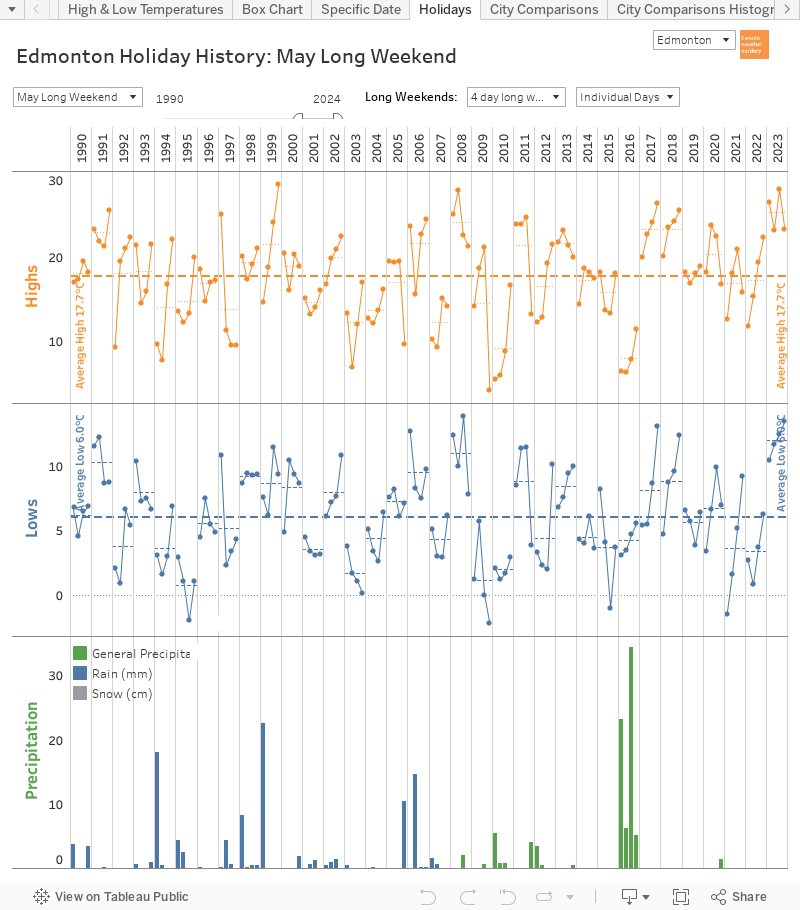
High Temperatures
August 2021 was pretty hot to start, broke some records mid-month, got a little cool for a few days, and was mostly around average at the end.
Overall 10 days were below average and 21 were above, which included 2 new records on the 13th and 14th.
We don't always hit 30°C in August, but 2021 had 4 of them.
August averages 10 25°C days, and 2021 had 11.
We also had 1 August High below 10°C (9.8°C on the 23rd), which hadn't happened since 2005.
Hot Days
August had 4 days reach 30°C, and that pushed the total for 2021 total to 17. That broke the old record of 14 from 1961.
Getting more 30°C days after September 1st isn't impossible, but recently only 2009, 2011 and 2017 got that hot later in the year.
For 25°C Days 2021 has had 47, which ranks 12th overall.
1898 has the record with 64, and recently 2018 had 55.
After September 1st we average another ~5 25°C days. Years like 2019 and 2007 had none, while 2013 had 8 and 2009 had 11.
Low Temperatures
2021's August Lows were pretty close to the average, with 17 warmer than average and 14 colder. A few nights were close to the top of our typical range, but there were no records.
About half of the time August will have a Low below 5°C, but for 2021 the coldest was 6.5°C on the 24th.
And 2021 had 9 Lows above 15°C, when the average is 3. But recently 2014 had 10 of those.
Warm and Cold Months
Overall August 2021 was warm, but not record-breaking.
The average High of 23.9°C ranks as Blatchford's 27th warmest, and the average Low of 12°C is 15th.
1981 was the hottest August on record, with an average High of 26.8°C. 1998 had the warmest average Low at 13.5°C.
For the summer of 2021 June, July and August were all warmer than the 20th century average.
That's a change from the cool summers of 2020 and 2019.
But recently 2015-2018 were also warm summers, and those years also included warm Mays.
For June-August 2021 the average High was 24.9°C, which was the highest on record, beating 24.7°C in 1961. The average Low of 13.1°C was also a record, beating 12.5°C in 1998.
Going back a bit further the average High for May-August was 22.8°C was 8th warmest. The average Low of 11.3°C was 2nd warmest.
2019 and 2020 were both cool, but 5 of the past 7 years were in the top-12 warmest summers: 2015, 2016, 2017, 2018 and 2021.
Summer 2021 Across Canada
Looking across Canada August 2021 was hot in central Canada (after a cool July), and cooler in the west (after a Hot July).
That ranged from 3.7°C above the 20th century average in Montréal, to -0.4°C below for Regina
For June-August across the country the Highs temperatures made this a top-10 warmest summer in Vancouver, Edmonton, Calgary, Winnipeg, Toronto and Montréal, and top-15 in Regina and St. John's.
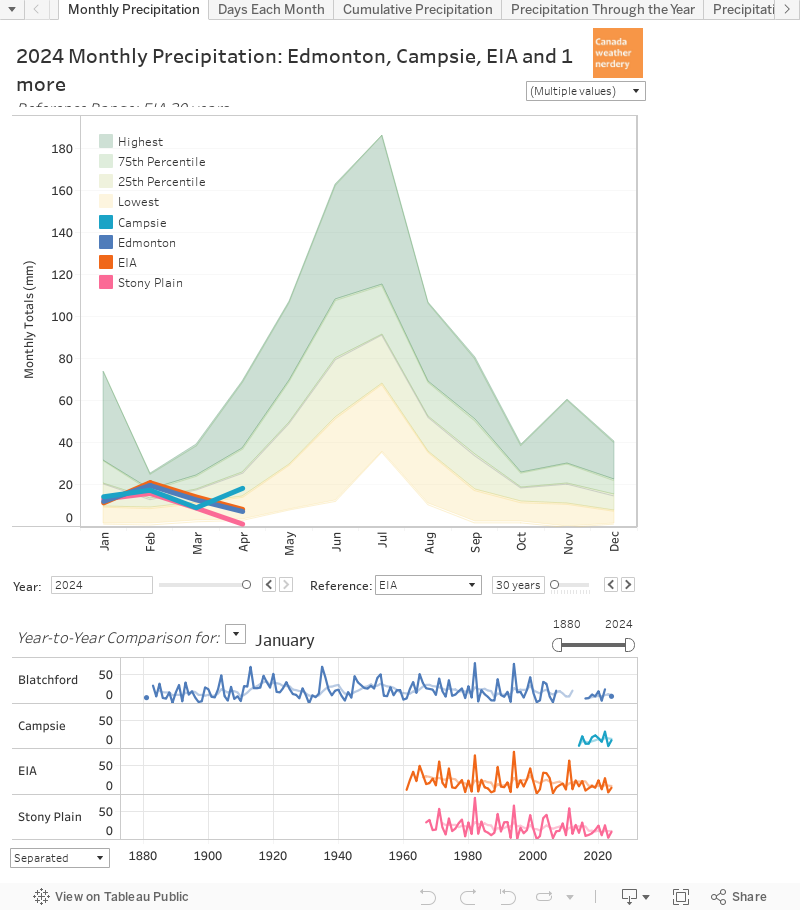
Precipitation
On average August gets around 52mm of rain.
In 2021 the International got 49.5mm, Stony Plain got 44.7mm, and Blatchford got 39mm. After an extremely dry June and July we were mostly average in August.
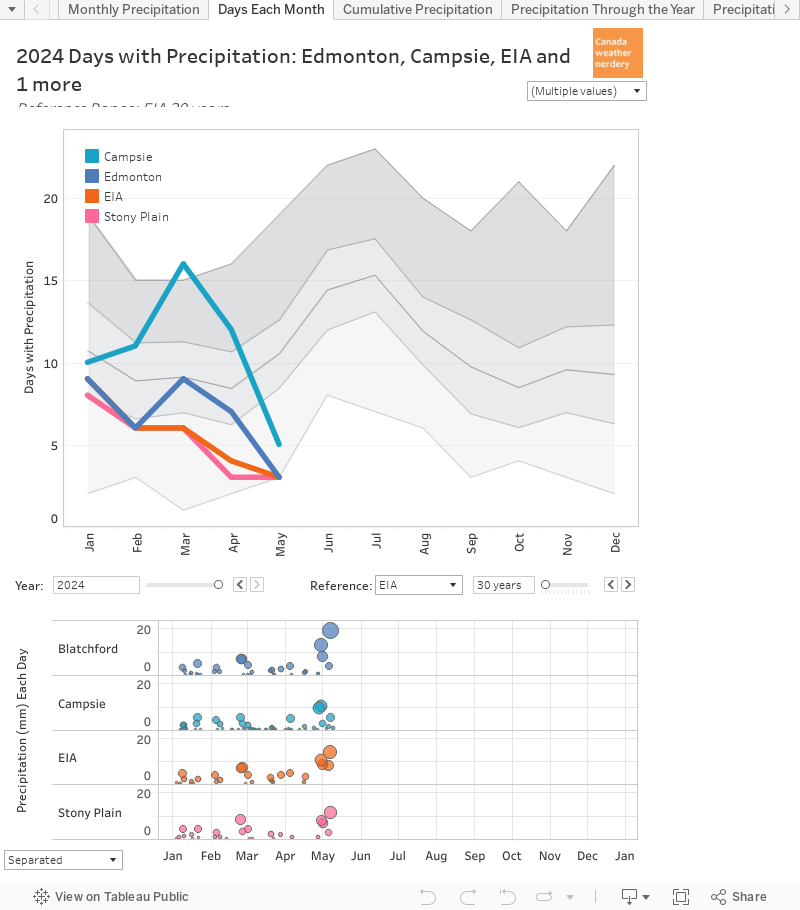
We didn't have a lot of rainy days, though.
August averages 12 days with measurable rain, and this year the International had 10, Stony Plain had 7 and Blatchford had 5.
For the year so far Blatchford's 169.3 is its 2nd lowest full year, after 1889 with 148mm.
Stony Plain's 183mm was its lowest since 1961. And the 262.6mm was a bottom-10 year for the International.
Looking across all of the surrounding stations the Airport is the outlier with its 262mm. St. Albert and New Sarepta are both around 220mm, and then rest are below 200mm.
Precipitation Across Canada
While August 2021 precipitation was average in Edmonton, Winnipeg and Calgary both had big months.
Winnipeg even had one 65.7mm storm on the 20th, which was more than Edmonton got in June and July combined.
Tis chart has precipitation for cities across Canada, and is a little messy.
Edmonton's Blatchford station is all alone down at the bottom with 169mm. Calgary, Regina and Winnipeg are all around 275mm, Vancouver and central Canada are around 475mm, and St. John's is up at 879mm.
September
For September Highs we still average 10 days at 20°C, including 3 at 25°C. And since 2000 only 6 Septembers had a High below 5°C.
For Lows, about half of the time September is frost-free but blue, below-freezing days start to creep in at the end of the month.