2016/06/30

Canada Day

Since I'll be doing a month-in-review right away, Canada Day starts one day early:

Canada Day in Edmonton is reliably pretty warm, although it's only broken 30°C once. That was way back in 1924, reaching an extremely warm 35.6°C. In the last 30 years the average high has been 22°C, and there were 7 times when it didn't reach 20°C - most recently 2010 and 2011 both topped out at 19°C. The average overnight low for the last 30 years is 12°C, and it hasn't dropped below 5°C since 1927.


For precipitation here are a combination of readings from Blatchford and the International. We can see that daily precipitation does vary depending on location, with a year like 1998 when Blatchford recorded 30mm of rain and the International recorded 0. Between the two stations it looks like about half of the time there is at least some rain on Canada Day.

2016/06/27

2016 Precipitation so far

In the last few weeks I've looked at Edmonton's entire recorded history of precipitation, and at when during the year we get that precipitation. Today will be one final look at precipitation, with a scorecard to see how 2016 is doing.

I've used this chart before, and like it quite a bit.


In the last 20 years 1996 was the high, 2002 was the low, and at this point in 2015 we were quite a bit behind where we are in 2016.

Here's the same basic data, but converted to my usual highs/lows/quartiles/average format.


As I've done previously, the grey band is the 25-75th percentile, the highest since 1995 is in green and the lowest is in yellow.

For most of 2016 we were below the 25th percentile and near the recent minimum. But the very rainy Victoria day weekend pushed us up above the average. Since then we've been roughly keeping pace with the average.

Here is the same chart, expanded for the entire year.


Depending how things go, at this point we're probably a bit below the halfway point for the year.

The calendar year-to-date is interesting, but since we are only in July there are 6 months missing. So here are the cumulative totals for the last 12 months, from July to July.


And after 12 months we are sitting right around the average. Although without the 100mm from the extremely raining Victoria Day weekend, we would be well below that.

Finally for today, here is the calendar-year cumulative precipitation graph from earlier, but redone to include the all-time maximum, as well as the average from the 1960s through the 1990s.


The all-time maximum of 745mm is from 1900, which we've previously seen was the record year.

And I've mentioned previously that since about 2000 our precipitation has been below what had been typical for the 4 decades before that. Our recent average is about 400mm/year, compared to 470mm for 1960-2000.

2016/06/24

2016 River Levels

Something a little bit different today.

3 years ago this week, while Calgary and southern Alberta were famously flooding, up in Edmonton the North Saskatchewan was having a bit of a mini-flood as well.

Here are a few pictures from June 23, 2013:


The speed of these things is amazing:


Over the 4 days from June 19, 2013 through June 23 the river rose from 4m to 9.4m - that's 5.4m or almost 18'. And the volume increased by 7x, from 400m3/s to 2,800m3/s.

2,800m3/s is 10,080,000,000 L/hr, which is a ridiculous number.

I was reminded of this while in the dogpark today, because the river levels are very low.
3 years ago this spot was under 23' of water
It's tough to really convey that in a picture, but it's only June and there are already islands poking up in the middle of the river around the High Level bridge.

Alberta Sustainable Resource Development has a website with data on all of the province's river basins. As of June 24, 2016 the North Saskatchewan in Edmonton is sitting at about 2.4m deep, with a flow of 110m3/s.

And here is a chart that is taken straight from their website:
Source: http://www.environment.alberta.ca/apps/basins/DisplayData.aspx?Type=Figure&BasinID=4&DataType=1&StationID=RNSASEDM


The dashed lines are the high & low quartiles that I often also like to use on my charts. And right now 2016 is well below the typical range of about 240-550m3/s.

2016/06/20

Edmonton's Monsoon Season

Last week I looked at Edmonton's recorded history of precipitation, and it was a bit messy because the data has some problems. Today, instead of looking at how much rain we get in a year, I'm going to look at when we actually get it. This should be a bit simpler.

Last week we saw that since about 2000 we have had below average precipitation. There have been some high years and some low years, but it has mostly been low years. The average for the last 15 years has only been 400mm per year, compared to 470mm for the 40 years before that.


Today I just want to look at recent history, so I'm going to be using data from the International Airport going back to 1995. I want to know what is typical today, rather than the theoretical "normal" that we haven't really seen in a generation. I'm also going to be using Environment Canada's "Total Precipitation" which is a combination of snow & rain, and that will keep things simple for now.

So to start off, when do we get precipitation?


This graph shows the days per month that we get precipitation. It is similar to what I've been doing for temperatures - with the average in white, a band for the 25th-75th percentile (where roughly 50% of the years will fall), and then the highest, second highest, lowest and second lowest since 1995. I've also added in the years of each of the monthly highs, for interest.

And here we see that July is the precipitation-iest month, with on average 15 days of rain, and a max of 23 days in 1996. June is second at 14 days, and February is the lowest with an average of 8 days. The maxes and mins and percentiles all follow the average pretty nicely too, with the exception of a pair of outlier maxima in October and December.

So that is the number of days with precipitation, but probably more important is the amounts that we actually get:


And again, July is the big winner with on average about 30% more precipitation than second-place June. And whether talking about the average, highs, lows, or quartiles, July basically doubles the May or August numbers.

This surprises me, because I tend to joke that May and June are Edmonton's "Monsoon Season". Throughout the year I spend a fair bit of time in the river valley - either on the bike trails or in the dog parks - and May and June are gloomy and slimy. But I guess that July must get a lot of evening thundershowers that dump a lot rain. And then the temperatures during the day are high enough to burn that off so that things don't seem soggy.

I'm also surprised by how July compares to the winter months. As I've said, this is the "total" precipitation, which means that snow is measured as its melted-water-equivalent. Comparing the height of fluffy snow to rain wouldn't really be fair, and so the way that Environment Canda does things 10mm of snow is equal to roughly 1mm of rain.

The average total precipitation for November through March is 87mm, compared to 93mm for the month of July alone. And in the last 20 years the most precipitation during a winter was 130mm, whereas the most rainy July was 186mm. For the 4 "summer" months of May-August we generally get 3x more precipitation than in the 5 "winter" months of November-March.

And as for 2016, after a few months of below average precipitation, in May we got drenched. With 107mm it was the rainiest May since 1977, which had 132mm.

Monthly data is pretty broad, so for a slightly more granular look at things, here is the data broken down by week:


There isn't anything unexpected in here, but we can see that the true monsoon season actually starts in the last few weeks of June, and carries on through July. And Edmonton is not really a city of April showers. And for November-March the average weekly precipitation is pretty consistent, dropping down a little around Christmas, and popping back up a bit near the end of January.

Also, the May long weekend this year was the second rainiest week going back to 1995.

Breaking the data down even further to a daily basis is tricky, because precipitation is so variable. But here is a chart that looks pretty, even if it is impossible to read:


It shows every precipitation event since 1995, and there is a nice ridge in the middle where that June-July monsoon season really stands out.

Finally for today, I've said that the Blatchford data isn't any use for recent comparisons. But there is more than a century of data which can be used for historic records. Here are two of the charts from today, redone to include the all-time highs from Blatchford:


For monthly precipitation, the all-time records are anywhere from 30% to 130% more than what we've seen recently. The closest we've come to a record was January of 2011, with 59mm versus 70mm in 1982. I remember that pretty clearly, because it was my second winter commuting on a bike, and it was the only time I've seen anything even close to this:

At the time I figured every winter was going to be like that, but thankfully that is not the case. 


For the weekly precipitation, 2016's extremely rainy Victoria day week with 88mm beat the previous record of 56mm from 1902. Although the records for the weeks on either side of it are 87mm (1939) and 96mm (1902 again), so it's not completely unprecedented.

Because this chart is a mix of data from Blatchford and from the International there are a few cases - like the last week of April, Victoria day, last week of June, and 2nd last week of July - where the International's recent maximum is actually higher than Blatchford's all-time record.

2016/06/17

136ish Years of Precipitation - Addendum

Just some housekeeping today.

In the comments last week, Joe mentioned that the reason the Blatchford data becomes unreliable in the mid-1990s might be because Environment Canada started using a different weather station at that time. And he's right, and a few months ago I even wrote a boring post about the different Blatchford stations, and the overlapping data that is available for some years.

From March 1995 through January 2005 both stations were in operation, and so there are two sets of data. When I had first looked at this I was mostly interested in temperature, so I compared that for the two stations:

And they were close, but in winter the newer station was often 0.5°C below the older one.

Today I'm interested in precipitation, so here is how the monthly numbers compare over time:


It's more variable than I would have thought. Since the new Blatchford station's yearly data was low, I just assumed that it was missing data for some days. But if things were that simple, then the older station would always have higher numbers, and the chart would always be positive. Instead, we see quite a few dips into the negative, and the older station has more precipitation only about two-thirds of the time. On the whole though, over those 10 years the older station recorded 200mm more precipitation than the new one.

Comparing the two Blatchford stations to the other local stations really makes things clear though:


This shows the two Blatchford stations, as well as the International, UofA and Stony Plain.

My concern last week was the huge dip in the Blatchford numbers from 1995-2000, and we can see that the alternate data from the older station is much more consistent with the other local stations. All of the stations saw significant drops in the 2000-2002 range, but the newer Blatchford stations is hundreds of mm's lower than all the others.

That's definitive enough to make me go back to redo some of the charts from last week, with the data from the older Blatchford station replacing the unreliable newer one.

Original - new Blatchford Station
Updated - older Blatchford Station

It's not a huge difference, but things don't fall off a cliff in 2000 the way they originally did. 2002 is still a dry year, but it rises from last place up to third last.

Original - new Blatchford Station

Updated - older Blatchford Station

And again, it's not a huge change. But it is nice to have a slightly cleaner version of this chart, and one that I can have a little bit more faith in.

Using this alternate data still doesn't change the fact that the Blatchford data is unreliable for 2007 onward, but at least now it looks pretty good for 1880 through about 2005. For any recent precipitation numbers I will still be relying on the Edmonton International.

2016/06/14

136ish Years of Precipitation

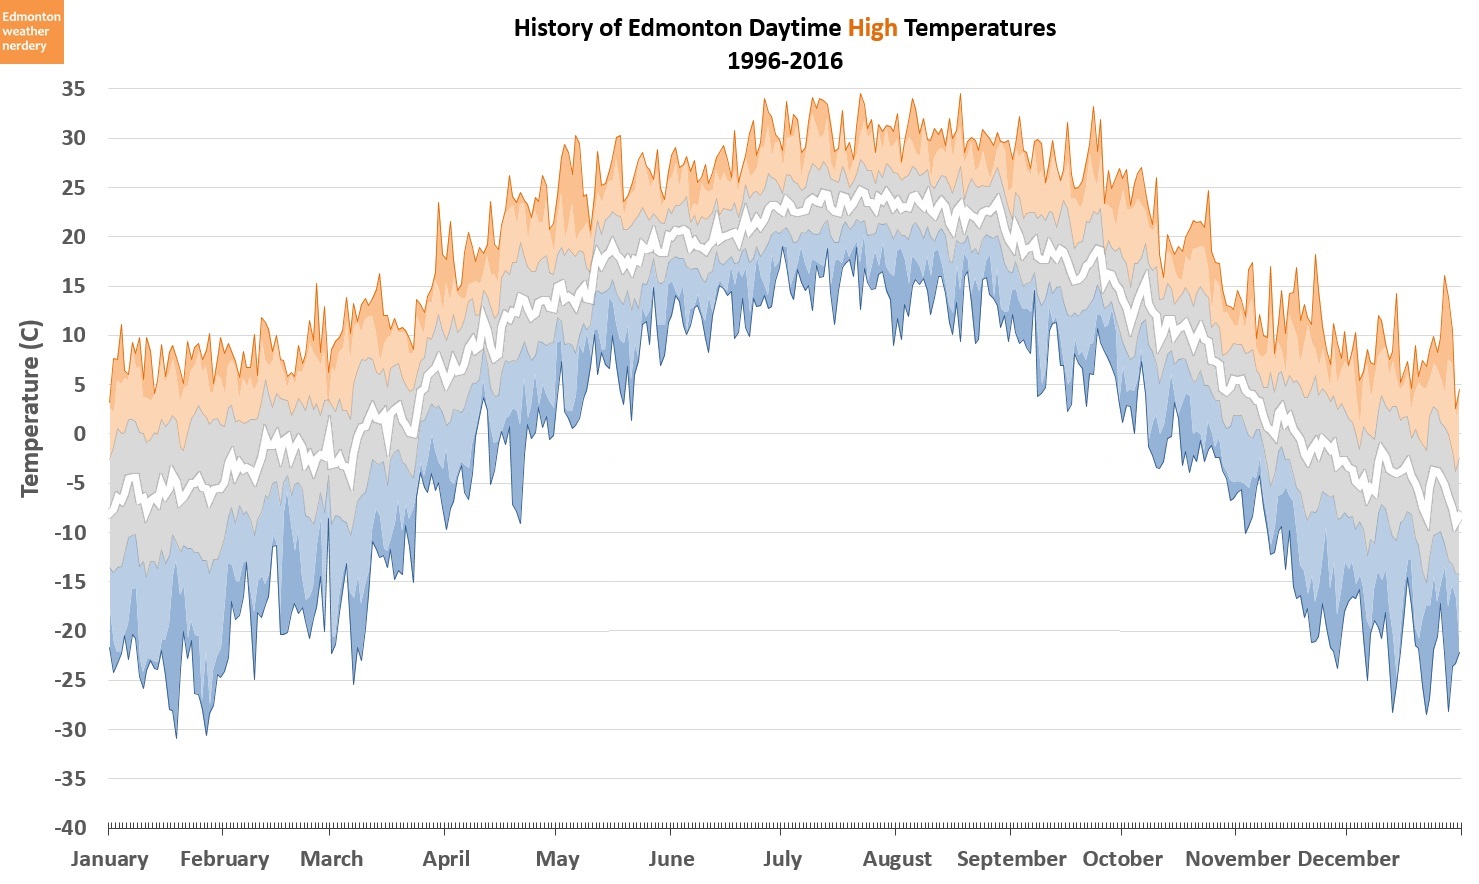
Last winter I looked at Edmonton's entire 136-Year recorded history of warm winter days, and cold winter days. Today I'm going to look at Edmonton's precipitation history, but it's a little trickier because of the data that is available. Rather than 136 years, it's more like 136-9+55 years worth of precipitation.

I've mentioned before that the precipitation data for the Edmonton Blatchford weather station isn't good, and here is the problem:


Environment Canada makes note of any days that have missing measurements, and from 1881 through 2006 things went pretty well. But in 2007 there were 31 days with missing precipitation data. In 2008 through 2013, each of those years had more than 200 days with missing measurements. And finally, in 2014 all 365 days are missing. Then 2015 dropped to a more reasonable 89, and so far in 2016 there has only been 1.

I'm not sure what caused this - why after more than a century of record keeping would you just take a little break? One might think that the closure of the airport had something to do with it, but the vote to close the airport wasn't until 2009, and the first runway closure was in 2010. The Edmonton Indy might seem to be another possible factor, but it started earlier in 2005 and lasted through to 2012.

So I don't know what caused the gaps in the data. I just know that they are there.

Those gaps mean that the Blatchford data can't be used for any current comparisons, or trends, or averages. But there is still more that a century of data to look at.

For the missing recent history the Edmonton International Airport is available as an alternative, although it only has data back to 1961:


This is a comparison of the Edmonton International and Blatchford, and the purple line along the bottom is the difference between the two stations each year.

From 1961 through 1995 the two stations were within +/-75mm of each other every year, which is about 20%. But then in 1995 the Blatchford numbers started to drop off, and in 2000 the difference between the two stations peaked at 218mm. Precipitation is much more local than temperatures, and it's possible that the International received a few big storms that the downtown didn't. But 451mm at the International vs 233mm at Blatchford is pretty huge (almost 50%, and over 3 standard deviations from the mean)

Knowing the problems with the 2007-2015 Blatchford data, this does make me wonder if maybe there are some unreported errors in the 1995-2000 era? But I'll come back to that in a bit. For now, lets just take a closer look at the Blatchford data:


I'd tried to add a trendline to the Blatchford data, but it wasn't very interesting, so it isn't shown. Things are low at the beginning, low at the end, and flat in the middle, so the trend for the century just looks flat.

So instead of a trendline here is the 5-Year moving average, which removes some of the year-to-year noisiness. And for almost a century - from about 1905 through 1995 - that average fluctuated back and forth in the range of 400-535mm per year.

I tend to think of the 1930's as a time of extreme drought, because of all of the photos of the dustbowl and the stories of the depression. But at least for Edmonton that is a little hard to spot in the data. 1929 was low, and 1930 was very low at just above 300mm (making it the 8th lowest year). But after 1930 the precipitation quickly recovered, even if the economy didn't. And the lows of the early 1930s are pretty comparable to the early 1920s, early 1950s and much of the 1960s.

The only times that the average broke out of the 400-535mm band were at the beginning and the end of the century. 1900 and 1901 both had about 60% more precipitation than the 20th century average. And then the late 1800s and early 2000s had some years that were as low as half the average.


Here is the Edmonton International data, with the same 400-535mm range shaded in. And we can see that for the most part the International stays within that band as well.

Unfortunately there isn't a lot of overlap in the highest and lowest years for the two stations, mostly because many of Blatchford's extremes were a century ago. But one thing that is common between the two charts is 2002, which had the lowest recorded precipitation for both Blatchford and for the International. Even though it is the lowest at both stations, there is still a significant difference in the measurements, with Blatchford at 188mm and the International at 267mm.

Last year a state of agricultural emergency was declared, because there had been so little precipitation. But based on the numbers for the International, 2015 still had 40% more precipitation than 2002. On the other hand though, looking at the 5-Year average we have now had a string of relatively dry years, and the last year with a lot of precipitation was all the way back in 1996. For about the last 15 years the average has been sitting at the bottom of that 400-535mm range.

And that brings us back to the Blatchford data. From 2000 onwards the precipitation at the International is fairly low, but at Blatchford it absolutely nosedived. Which one is right? Or are they both right? It's time to look at some other stations for comparison.


Edmonton has other stations with precipitation data, and two of them - the University of Alberta Metabolic Centre, and Stony Plain - are shown here.

This is a very busy chart, and I won't look at it in too much detail - Stony Plain tends to be a little higher than the other stations, taking top spot in 18 of the 31 years shown here; and all 4 stations show a downward trend since the mid-80s.

The main point of interest here is the years from about 1995-2002, where the Blatchford data is significantly lower than all three of the other stations. Precipitation is local, but I'm suspicious that Blatchford really only received half as much precipitation as the University did in 2000. So I already know that Blatchford's 2007-2015 data has problems, but I think that 1995-2002 looks pretty dubious as well.

I've previously said that I don't like the recent Blatchford precipitation data, and this confirms that. It's still interesting for some historic records, but in the future I'll continue to use the International whenever I'm looking at recent precipitation.

One final thing for today:


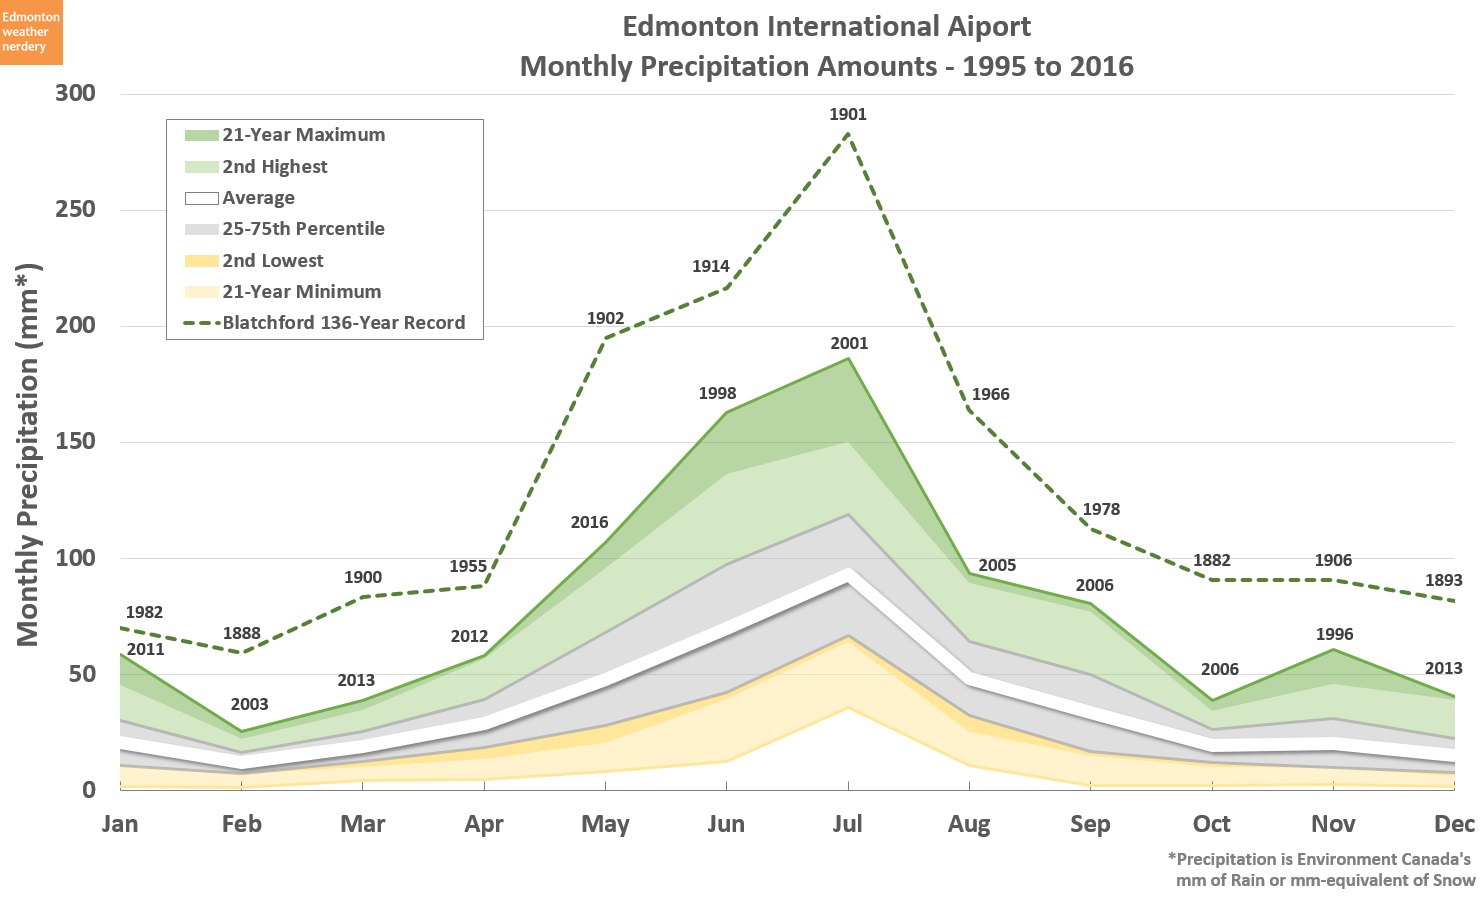
Environment Canada records the totals for rain and for snow, and they are shown in the graph above. This is the mm-equivalent of melted snow. If I used the freshly fallen unmelted snow the numbers are 10x as much, but that distorts the graph. Next winter I will definitely take a closer look at Edmonton's snowfall. But for now, this gives a sense of roughly how much of our yearly precipitation comes from snow or rain - for snow the average is 120mm versus 330mm for rain.

Update: I've reworked some of these charts using a different Blatchford dataset, which gives less suspicious results for the 1995-2005 period. The update can be found here.

2016/06/07

Record Watch - June 6

A warm June 6th at 29.6°C.


That's enough for fourth place after 32.2°C in 1961, 31.7°C in 1949 and 30.6°C in 1970. It is also by far the warmest June 6 that we've had recently, with 1977 being the last time that a June 6th broke 25°C.

Monday should be the only really, really warm day that we'll have this week. But here is a look at the top 50 warm days for this time of year (actually top 60, because there was an 11-way tie for 50th place at 27.2°C)


29.6°C puts this year in the 20th spot for the week.

I'd mentioned that the last time June 6 was above 25°C was in 1977, and that's a example of why I like to look at the whole week, and not just at one specific date. It's been 40 years without a warm June 6th, but there have been plenty of warm June 4ths, 5ths, 7ths...

In terms of records, 1961 not only has the record for the 6th, but also records for the 4th and 5th, which were part of a 5-day heatwave with temperatures above 30°C.

Looking at the decades, the 1890s and 1960s each had 9 days in the top 60. The 1910s only had 1. And so far the 2010s have had 2 - this year and last year.

2016/06/05

versus: Calgary - Part 1

In previous posts I've looked at how Edmonton's weather compares to the International Airport, and to some nearby rural stations. But today it's time for the main event - the battle of Alberta - Edmonton versus Calgary.

Beyond just perpetuating civic rivalries, I am actually curious how different the two cities are. And occasionally if I see something strange in the Edmonton numbers it would be nice to have another reference to compare it to.

This will be the first part of the Calgary comparison, looking at recent~ish temperatures going back to 1995. These should be reasonably representative of what we would see in a typical year.

Here is my standard rollercoaster chart showing how Edmonton's temperature varies throughout the year:


The white line is the average, the grey band is the 25th-75th percentile range, and the oranges and blues are the warm and cold extremes.

Here is the same chart of Edmonton's highs, but with the temperatures for the Calgary International Airport overlaid in red:

We can see that in the summer the high temperatures for the two cities are very close, but in the winter Calgary's average high is warmer.

Here are Edmonton's lows, compared to Calgary's in red:


And we can see that the winter lows are actually quite close, but in the summer Calgary's lows are a little bit cooler than Edmonton's.


Here is a closer look at the winter months, and I've also added the highest and lowest temperatures for Calgary to give a better sense of the fluctuations.

In the deepest, darkest depths of winter, Calgary's highs are 3-4°C warmer than Edmonton. It surprises me that it is that consistent, although thinking about it I guess that there are plenty of times when Edmonton is -10°C with Calgary at -6°C and I wouldn't even give it much thought.

That 3-4°C swing is right around the freezing mark, and it means that Edmonton's average high is below freezing from early-November through mid-March, while Calgary's average is only below freezing from late-November through early March. Those are just averages, and Edmonton will certainly have days above freezing during that period, but that small difference in degrees and that extra month-and-a-bit with melting might explain where all of Calgary's snow goes.

For the range of the highs, we see Calgary's famous chinooks with the highest highs being several degrees above Edmonton's. The lowest highs are very similar to Edmonton's.

The winter lows for the two cities are also very similar, with Calgary being maybe a degree warmer on average. The range from highest to lowest is also very similar, although in the last 20 years Calgary has gotten closer to -40°C than Edmonton has. So Calgary will get warmer than Edmonton during the day, but just about as cold at night.

For the summer we see the opposite story.

The two cities have very similar high temperatures, with very similar ranges. Edmonton does seem to be a little bit warmer in June, with Calgary a little bit warmer in August.

For the average overnight lows though, Edmonton is consistently several degrees warmer than Calgary during the summer. The average lows for Calgary are right inline with the 25th percentile for Edmonton, and the whole range of Calgary's lows is shifted down from Edmonton's. Looking at the period where Edmonton's average low is above freezing, it's about 3 weeks longer than for Calgary. These are just averages so they won't be a perfect match frost-free days, but it's the same basic idea.

Here's a closer look at the melty and frosty periods for Edmonton and Calgary:

I'm just eye-balling these off the graphs, and since they are averages they don't really correspond to anything - any given year will bounce around a lot more. But a few degrees difference right around the freezing mark means a few extra weeks of melts or frosts for the two cities.

One thing to note through all of this is that I am comparing data for Edmonton Blatchford (the former City Centre Airport) to the Calgary International Airport. Unfortunately, Environment Canada doesn't have a "downtown" weather station for Calgary, so this is the best comparison that I can make.

To give a sense of how things do vary, here are the high temperatures for Blatchford and the Calgary International, as well as for the Edmonton International, Canada Olympic Park, and the Springbank airport outside of Calgary:

For the high temperatures we see that the Calgary stations are grouped together, and the Edmonton stations are grouped together.

For the lows there is a little bit more variation:

The Edmonton International does get quite a bit colder in the winter than all of the others, and COP has the highest-low temperatures in the winter (as a non-Calgarian that seems strange to me. But I checked the numbers and they seem to be correct?). In the summer all of the stations are below Blatchford, with Springbank's average sitting around Blatchford's lowest.

In terms of distances, Blatchford is 4km from downtown, the Calgary International is 9km, COP is 10km, Springbank is 22km, and the Edmonton International is 26km.

So with the data that's available I think that a comparison between Blatchford and the Calgary International makes reasonable sense. But for a margin-of-error due to not having a downtown Calgary datasource, this gives some idea of the variation. For Part 2 of this Versus match I'll be looking at trends going back to the 1880s, and for that the only two stations available are Blatchford and the Calgary International.

With all of that said then, it looks like Calgary really does get warmer winter days than Edmonton, although they can't gloat too much because they get basically the same cold nights that we do. And as one of my Calgary friends used to say, Edmonton's warm summer nights make sitting on a patio here more pleasant. This is all based on averages which aren't my favourite things, so in Part 2 I'll try to put this into a bit more context in a few weeks.