2020/04/26

2019-2020 Winter-in-Review - Part 2 - Snow

Today we are going to take a look back at Edmonton's snow during the winter of 2019-2020.

If you are interested in the temperatures from the winter we took a detailed look at them: 2019-2020 Winter-in-Review - Temperatures.


Caveat: Winter is not (necessarily) over yet
Sometimes, Edmonton gets snow in May (and even very occasionally in June). In this chart every bubble represents a May or June snowfall at either Blatchford or the International. Late snow doesn't happen every year, but it actually averages out to about 1/2 the time.

In recent years 2016, 2017 & 2018 had snowless late-springs, but then in May 2019 the International recorded 4 snow days. And sometimes we're talking a lot more than just a few flakes: those big bubbles are for 11cm of May 6th 2015, 16.8cm on May 4th 2010, 17 cm on both May 5th & 6th 2003, and so on.

So fingers crossed, but who knows?

The reason that we will do the winter snow wrap-up now is because of this:
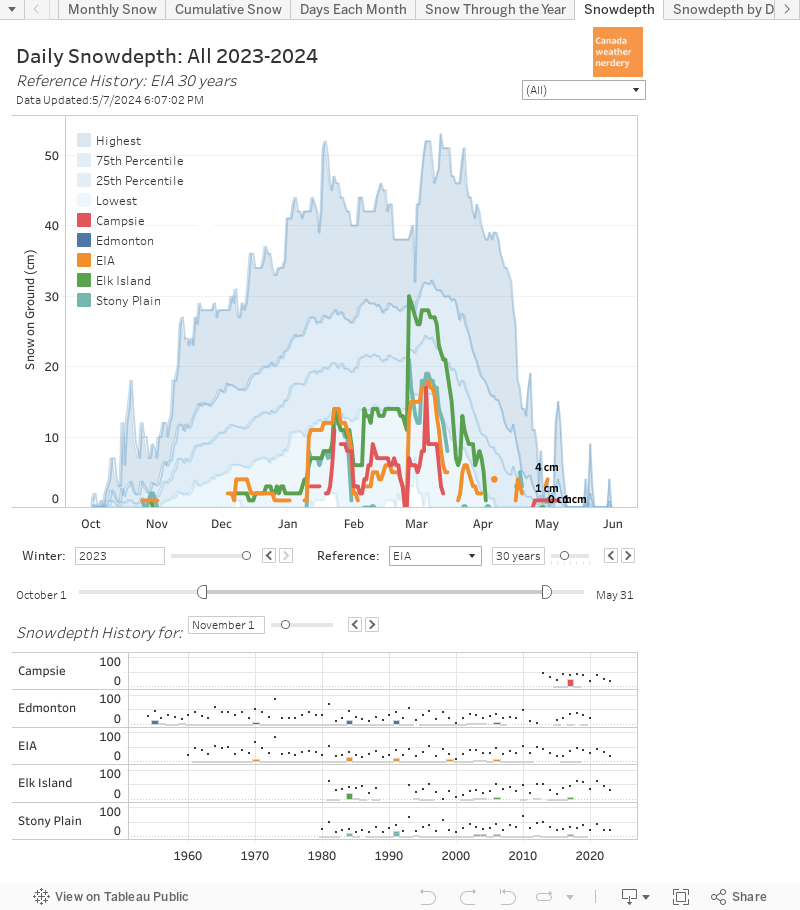

Snowdepth
The snow at the International finally melted on April 22nd. Environment Canada doesn't report 0cm of snow anymore, but the final snowdepth recordings were 1cm on April 15th at Blatchford, and 2cm on April 21st at the International.

The little bargraph at the bottom of this chart shows years which had snow on April 22nd, at it is a short list.

Looking back over the winter as a whole:

  • a storm on November 10th pushed the International up to 19cm, and Blatchford up to 10cm.
  • Blatchford melted back down to 0cm for about a week, while the snow at the International hung around. 
  • From the beginning of the December the snowdepth at both stations climbed fairly steadily.
  • For Blatchford the snowdepth peaked on February 18th with 32cm, but at the International the peak wasn't until March 8th with 41cm.
  • Snowdepth had a few dips in March, but the big melt didn't really start until April 6th at Blatchford and April 7th at the International.

Snowdepth Each Year
Here we have the snowdepth throughout the year compared to other recent years. Only about 8 winters fit onscreen at a time, but the data going back to 1955 is all here if you scroll down a bit. (Blatchford data was missing from 2012-2015, if you're wondering)

This winter's peak of 41cm at the International was below 2018-2019's peak of 45cm, but was higher than the four winters from 2014-2015 through 2017-2018. The last time that we saw a peak above 50cm was 1996-1997 with 53cm, and 1973-1974 was a really big year reaching 84cm in late March.

It is fairly common for the snow at both stations to melt by about the beginning of April, but there are some winters - 2019-2020, 2017-2018, 2012-2013, etc - which drag things out for a few extra weeks.

The International's final day with snow was April 21st, and here we have the only recorded years with snow the day after that on April 22nd. And since records began in 1955 there were only 7 years with snow that late:
  • 2008, 1985 & 1972 don't really count because they were all on their second round of snow.
  • 2013 lasted until April 25th
  • 1974 lasted until to April 22nd
  • 1967 lasted until April 24th
  • 1965 lasted until April 23rd

So the melt of 2019-2020 was almost as late as it gets.

For some context this chart has a comparison of the snowdepth through they year for various Canadian cities. It's currently set for Edmonton (Blatchford data only), Calgary & Montréal, but Vancouver, Winnipeg, Toronto, Ottawa & St. John's are in there too.

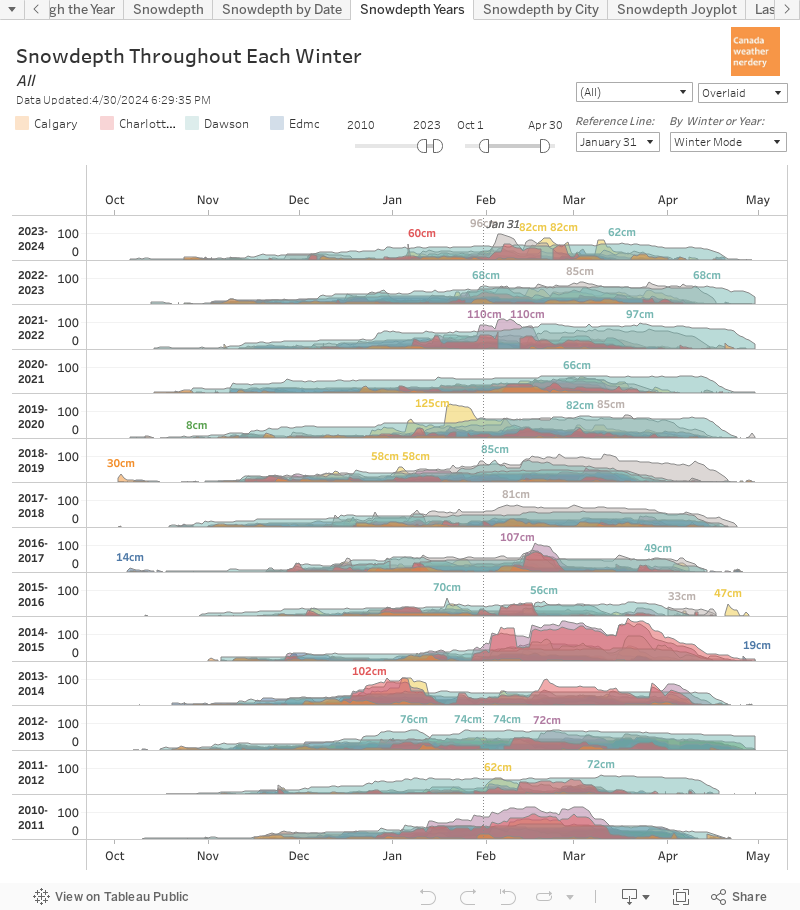
All the other cities had melted long before Edmonton...except for St. John's where the snowdepth peaked at 125cm(!) in January, and lasted until April 14th.


Lasting Snow
Back to Edmonton, the International finished off the winter of 2019-2020 with 169 days in-a-row with snow on the ground, from November 5th to April 21st. In 2017-2018 the International went 172 days, with an earlier start on October 31st, and the final melt on April 20th.

For 2019-2020 Blatchford went 141 days from November 27th to April 15th.


And here we have a look at other cities again:

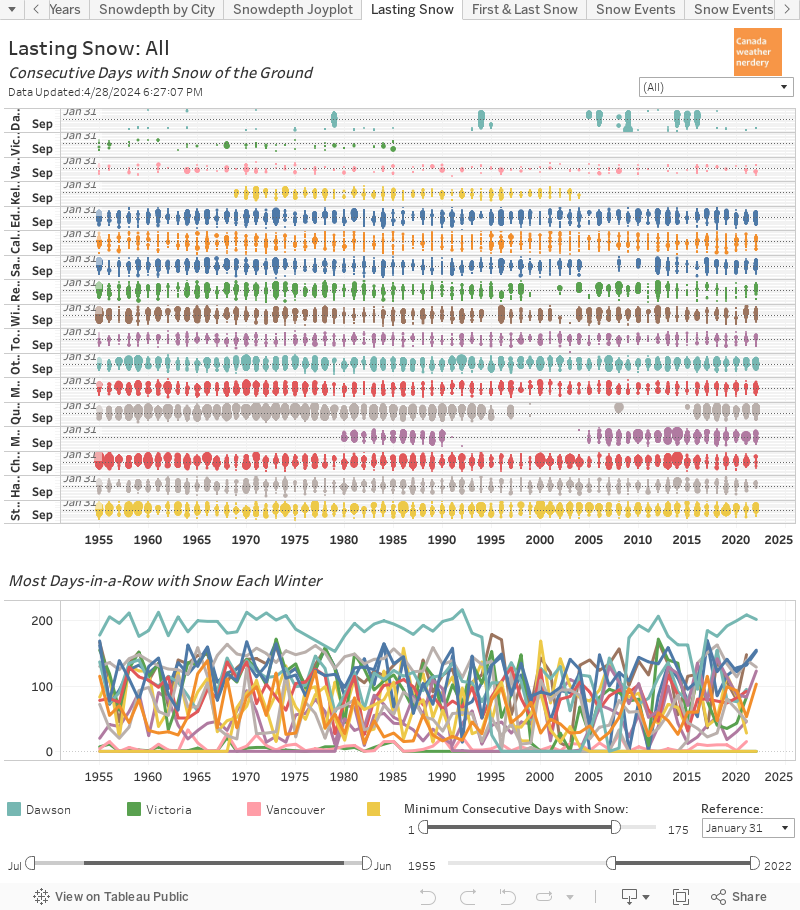
  • For Edmonton (Blatchford) and Winnipeg it's fairly typical to go 120 or more days with snow on the ground.
  • Calgary often only goes about 50 days in-a-row with snow, but in 2019-2020 they went 99.
  • Montreal goes about 75 days in-a-row, which Ottawa is closer to 100.
  • And of course Vancouver rarely has snow on the ground for more than 10 days in-a-row.


First & Last Snow
It's always possible that we will get more snow, but right now it looks like the final snowfall of 2019-2020 at the International was April 15th, which is earlier than the recent average of April 24th.

And back in the fall the first snow was October 7th, which is about average over the long run, but is late compared to some recent years: 2018 was September 12th, 2017 was September 19th, 2016 was actually August 27th, and 2014 was September 8th.

So from first snowfall to final snowfall was 191 days, or a bit over 6 months.
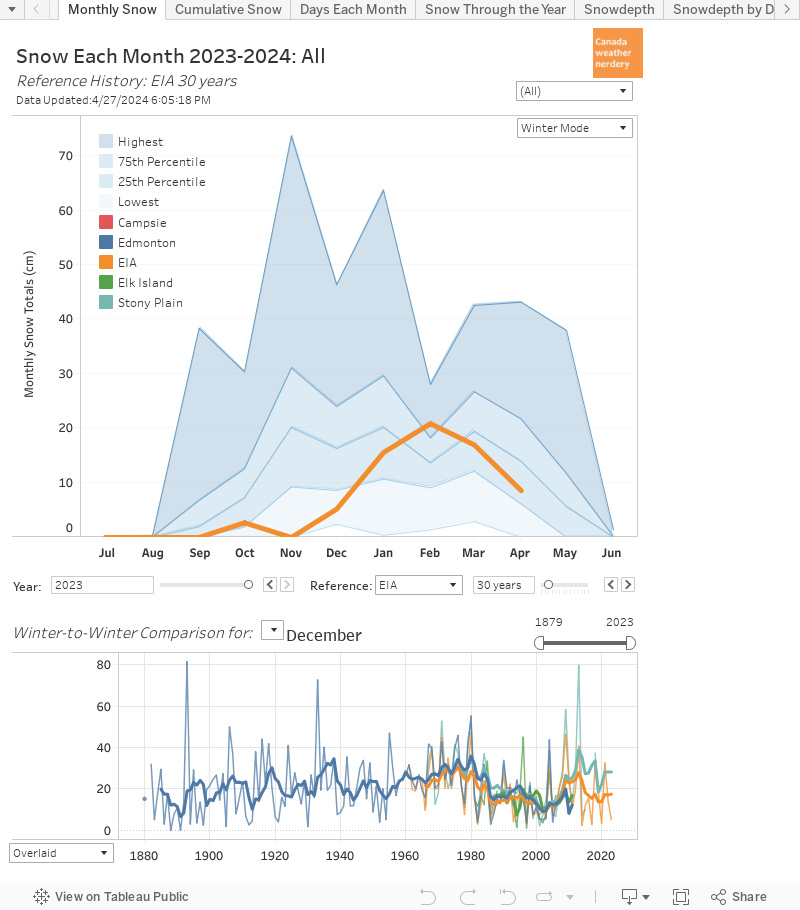

Monthly Snow
Broken down by months this is how things went:
  • October through January were all in the normal range.
  • February & March were a little high, but nothing extreme.
  • April's 5.5cm was the most below-average month.

And here we have Calgary & Montréal for comparison again, with data for all of the other cities accessible as well:

  • Calgary has 114cm of snow in September through November, which was its snowiest early-winter since 1945. Then December and February through April were all fairly average. January was very low with only 3.9cm.
  • Montréal's February was high with 67cm, and its March & April were both below 10cm and very low.
  • Winnipeg had its snowiest October since 1919. St. John's had a massive January, and Vancouver's was above their average too. Toronto's February was above average, 


Total Snow
The International's total snow for the winter of 2019-2020 (so far) ends up at 125.6cm, which is basically right on our average.


And this messy chart has the snow totals for all of the cities for 2019-2020:
  • Halifax was way up at 412cm
  • Calgary, Montréal & Ottawa were all around 190-200cm.
  • Toronto 139cm was above Edmonton's 125cm and Winnipeg's 102cm.
  • And Vancouver was way up at 45cm, (their average is 35cm)


Large Storms
During the winter of 2019-2020 the International only recorded 2 days with 10cm of snow: November 9th with 11.4cm, and January 22nd with 10.5cm. On average we get one or two 10cm snowdays each year, so that was fairly typical. We only had 4 5cm snowdays, and that was a bit below the average of 7 each winter.


And finally, one more messy chart which shows the 20cm snowdays this winter for the various cities:

  • Calgary had 24.6cm on September 29th.
  • Winnipeg had 21cm on October 10th.
  • Montréal had 27.4cm on February 7th.
  • And St. John's had 23cm on December 24th, 30.2cm on January 5th, and then approximately 76cm on January 17th (the official data is missing for that day).


Summary

Generally the snow for the winter of 2019-2020 in Edmonton was fairly average...with one notable exception:

  • the one unusual thing was that the final melt was very late. It was similar to 2018 & 2013, but was almost a month later that 2016, 2015, 2014...
  • The total snow of 125.6cm was basically right on our yearly average.
  • The snowfall for all of the months was fairly typical: February's 23.6cm was a little high, and April's 5.5 cm was quite low. 
  • The first snow on October 7th was average, and the final snow (so far) on April 15th was a bit earlier.
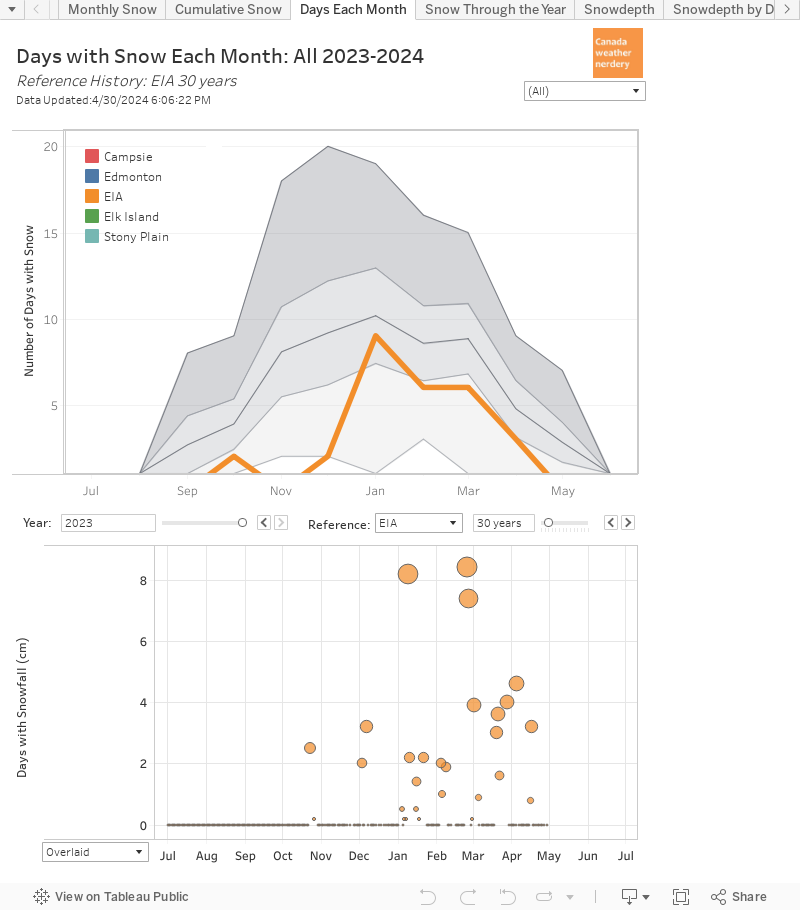
  • We had two 10cm snowdays which is the average for each winter, but we also typically get about seven 5cm snowdays and 2019-2020 only had four.
  • We couldn't possible cover all of the the other Canadian cities in detail, but Calgary & Winnipeg both had very snowy autumns, and St. John's & Vancouver (of all places) had snowy January's.

2020/04/23

Stubborn Snowdepth: April 22nd

It finally happened: on April 22nd the International Airport's measurement of snowdepth was blank:

The International's final snowdepth measurement was 2cm on April 21st, and Blatchford's was 1cm on April 15th.

(Environment Canada used to report "0cm" which works better for this chart, because then it can actually close the loop. "Blank" leaves things hanging.)


Here is how the snowdepth for the winter of 2019-2020 compared to other years.

A final snow on April 15th at Blatchford is late, but not as late as 2017-2018 which went to April 19th. And April 21st is also late for the International.


The International's snow was gone on April 22nd, but since records began in 1961 (or 1955 for Blatchford) there were only 7 other winters which did still have snow that late. They are shown in the chart above:
  • 2008, 1985 & 1972 were all on their second round of snow by that point.
  • 2013 lasted to April 25
  • 1974 lasted to April 22
  • 1967 lasted to April 24
  • 1965 lasted to April 23
So only 4 winters at the International had later melts than 2019-2020.


The International finishes the winter with 169 days in-a-row with snow on the ground - from November 5th to April 21st. 2018 went 172 days, with an earlier start on October 31st, and the final melt on April 20th.

Blatchford went 141 days this winter, from November 27th to April 15th. That was well below the 170 days in 2017-2018, from November 1st to April 19th.

2020/04/12

2019-2020 Winter-in-Review - Temperatures

Today we are going to look back at the winter of 2019-2020 to put it in context. We have been doing this for a few winters, now:

Normally at Edmonton Weather Nerdery when we talk about "winter" we use November 1st through March 31st, because the temperatures make a nice mirror:


The average Highs at the beginning of November are about 5°C, and by the end of March they are back up to about 6°C. And the average Lows are about -3°C at both the beginning of November and end of March.

The problem with the winter of 2019-2020 is that it seems like it's never going to end. The last two weeks of March were cold, and that has carried on into the first two weeks of April. And we even hit -20°C in April for the first time since 1982.

So for the winter of 2019-2020 we will include early April as well.

Low Temperatures
Here we have the Low temperatures for the winter:

  • The cold started early, with a few days near -20°C at the beginning of November, but after that things were fairly mild through New Year's.
  • Then we had the two-week mid-January deepfreeze, and on January 15th temperatures dropped all the way to -37.6°C (or -42.3°C at the International). That was Blatchford's coldest day since January 19th, 1996 which hit -37.8°C, and before that January 25th & 26th 1972 hit -38.9°C and -41.1°C respectively. It was very unusual.
  • February had a short deepfreeze in the middle of the month, hitting -26.9°C, but also had quite a few above average days.
  • Then March was pretty cold and spent some time near the bottom of its recent range.
  • And April started very cold, with some new coldest-in-30-year Lows.

The bargraph at the bottom of this chart compares all of the Lows for each winter, and if you click or hover on 2019-2020 its Lows ranked as #55, with an average Low of -11.8°C which was just a bit below the 30-year average. You can click on any of the other bars to see the temperatures for a warm winter like 2015-2016 of 1930-1931, or for a cold winter like 1886-1887.

You can also change this from Lows to Highs, which ranked as #53 warmest. And you can change the date range to exclude the cold end of March and early April: just for November 1 through March 15 this winter had the #36 warmest Lows and #33 warmest Highs, so the past few weeks really dragged it down.

We will look at a lot of charts today, which all say basically the same thing - this was a fairly typical winter, with a cool spring. So if you find a chart that you like trying clicking around or changing the sliders to explore the data a bit.


2019-2020 Compared to the 20th Century Average
We often use the average temperatures for the 20th century as a handy benchmark, and here we the temperatures for each day of the winter compared to their 20th average. The red lines show the Means (High & Low), the Highs, and the Lows, and a warm day moves the lines up while a cold day moves them down.

For all 3 lines we see a slight dip at the beginning November for the cool start to winter, and then after that the warm temperatures pushed the line upwards until mid-January. Then in mid-January we had the deepfreeze which pushed the line down. Then the line climbed again until early-March, and our late, cold spring pushed it down again.

This isn't my favourite chart, but the mess of spaghetti lines in the background represents each of the winters going back to 1880. And so while 2019-2020 was not particularly warm, but on average it was about 1°C warmer than the 20th century average. We can also see that at the beginning of March this winter ranked as about the #30 spot, but fell to #56 with the cold spring.


Warm & Cold Months
Here each month of the year is represented by a bubble. Months which were warmer than the 20th century average are orange, and colder months are blue. And the size of the bubble represents how much warmer of colder they were.

November, December, January & February are all orange bubbles ranging from 1.1°C above average for November & January, to 3°C for December, to 4.3°C for February. March was the only below-average month, at -1.6°C.

It is important to make the distinction between the 20th century average and recent years, though. January 2020 was warmer than the 20th century average, but it is the smallest bubble here since 2004, because recently we had had a string of very warm January's. February 2020 was much warmer than the giant blue bubble for the incredibly cold February 2019. And the bubbles for November & December 2019 are a pretty close match to November & December 2018.


Across Canada
And here we have a quick comparison of the winter across Canada:

  • Winnipeg through Montréal all had a relatively cold November.
  • All of the cities were above average for December, January & February.
  • Edmonton's cold March was shared by Vancouver, Calgary & St. John's. While Regina through Montréal were all from 2°C to 4°C above warmer than their averages.

Radial Chart
This chart is really just for show, but it combines a bunch of interesting information in one place:
  • The big circle at the top shows how relatively warm or cold each winter. 2019-2020 was pretty similar to 2018-2019. And those were both a lot warmer than 2017-2018, but a lot colder than 2015-2016. And we also used to get a lot more blue lines a century ago than we do today.
  • The smallest circle on the lower left is each month, with the cold March in blue and the warm February in orange. If you click on any of those months
  • The small~ish circle lower down in the middle is how much above or below average each day of the winter was. For the January deepfreeze there is a blue spike for January 15th which was 18°C below average. And there is another blue spike at the beginning of April which was 15°C below average.
  • The small~ish circle on the lower right is the actual, daily temperature. And so even days which where well above average (like January 1st, or February 1st) still had mean temperatures below freezing.

This is another fun chart to play around with by changing the date range, switching between Highs/Lows/Means, or looking at the results from other cities. Montréal had a warm winter (#17 spot) while St. John's was fairly cool (#65 spot)


Really Cold Days

This chart shows the number of Lows which hit -20°C each winter. The winter of 2019-2020 had 18 of those, which was less than the previous 3 winters, but more than 2015-2016 which was down at 6. Right now we average about 23~ish per winter, which is about half as many as a century ago.

The winter of 2019-2020's first -20°C was a -24.2°C  on January 9th, which is very late. But then the final -20°C of the winter was a -20.8°C on April 2nd, which was the first -20°C in April since 1982.


The winter of 2019-2020 has 9 Lows hit -25°C, which is about average, although there is a lot of variation between individual winters. 2015-2016 only had 1, 2016-2017 had 6, 2017-2018 had 11, and 2018-2019 had 19 (mostly during the incredibly cold February).


The winter of 2019-2020 has 4 Lows hit -30°C, all during the January deepfreeze. 2018-2019 also had 4, 2017-2018 had 3, and before that 2015-2016 & 2016-2017 both had none.

And finally, The winter of 2019-2020 actually had a Low below -35°C, with January 15th down at -37.6°C.

A -35°C is not something that happens every year at Blatchford. That last one was more than 10 years earlier on December 13, 2009 at -36.7°C. There was also one in 2008, 2004, 1997, 1995, etc.

This chart shows how big the gaps are between -35°C Lows at Blatchford. The 3,863 from December 13, 2009 to January 15th, 2020 had been the longest recorded.


Warm Days
We have talked about how 2019-2020 was a cool~ish winter, but from November 1 to April 7 (158 days) 76 had Highs of 0°C or more. That's 48% which is right on the average.

If you switch the date range in this chart to just the deep-winter months of December, January and February (90 days) we had 36 with Highs of 0°C or more 40%, which is also about average.

For 5°C days we had 24, which is well below the average of 40. That was dragged down by the cold March & April.

Just in December-February we had 8 days hit 5°C, and that was actually still down from the average of about 13.

For 10°C days we had 4, which is well below the average of 12, and which again was dragged down by the cold spring. Although in recent years the winter of 2017-2018 only had 1 10°C from November 1st through April 7th.


That is it for a review of the temperatures for the "winter" of 2019-2020. All of these dashboards contain the data for Edmonton, as well as 8 other Canadian cities. We will be back in a week or two with the recap of the snow for the winter of 2019-2020.

2020/04/08

Stubborn Snowdepth: April 7, 2020

The beginning of April 2020 was chilly, and finally on April 7th we hit 4.9°C.

Before that the last "warm" day we'd had was back on March 27th at 10.1°C. Then March 28th was still been above freezing at 2.2°C, then we'd had 8 days below freezing, and then April 6th made it all the way to 0.4°C.

So April 7th's 4.9°C finally marked a return to typical temperatures, although it was still below the average of 8°C.


Early-April is typically peak-melting season, but the cool week put that on hold.

April 7th's 4.9°C dropped Blatchford's recorded snowdepth to 19cm, which was just a bit below 2018's 24cm.

But even with the warmish temperatures the International Airport's recorded snowdepth stayed at 39cm. That's the highest April 7th snowdepth since 1974, which was way up at 61cm. April 7th, 1980 was also close, at 37cm.


So as I'm typing this the melt for the winter of 2019-2020 hasn't really started yet. If you are looking at this in a few days or a few weeks this chart will show how everything played out.

In this chart you can scroll down through the history of spring melts. Our median snowdepth hits 0cm right around the beginning of April. And so some winters are earlier, like 2018-2019, 2016-2017, 2015-2016, 2014-2015, etc. And some are later, like 2012-2013, 2017-2018, and now 2019-2020.

2020/04/03

Record Watch: April 2, 2020

April 2, 2020 wasn't a record, but it's worth talking about.

Low Temperatures
The low temperatures on April 2nd, 2020 hit -20.8°C. That's still well above the record (the thin, blue line) but it was a new coldest-in-30-years temperatues.


History
The actual record was back in 1954 at -25.6°C. And 1920, 1935 & 1936 were also all a bit below -22°C.

So April 2nd, 2020 wasn't a record, but it was still notable.


-20°C in April
This was the first -20°C that Blatchford had recorded during April since 1982. And going all the way back to 1880 there were only 12 years total that had a -20°C in April.


But 2018 was also Cold (and 2002 too)
-20°C is obviously an arbitrary cutoff , and so it is worth mentioning that cold Aprils are not totally unknown. April 2018 started with a few Lows around -18°C (even as late as April 6th). And April 2nd, 2002 almost hit -20°C with a Low of -19.5°C.

So the April 2nd, 2020 Low of -20.8°C is a nice piece of trivia, but it's not entirely unusual.

2020/04/01

March 2020 Review / April 2020 Preview

We're going to cut right to the chase today: was March 2020 as bad as it seemed?


High Temperatures
Here we have the high temperatures for March, and on the bright side the first week was fairly warm? After that it was a lot of ups and down...but mostly downs. March 14th hit a coldest-in-30-year High of -15.2°C, and then we had another one on the 30th at -10.8°C.

The average High on March 1st is -3°C, and by March 30th it increases to +7°C, but in March 2020 the Highs went in the wrong direction.


Looking at the numbers, for March 2020 we had 18 Highs hit 0°C, and that's only a bit below the March average of 20.

But March also averages 12 days which hit 5°C including 4 which hit 10°C, and 2020 only had 6 and 1 of those, respectively.

March 2020's average High of -0.8°C was definitely cooler than average, but was still well above something like 2011's -4.2°C or 2002's -6.4°C.


Low Temperatures

The Lows were also cool, with only 8 that were above average, and 6 of those were in the first week of the month. And the middle of the month had two coldest-in-30-year Lows on the 13th and 15th, along with the cool final week.


March 2020's average Low of -11°C was at the lower end of recent Marches, although 2002 was way down at -16.2°C

We didn't have any -25°C Lows, but the 15th did hit -23.7°C, along with a -20.5°C on the 13th. March averages 1.5 -20°C Lows. Recently March 2018 ended with a -20°C on the 30th, so 2020's month-end coldsnap should not feel completely unprecedented.


Warm & Cold Months
When we add up the Highs & Lows March 2020's mean temperature of -5.9°C ranked as Edmonton's 91st warmest March in the past 140 years. It definitely wasn't warm, but many years (including 2002, 2009, 2011, 2013 & 2014) were colder.


And so when we compare it to recent years March 2020 is a small~ish blue bubble, at -1.6°C colder than the 20th century average for March. That follows a January and February which were 1.1°C and 4.3°C warmer than their 20th century averages.


The biggest problem with March 2020's weather is comparing it to other cities across Canada, shown here as the bubbles furtherest to the right.

Vancouver, Calgary & St. John's shared Edmonton's cool start to spring, although Edmonton's was the coolest. And for Regina through Montréal March 2020 was well above average.


Snow
Everyone is always surprised/annoyed by late-spring snow, but it is basically guaranteed.

2020's 26.2cm was above the March average of 19cm, but was still very typical.


However March did count 13 days with snow, which is quite a bit higher than the average of 8 snowdays.


For the winter so far that brings our total snow to 120.1cm, which is a bit above average for this time of year. Our average for an entire winter is about 125cm, and so we are close to that total, even though there is potentially another month and a half of snow ahead of us.


Snowdepth
The snowdepth had started to fall at both Blatchford and the International, but just took a big jump up. It's well above average, and still a long way from 0cm.


Right now Blatchford has had snow on the ground for 126days in-a-row, and the International got started earlier so it is at 148days.

Those numbers are getting high, but right now they are still well down from 172days at the International in 2017-2018, or 146 days at Blatchford in 2010-2011. (Blatchford data is missing for 2011 through 2015).


This is a comparison of the spring melts for recent years.

2014-2015, 2015-2016, 2016-2017 & 2018-2019 all had earlier melts, hitting 0cm by the beginning of April. That is definitely not the case for the winter of 2019-2020 though, which is looking a bit like 2017-2018.


April Temperatures


As far as April goes, it looks like we will be starting things off well below average, which also happened in 2018 & 2002.

For High temperatures on-average April only has 3 days below 0°C, so once this coldsnap passes we should finally be into warmer temperatures. About three-quarters of the time April will have a day hit 20°C, and 2001, 2015, 2016 & 2018 all had days hit 25°C.

Only about one-third of recent Aprils had any Lows hit -10°C. And we haven't had a -20°C in April since 1982, and before that it was 1975, and then 1954.

We almost certainly haven't seen the end of the snow though, because in April and May we average another 15cm and 6cm of snow respectively.