Today we are going to take a quick look at how temperatures vary between Edmonton and its surrounding stations during the coldest days of the year.
This is a bit of a follow-up to our look at heat islands during heatwaves from last summer: Heatwaves & Heat Islands. The Heat Island Effect is the idea that urban areas hold more heat than outlying areas, and we are going to see how that applies to the Edmonton region.
Christmas 2021
This chart shows the temperatures around Edmonton for the quite cold days of December 24, 25 & 26, 2021. The city was typically the warmest station, but not in a consistent way:
- For all 3 days the Highs are fairly close across all of the stations, with 1~1.5°C separating them.
- The Lows are more variable, with a 3~5°C gap compared to the city.
- December 24th is the warmest day here, and it also had the least variation in Lows, with all of the stations from -24°C and -26°C.
Let's take a look at how things work on average.
Blatchford versus the Edmonton International
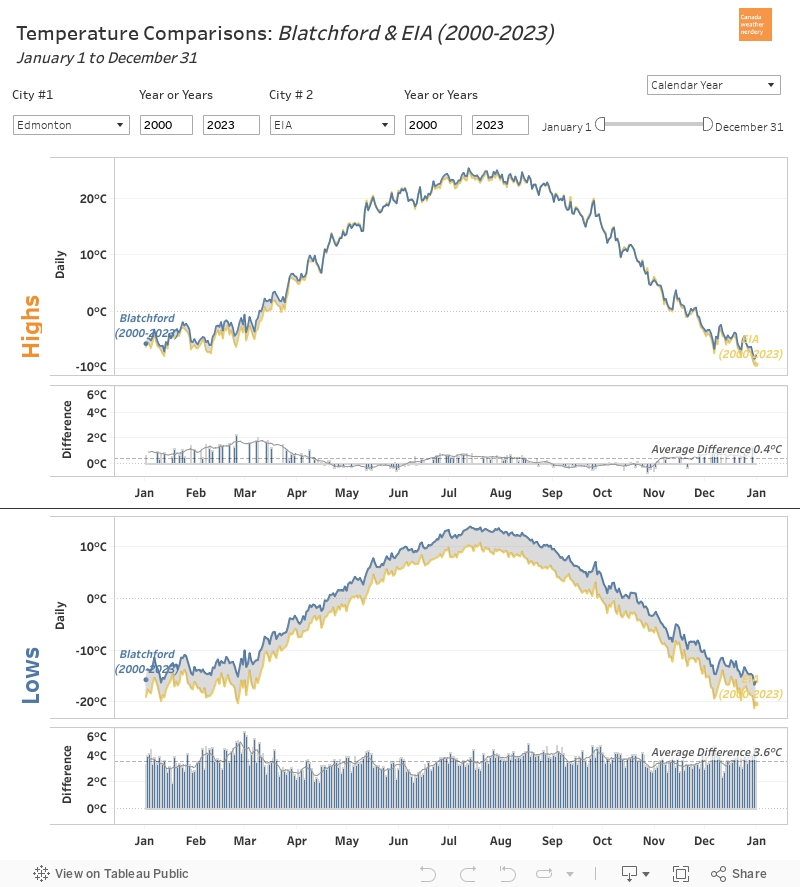
Here we have the average temperatures for 2000-2021 for Blatchford (near downtown Edmonton) and for the International Airport (30km south).
Throughout the year the average Highs are fairly similar, with Blatchford averaging about 0.4°C warmer than the airport. That varies depending on the season though, and the biggest difference occurs in late-February and March, when the city's Highs are about 2°C warmer than the airport.
The Lows for the two stations are quite different, with Blatchford on-average 3.6°C warmer than the airport. That difference is fairly consistent through the whole year, but it also peaks in March with Blatchford's average Lows about 5°C warmer than the airport's.
Average Winter Differences
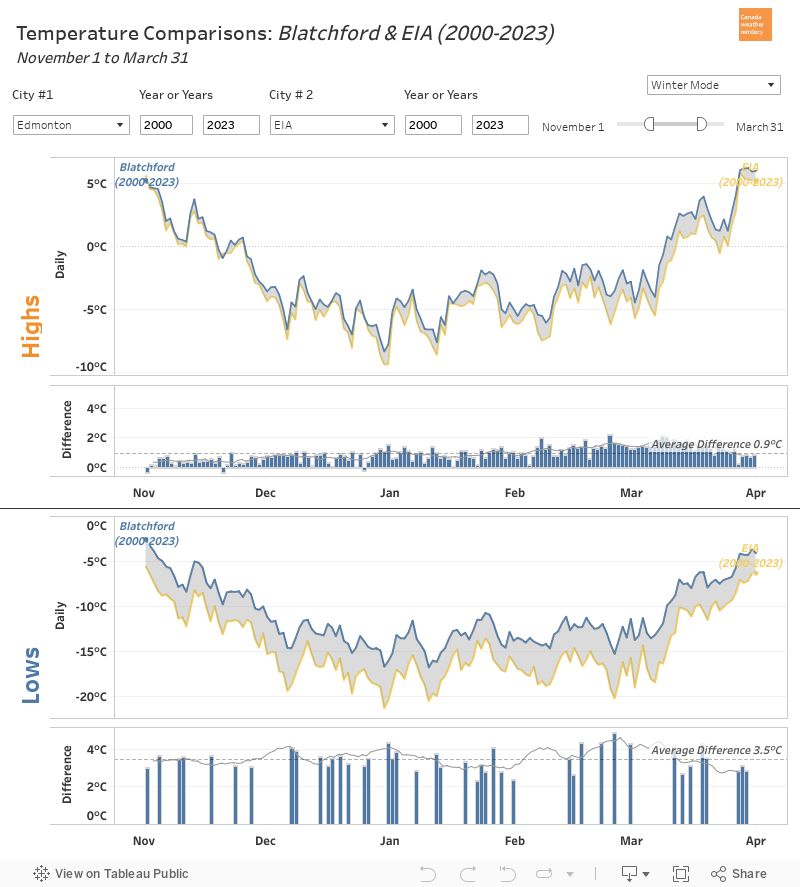
Here is the same chart, but now we are just looking at the winter months of November-March. The gap for the Highs is smaller than the gap for the Lows, but they are both largest right around the start of March.
These are the average winter temperatures over two decades - so it includes all of the deepfreezes, but also the typically cold or warm days. Let's get away from averages and take a look at one specific winter:
Winter of 2019-2020
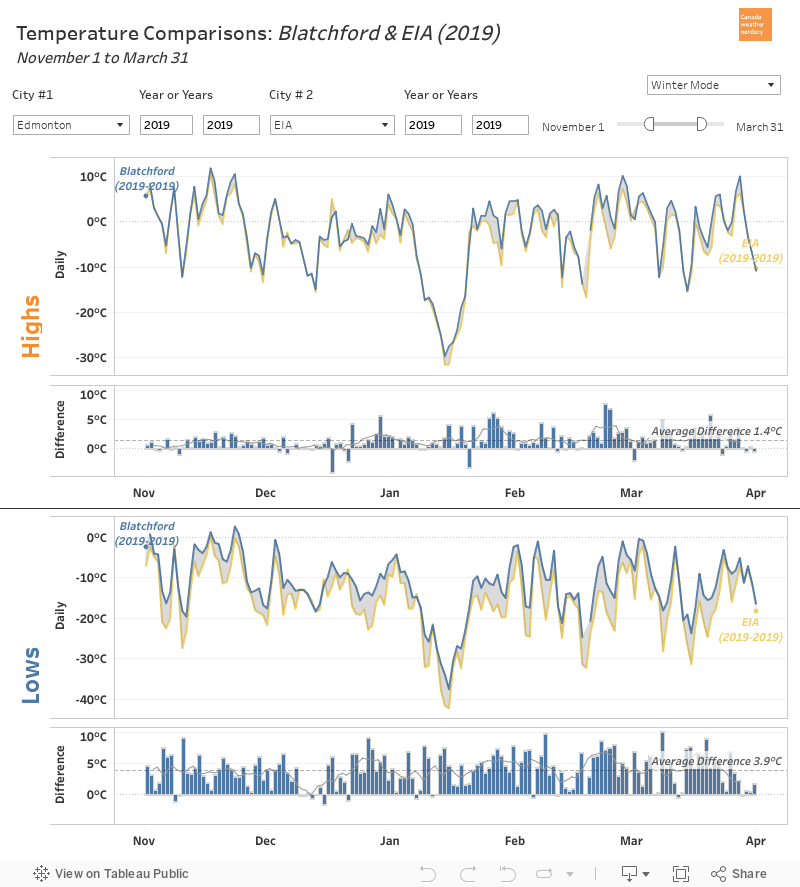
These are the temperatures at Blatchford and the airport for the winter of November 2019 through March 2020. On January 15, 2020 Blatchford hit -37.6°C which is very cold for the city, and that's why we picked this winter as an example.
The average differences across this whole winter are similar to what we saw for the 20-year averages, but on individual days the differences can be much larger. The largest were:
- March 8: 10.1°C difference, with Lows of -18.1°C at Blatchford and 28.2°C at the International.
- February 8: 9.9°C difference with Lows of -10.5°C at Blatchford and 20.4°C at the International.
- December 26: 9.2°C difference with Lows of -13.6°C at Blatchford and 28.2°C at the International.
Those are just examples, but none of them happened to be on super-cold days. For the really cold -37.6°C day at Blatchford the airport was 4.7°C colder at -42.3°C.
All of that is just to give a sense of how things can compare between Blatchford and the International.
Now let's take a look at how things have changed over time, and we will add in a few more stations:
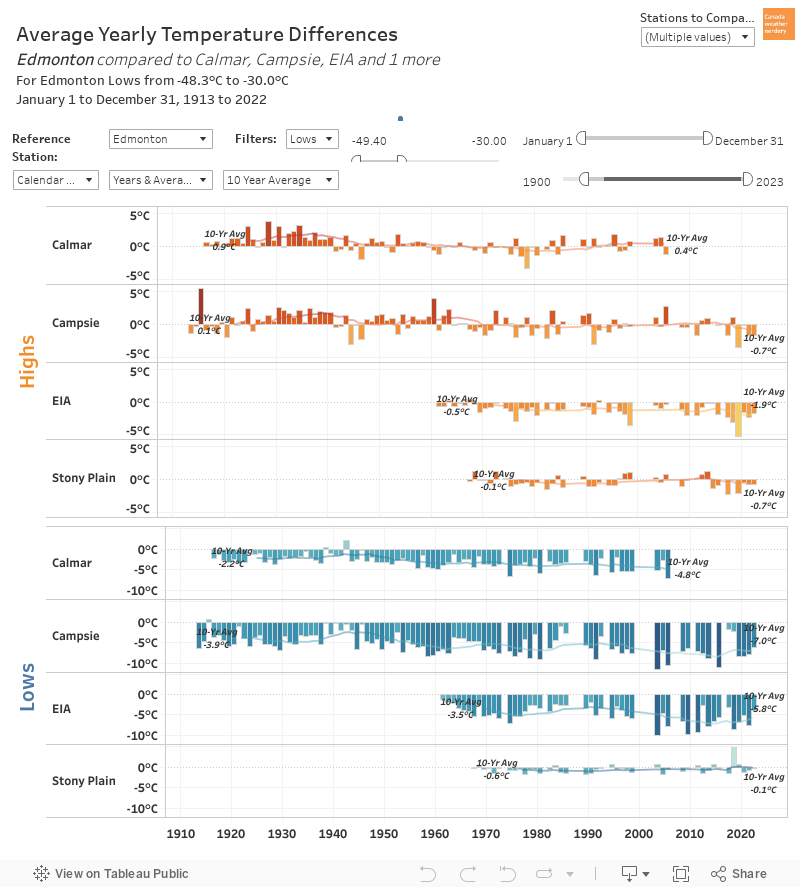
Deepfreezes: -25°C Lows at Blatchford
We will be using a few different versions of this chart, so let's start with a short explanation:
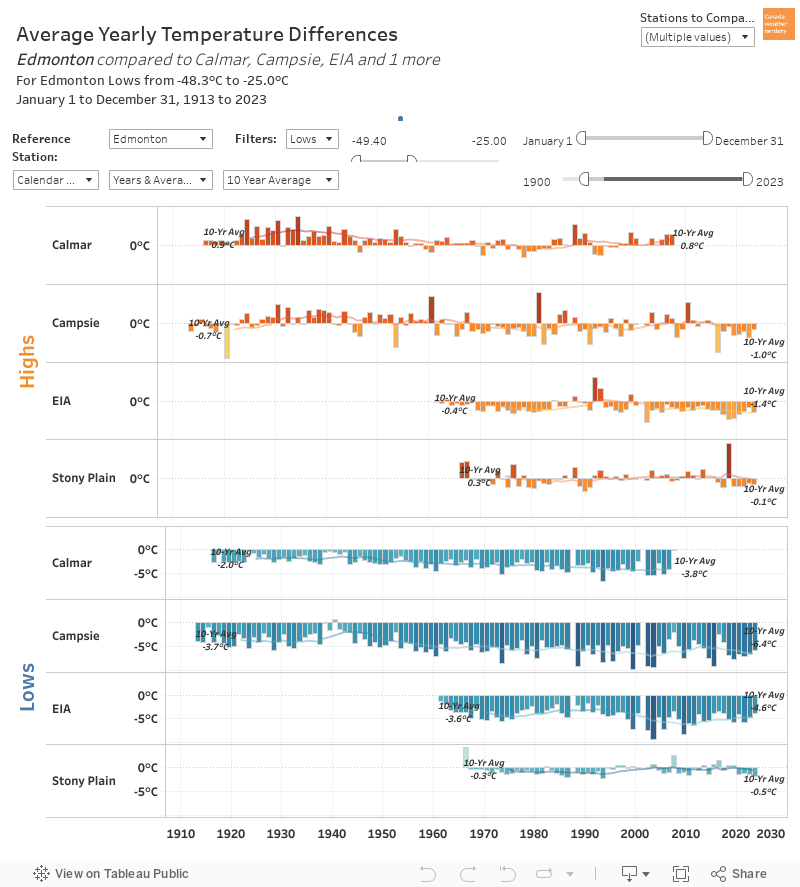
- This compares the temperatures at Blatchford to 4 outlying stations which have long~ish histories.
- A positive bar (a bar above zero) means that the outlying stations was warmer than Blatchford. Negative bars mean that the outlying stations was colder, while Blatchford was warmer.
- This is only for the days where Blatchford had a High of -25°C. There will be more days where the outlying stations were cold but Blatchford wasn't, but those aren't included here. For this example Blatchford is the reference.
- The bars here are the average difference for all of the cold days in each year. We only get about 10 -25°C Lows per year, so the sample size is pretty small, and can be swayed by outliers if there was only one or two days.
With all of that out of the way, what do we see here?
Let's start with the Highs:
- 100 years ago when Blatchford's Low hit -25°C the Highs at the Campsie & Calmar stations were on average warmer than Blatchford's. But by about 1970 that gap had closed and the Highs were roughly equal.
- In the 1960s the International's Highs averaged about -0.4°C cooler than Blatchford. Nowadays that has maybe increased to a -1.3°C difference?
- For Stony Plain the Highs are pretty close. There are a few tall outlier bars here, but in general the average difference is a fraction of a degree, and that has been the case since the 1960s.
For the Lows:
- 100 years ago on cold days when Blatchford's High hit -20°C the Lows at Campsie & Calmar were colder than Blatchford's, and they're still colder today. The difference has gotten bigger, though. Calmar's Lows averaged -1.9°C colder in the 1920s, but the gap had increased to -3.8°C when the station shut down in 2007. For Campsie the gap was -3.4°C in the 1920s, and is close to -6.1°C today.
- In the 1960s the International's Lows averaged -3.6°C colder, and today it's about -4.6°C colder.
- Stony Plain's Lows are again quite close to Blatchford's. In the 1960s the gap averaged -0.7°C, and today it is -0.2°C.
As we saw earlier, Blatchford's Highs are fairly close to the outlying stations, while the gap for the Lows is larger. Looking back 100 years Blatchford's Lows were always warmer than Campsie & Calmar, but over the past century the gap increased by 2~3°C. And while we are used to seeing ridiculously cold temperatures at the airport, the average difference between Blatchford and the airport has only changed by about 1°C since the 1960s.
Deepfreezes: -30°C Lows at Blatchford
A -25°C day at Blatchford is pretty cold, but let's take it up a notch and only look at days where Blatchford's Lows reached -30°C. Once again, the sample size is quite small with usually only a few days each year.
The Highs look pretty similar to what we saw in the -25°C graph.
For the Lows the outlying stations are consistently cooler again, but the numbers have changed a bit.
- For Calmar, when Blatchford hits -30°C the gap was -2°C a century ago, and grew to -5°C by 2007.
- For Campsie the gap grew from -4°C a century ago to -7°C today.
- For the airport the gap was -4°C in the 1960s & 1970s, but is more than -6°C today.
- And when Blatchford hits -30°C, on average Stony Plain isn't very different.
There is a sample size issue here, because we get fewer -30°C days than we used to, so the recent years are counting fewer days. But at least in terms of perception, when Blatchford hits -30°C stations like the airport and Campsie average -6°C colder.
Deepfreezes: -35°C Lows at Campsie
Here is one more version, but this time we've flipped things and are using the outlying station Campsie as the reference. This is a temperature comparison for days when Campsie's Low reached -35°C.
For the Highs, once again all of the stations are relatively close, even on these extreme deepfreeze days.
For the Lows, when Campsie hits -35°C the International Airport and Calmar both tend to be a few degrees warmer, and that gap has been fairly consistent over the years. For Blatchford though, 100 years ago the gap was around 7°C, while in modern years it has been closer to 10°C. And for Stony Plain the gap increased from 7.9°C to 9.2°C since the 1960s.
Summary
We have talked about the Heat Island Effect
many times here, and it is because Edmontonians are used to seeing these huge temperature gaps between Blatchford and the airport. And that can lead to the idea that the airport is the "natural" temperature, while Blatchford's gets an artificial increase because it is the big city. But is that correct?
As we have seen with these stations, there is a much bigger urban-rural gap for the daily Low temperatures than for the daily High temperatures. And that gap existed in 1960 when the airport opened, and it also existed in 1920 when records began at stations like Campsie and Calmar.
But we also saw that for very cold days the gap has increased by 2~3°C over the past century. So it would appear that nowadays, during deepfreezes Blatchford's Lows do get a bit of lift relative to the outlying stations. However, there are also outlying stations like Stony Plain which have temperatures pretty close to Edmonton's.
The moral of the story is that during a deepfreeze when see that Blatchford is 7~10°C warmer than the airport, on a similar day in 1960 that gap would have existed, but it might have only been 5~8°C? And going back to 1920 it might have been 4~7°C? What about 1880? Unfortunately we don't have the data to go all of the way back to see how a truly rural Edmonton compared to its rural surroundings.


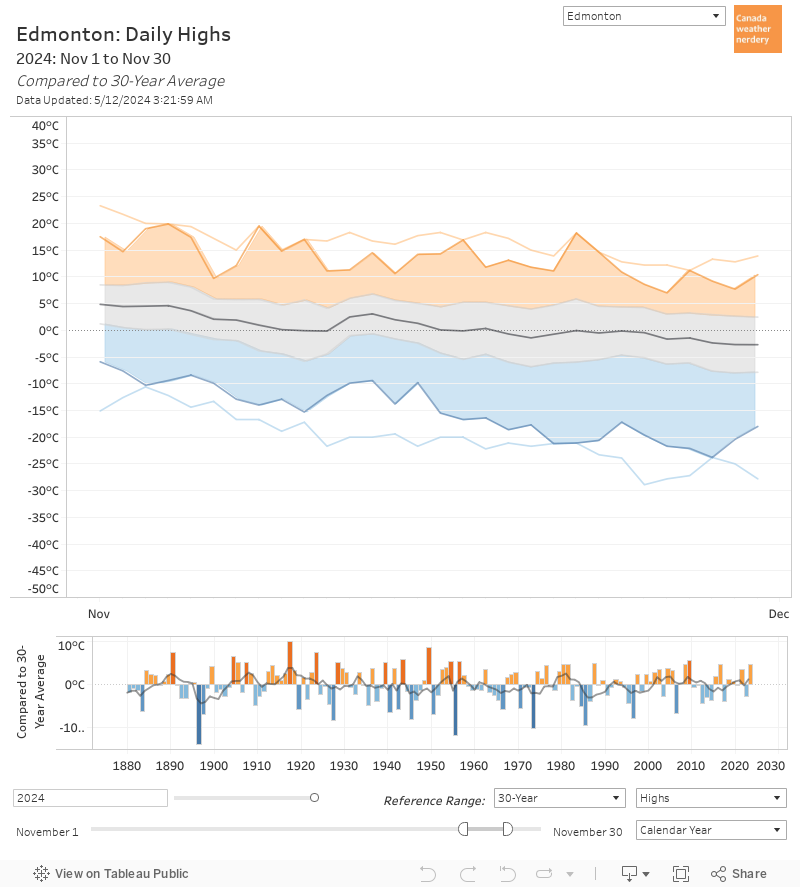
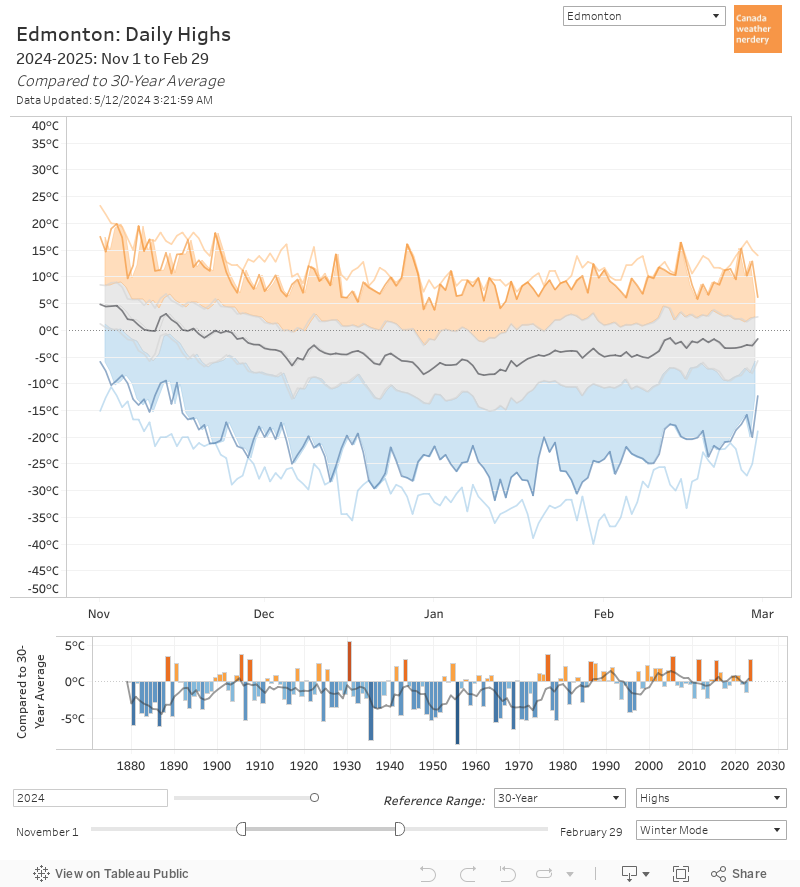
 On average in December we have around 10 Highs above freezing, but in 2021 we only had 4.
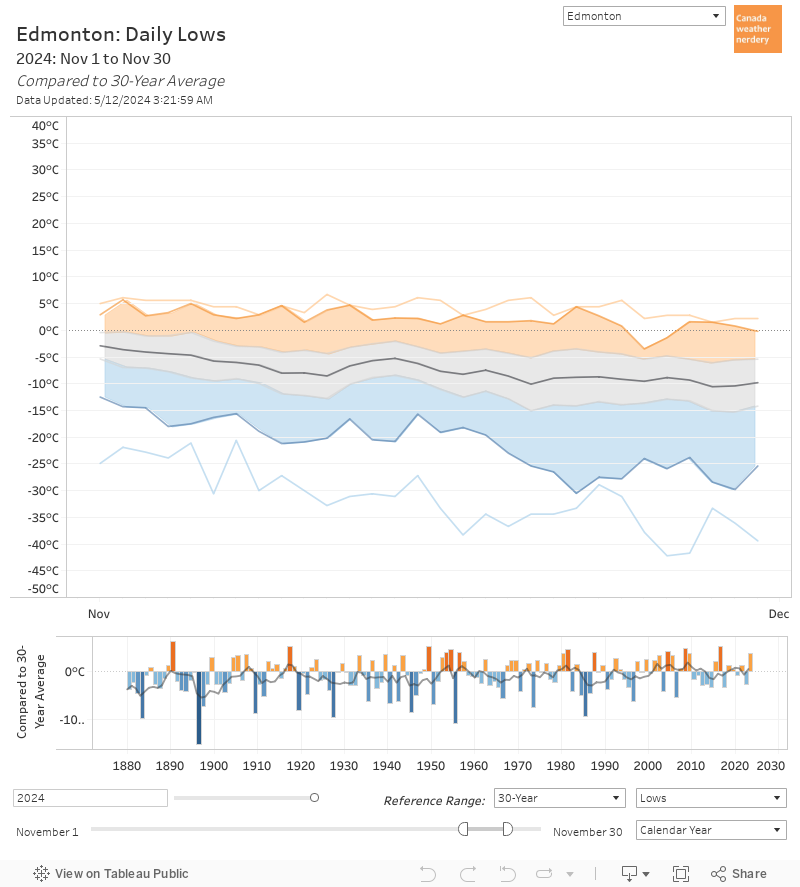
 December 2021's Lows looked a lot like the Highs, with a warm start, and extremely cold end.
  The average High for this December 2021 was 11.5°C, which ranks as the 14th coldest on record. The average Low of -18.2°C was the 33rd coldest.
 If we just look at the back half of December, from the 15th through 31st the average High of -18°C was 6th coldest.
The average Low for the back half of December was -24.5°C, and was the 12th coldest.
If we just look at the back half of December, from the 15th through 31st the average High of -18°C was 6th coldest.
The average Low for the back half of December was -24.5°C, and was the 12th coldest.
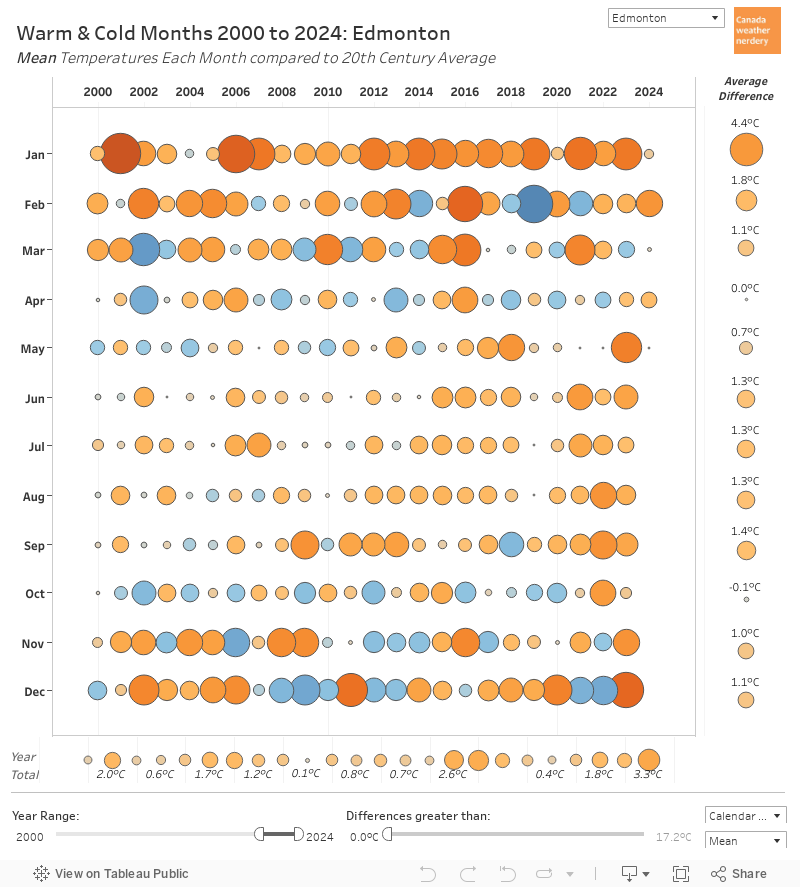
 Looking at the monthly mean temperatures (the average of the Highs & Lows) December & February were the only months in 2021 which were colder than the 20th century average.
And they were both around -4°C colder than the average.
Looking at the monthly mean temperatures (the average of the Highs & Lows) December & February were the only months in 2021 which were colder than the 20th century average.
And they were both around -4°C colder than the average.
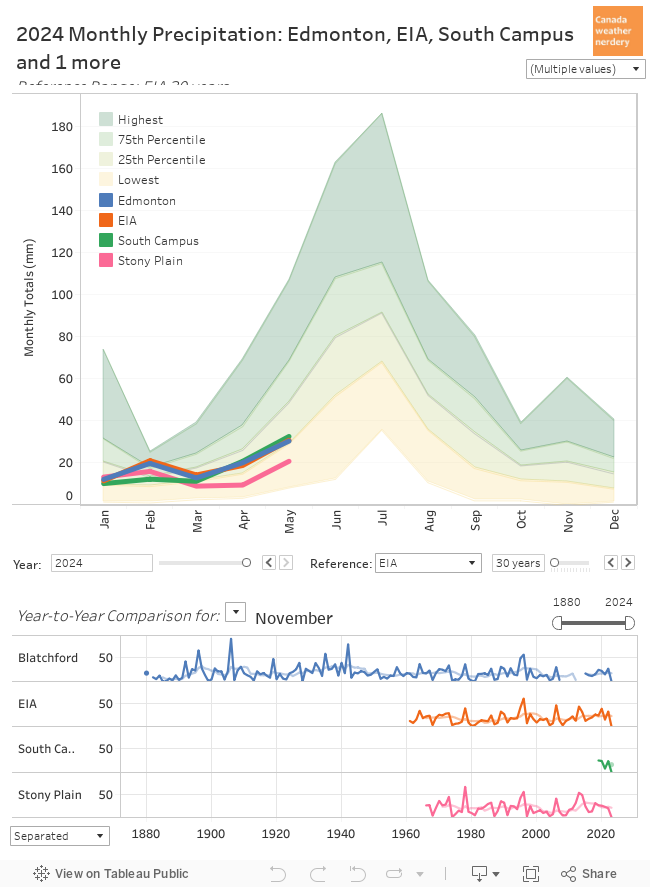
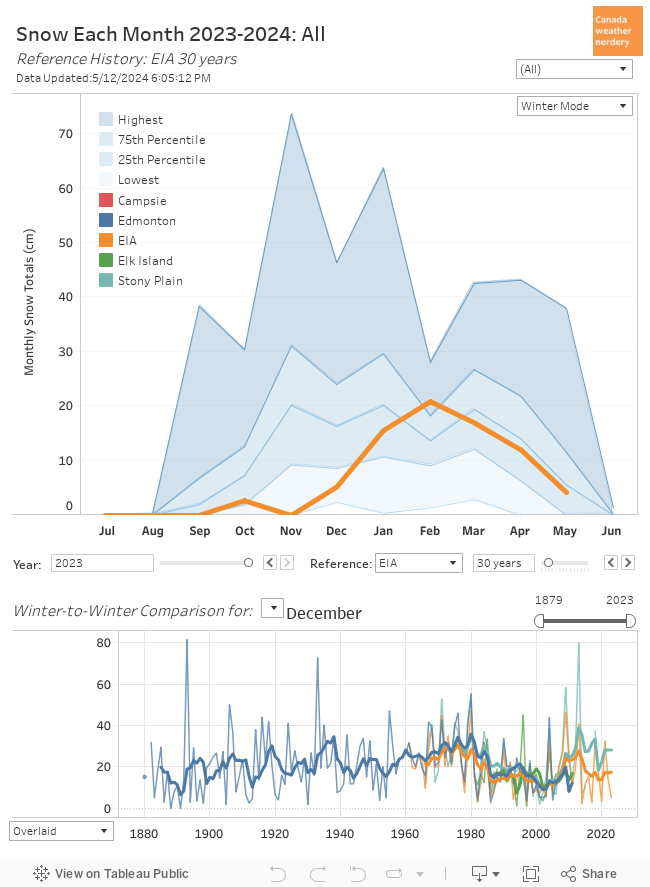
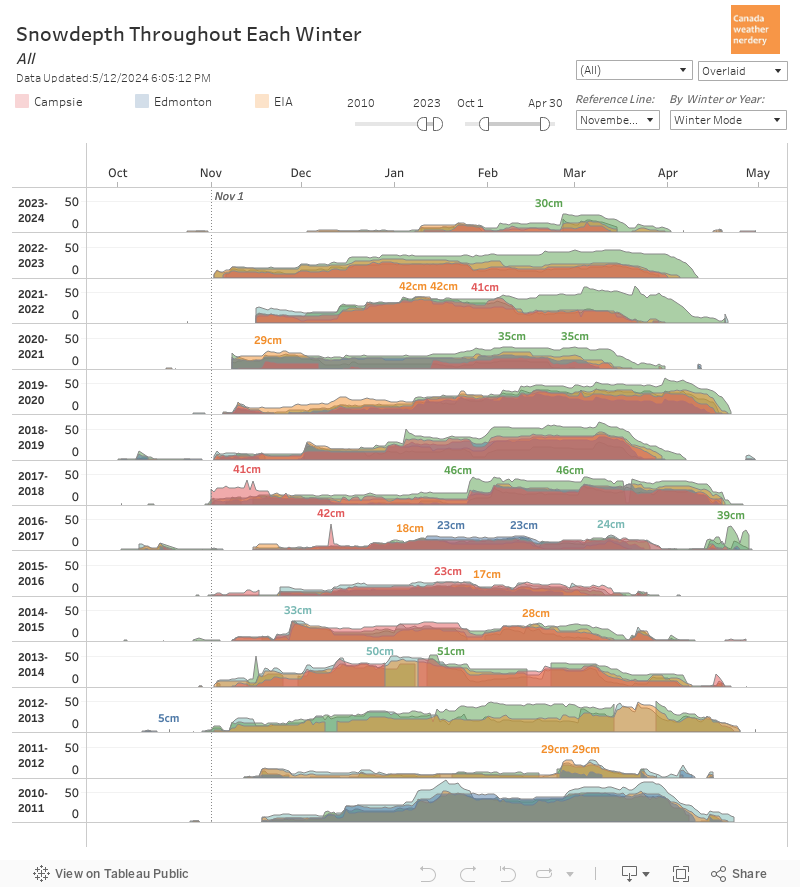
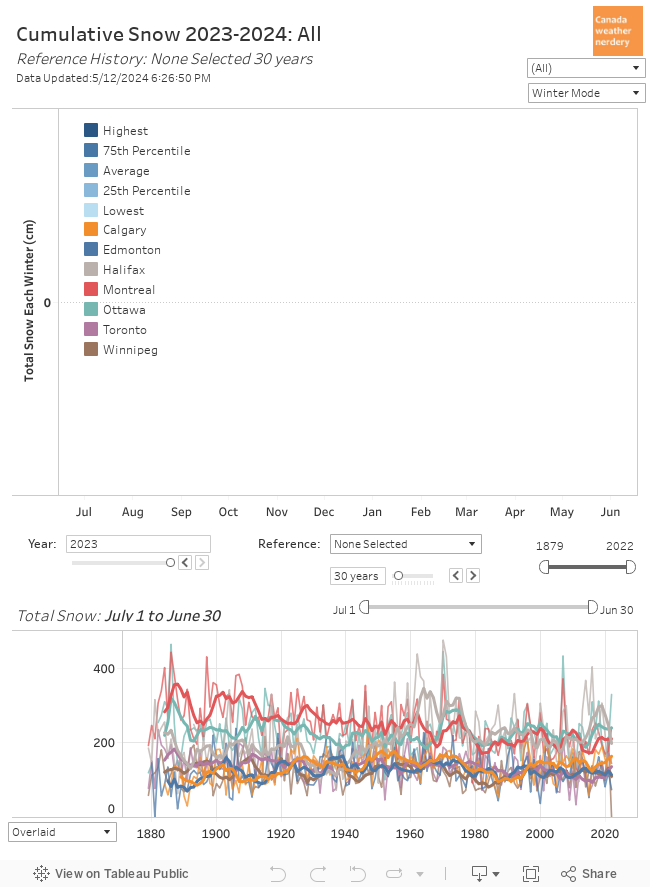
 In December we average about 16cm of snow, and 2021 was double that with 33cm at the Airport.
 In December we average 9 days with snowfall, and 2021 was just a bit above that with 11.
The biggest 1-day snowfall this month was 11.4cm on December 14th.
In December we average 9 days with snowfall, and 2021 was just a bit above that with 11.
The biggest 1-day snowfall this month was 11.4cm on December 14th.
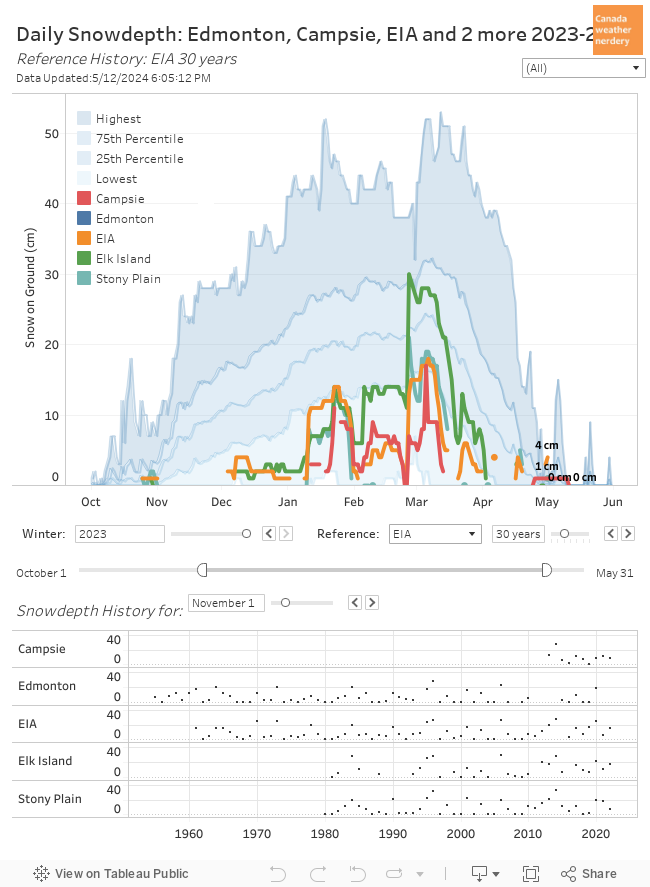
 Blatchford isn't recording snowdepth anymore, but the snowy and cold December pushed the snowdepth at the nearby stations up above 30cm, while the average for the end of December is only about 13cm.

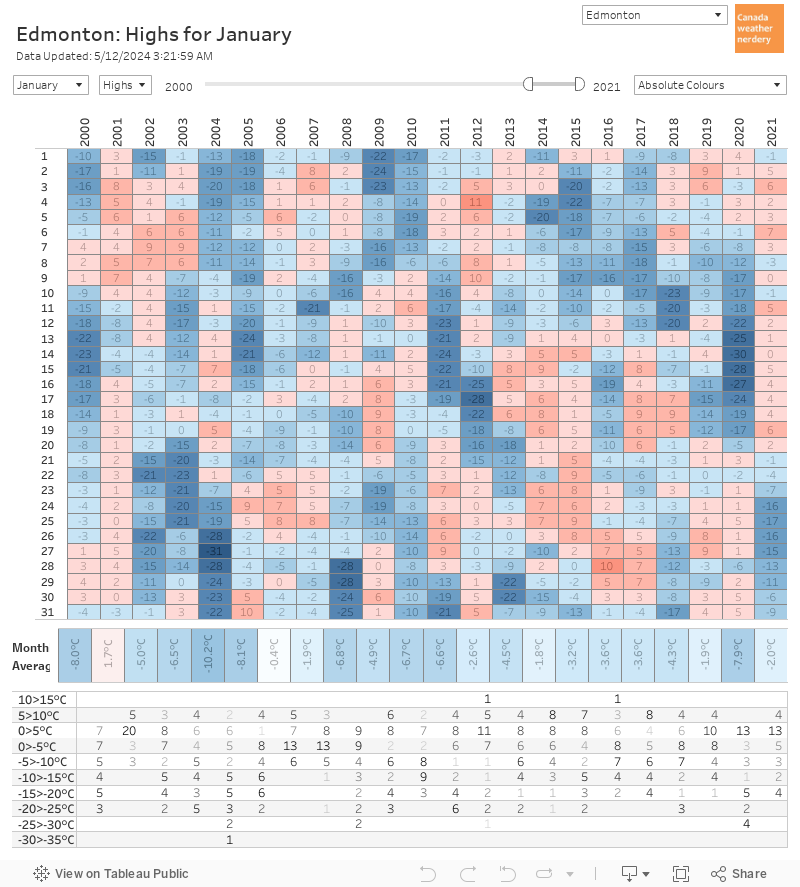
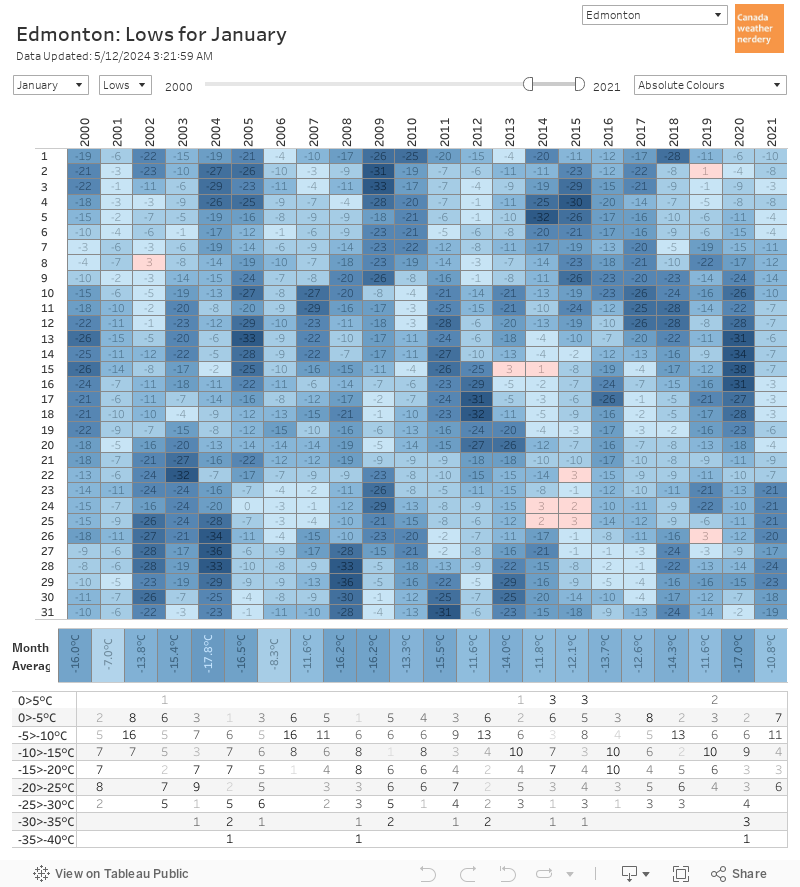
 In January on-average we get 12 days with Highs above freezing.
January is also our biggest month for deepfreezes though, with an average of 8 Lows of -20°C.
Our average snowfall for January is 22cm.
In January on-average we get 12 days with Highs above freezing.
January is also our biggest month for deepfreezes though, with an average of 8 Lows of -20°C.
Our average snowfall for January is 22cm.
 On average December only has around 6 Lows of -20°C.
In 2021 we had 14. 8 Lows hit -25°C, including 3 at -30°C.
Since 1990 the only Decembers to hit -35°C were 1992, 2009 and now 2021.
On average December only has around 6 Lows of -20°C.
In 2021 we had 14. 8 Lows hit -25°C, including 3 at -30°C.
Since 1990 the only Decembers to hit -35°C were 1992, 2009 and now 2021.