
High Temperatures

The first week of June was quite cold, and we set a record for coldest-since-1880 High on June 7th at 8.4°C.
Then things warmed up, and on the 12th and 17th we set two warmest-since-1996 Highs, although they were still well below the historic records.
The final two weeks were a little cool, with temperatures mostly hanging out a few degrees below average.

When we look at the numbers June had 4 Highs which hit 25°C, which is about average. 2018, 2016 & 2015 all had really warm Junes, with more than 10 25°C days, but 3-5 is pretty typical.
We also had 17 days which hit 20°C, which is just a little on the low side. 2015-2018 again all had more than 20 20°C days, which was a lot, but 2019 broke that streak.
June 2019 had 1 High below 10°C, with June 7th only hitting 8.4°C. In the last 20 years only 2013, 2003 & 2000 had Highs below 10°C. 2019 also had 3 Highs below 15°C, and that is on the high side of things. In recent years only 2000 and 2003 had more with 5 and 6 respectively.
Low Temperatures

For the Low temperatures we hit two warmest-since-1880 Lows on June 12th at 15.2°C (which tied the old record), and on June 13th at 15.8°C. And then June 7th & 10th were coldest-since-1996 Lows.
We see the same pattern here that the Highs had, with a cold first week, then a warm week, and then temperatures a bit below average to finish the month.

June 2019 had 4 Lows below 5°C, which is more than average. In the last 20 years only 2009 had more with 5. It also had 2 Lows above 15°C though (the two records), and half of the time June doesn't have any.
Warm & Cold Months

When we add up all of the Highs & Lows June 2019's average temperature was 14.9°C. The 20th century average for June is 14.7°C, so 2019 just snuck in above average as Edmonton's 67th warmest out of 138.
The average High of 20.3°C was actually below average, and was only Edmonton's 88th warmest. And the average Low of 9.8°C was above average and was Edmonton's 38th warmest.
Over the past century the average Highs for June have stayed quite constant at around 21°C, but the average Lows have increased from 7°C to 10°C. We looked at how the various months have changed in The Months through the Years.

Looking back over the last year 12 months December and January were very warm, and September and February were very cold. The rest of the months were fairly close to the 20th century average, and June was the most average of all.

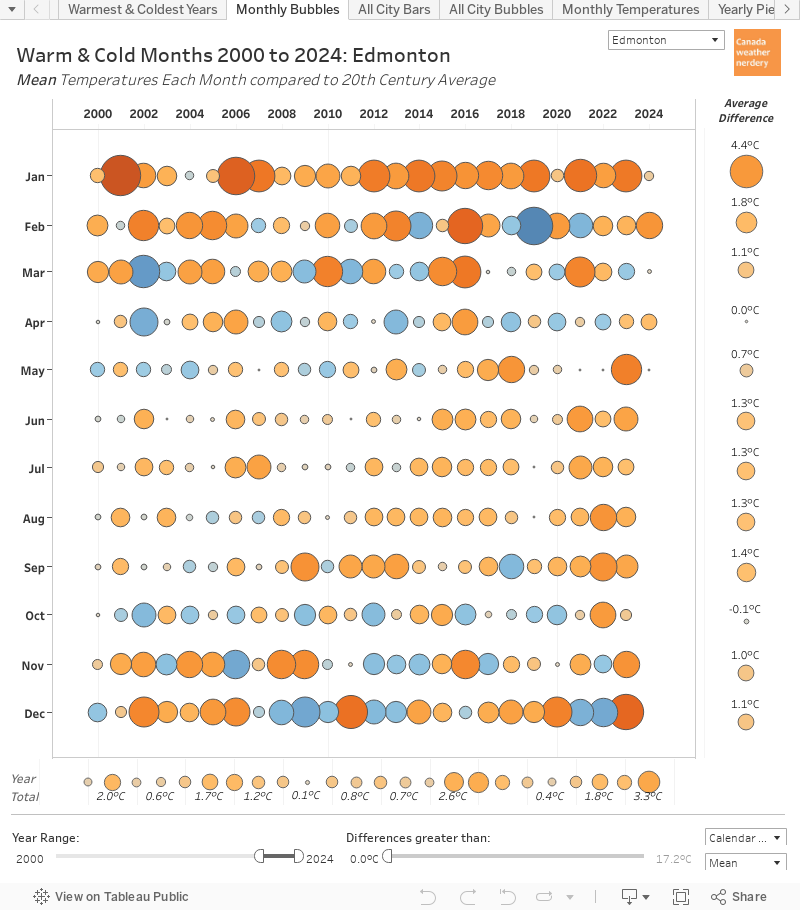
With all of the months for the past 20 years we can see that 2015-2018 had a lot of warm Mays and Junes. 2019 ended that warm streak though, with a very average May and June.
And for something new, here's an interactive version of the bubble chart. The sliders at the bottom let you select the range of years from 1880-2019, and the months with the largest differences:
How Warm is 2019 So Far?

So how warm is 2019?
For a full explanation of this chart it's easiest to refer back to the original discussion of it in How warm is it? Generally though, it tracks how much warmer each day of the year was compared to the 20th century average - warm days get points and cold days lose them. The blue and orange background is the range of all the years going back to 1881, and they are grouped together like that because showing each individual year gets too messy. To keep things simple the last 10 years are shown here as a reference.
When we look at all of the daily temperatures right now 2019 is sitting just above the 20th century average. Compared to recent years it is above where 2009, 2011 & 2014 were at the mid-point of the year, but it is below all of the others.
The red line for 2019 starts out strong with the warm January, but then the very cold February dropped it below the 20th century average. The warmish March pushed things back up again, and since then things have been pretty flat.
Monthly Precipitation

June 2019 felt like the rainiest month ever, which was not exactly true. Edmonton's precipitation always ramps up in June and July, and this June was fairly rainy, but it was not extreme.
The International received 86mm, which is just a bit above the average of 72mm, and a bit above the 76mm from 2018.
Blatchford was quite a bit higher at 117mm, which is above average and above the 75th percentile for June. It was also Blatchford's most rainy month since June 2013, which had 118mm. And it was more rainy than any month at the International going back to 2011, which had 150mm. So Blatchford did get a lot of rain, but the rainiest "recent" Junes were 1998 with 162mm at the International, and 1997 with 136mm.
For both stations June was the first above-average month since February.

In terms of days which record precipitation, the International had 18 and Blatchford had 16. The average for June is 14 days, so this month was a little gloomier than is typical.
Precipitation So Far

June was a little rainier than normal, and March-May were all below average, so overall 2019 is still sitting on the drier side of things.
So far the International has recorded 159.8mm, and Blatchford has a little bit more at 164.1mm. That is below average, and right around the 25th percentile.

Even though June was fairly rainy, the International didn't get any giant storms. Its rainiest day was June 7th, with 14.7mm. Blatchford (which isn't included in this chart) had two big days with 24.6mm on June 19th and 23.1mm on the 20th.
July Temperatures


The past few years had warm Mays and Junes, so summer felt like it started early. But 2019 broke that pattern, and so July is where things to start...and where it will also start to end. Right now it feels like summer has barely even begun, but the unfortunate fact is that mid-late July is when our temperatures start trending downward again.


