2017/06/30

Canada Day

Canada Day Temperatures

Here we can see the historic records for Canada Day, with 1924 well above any of the other years. At 35.6°C, July 1 1924 was actually the 3rd warmest day ever recorded in Edmonton. (Edmonton's 2nd warmest was the next day: July 2, 1924 at 36.7°C. And the warmest-ever was 37.2°C on June 29, 1937)

In recent years the average High for Canada Day has been 22°C, with 2013 the warmest at 28.8°C, and 2011, 2010 and 1999 down around 19°C. Plenty of years have been around 25°C, but only four actually broke that barrier: 2006, 2013, 2013 and 2014.

Canada Day Precipitation

And here we have Canada Day precipitation, with data from Blatchford and the International Airport. Since 2000 only 6 Canada Day's have had any precipitation, and 2012 was the only large amount with 14mm at Blatchford and 7.2mm at the International.

2017/06/15

Edmonton's Temperature Landscape

Nothing too complicated today - we're just going to take a look at this animation, which I've been using snippets of for the past few months:


What this shows is the High temperatures for all of the days each month, for 1996-2016.
(it actually only goes to the 29th of each month, because otherwise it wouldn't animate as nicely).

In these landscapes, the "warmer" the colour is, the warmer the corresponding temperature. There is a lot going on, but I think it gives a sense of how the overall temperatures shift as we move throughout the year.

If you want to take a closer look at any of the months individually, the images are all here.

To make a bit more sense of this it's easiest to compare the extremes:

January & July

In Edmonton our temperatures warm up until mid-July (roughly July 22) and then they start trending downward and bottom out somewhere in early-to-mid-January. So here we're flipping back and forth between the two.

Not surprisingly, the July temperatures are much warmer. The average High in January is about -6°C, compared to 24°C for July. So for July the whole landscape is shifted up by an average of about 30°C, and the colours are much warmer.

The July landscape is also much more level and consistent than January's. In January there are deep valleys in blue for our coldsnaps, and beige-y peaks for the chinooks. The July landscape is comparatively quite flat, which goes back to something that we saw a few weeks ago when we talked about averages - our range of temperatures is much smaller in the summer than it is in the winter.

Temperature Range

We can see those differences here, with the range of possible temperatures in January being about twice as large as the range in July. And when we'd looked at averages in detail we saw something similar: during the summer our temperatures will be within ±8°C of the average about 95% of the time, but for winter that 95% range is ±18°C.

June

Right now we're in the middle of June, where the landscape is pretty similar to July, and is pretty flat. 2017 isn't shown here, but so far this month our average high has been 22°C, swinging from a warm 27.9°C on the 7th to a cold 15.7°C on the 11th.

And that's about it for today.

Just to end things off, here's the same animation again, but this time at super-speed:


2017/06/01

May Review / June Preview

At this time last year I talked about how warm May 2016 was, but May 2017 topped it.

May High Temperatures

Does anyone remember April? April was not warm. But once we hit May the temperatures took off.

We had one all-time record on May 5 at 28.9°C, and then six other recent-records, including May 30 and May 31. And the International also had an all-time record on May 31st, at 31.2°C (but those records only goes back to the 1960s)

We were above average for most of the month, except for a few rainy days from the 13th through 17th.


Our average High this month was 20.5°C, which is the 2nd-warmest of recent years, coming in just behind 1998 at 21.2°C.

Compared to other recent years, we also had the 2nd-most days above 20°C at 18, and the most days above 25°C at 7. And we even managed one day above 30°C, on the last day of the month.

When we get a genuinely hot day in May it always feels like a surprise. In reality though, it's pretty typical to get at least a day or two above 25°C - since 1998 there were only 5 times that May didn't break 25°C. And then on the flipside, since 1998 there were 5 Mays that broke 30°C.

One other thing to notice is that in each of the last 3 years we've had almost a week of days above 25°C, which is well above the average, and makes it feel like summer has started a little early.

May Low Temperatures

The Lows were pretty similar to the highs: 1 all-time record on May 5, and then 5 other recent-records later in the month.


The average Low for this month was 7.5°C, again coming in a bit below 8.5°C for 1998. And we didn't have any Lows below freezing, which had only happened 5 other times since 1998.

Precipitation

This May there were 8 days with recorded precipitation, which is a little below the average for May, and half of what we just saw in April.

We also had a snow-free May this year, which only happens a little less than half of the time.


In terms of precipitation totals, with 71.7mm we were above the recent May average and right at the 75th percentile. More than half of that fell during a single day though, with 44.6m on the very rainy May 24th. These numbers are from the International Airport, and inside the city at Blatchford there was only 55.5mm recorded this month, with 32.4mm of that during the May 24th storm.

In this chart there's also a line for 2016, as a reference. Last year we had a very dry April, a very rainy May, and then a pretty average June and July.
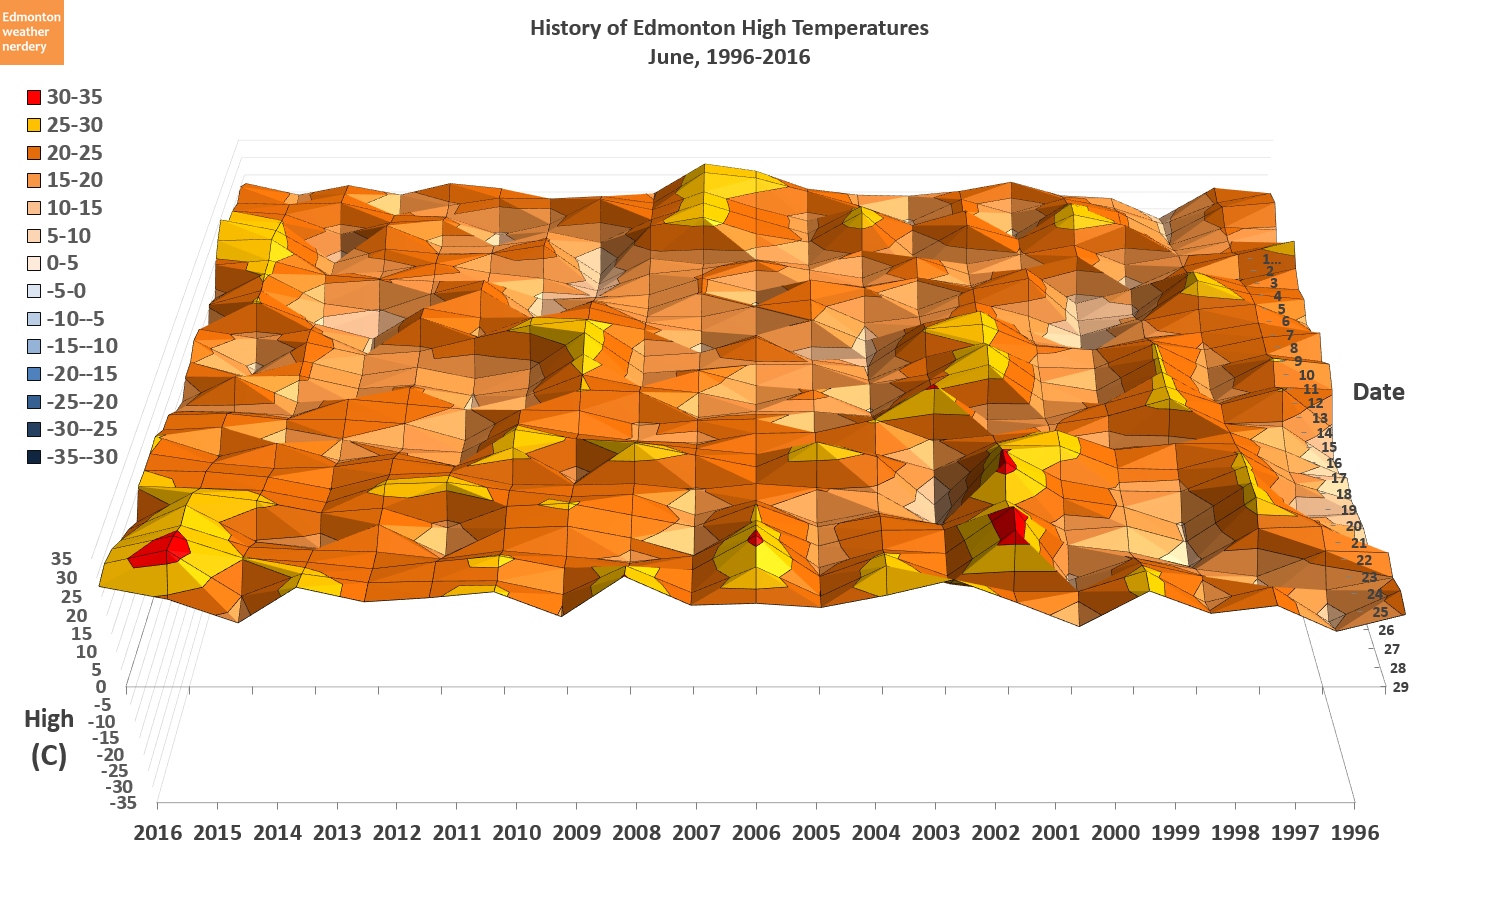
June Temperatures

Before I started this blog, I had always had the impression that June was often cold. I don't know where I got that impression though, because it's really not the case. The coldest High since 1998 was 8°C in 2000, and in the past 19 years there have only been 2 other June days which didn't break 10°C. And for Lows, the coldest June day here dropped to 2°C, while only about half of these years had any Lows below 5°C.

So as we head into June our temperatures will typically be pretty similar to what we just saw this May. And that might actually be why I think of June as cold - if we get a below-average June this year that might seem cold compared to the warm May that we just had.

But in a typical June about half of the month is above 20°C, with maybe a week's worth of days above 25°C. There are some warm Junes like last year with 13 days above 25°C, and cooler ones like 2011 with only 1. And the average rainfall for June is 73mm, which is very similar to what we just had in May.