Showing posts with label River. Show all posts

2023/07/01

June 2023 Review

It's time for our big look back at Edmonton's pretty warm weather for June 2023.

June 2023's average High of 23.7°C was our 7th warmest on record. It was behind the record 24.9°C from the 2021 heatdome, but ahead of 2022, and 2016-2020. 

The average Low of 12.8°C was our 2nd warmest on record, behind only 13.0°C from the 2021 heatdome.


High Temperatures

The heat from May 2023 carried into June, with new record Highs of 30.8°C on the 9th, and 31.9°C on the 13th.

Then we had a cold, rainy week, and on June 20th we set a record for coldest-High of 11.1°C. 

June ended up with 9 days below average, and 21 above.
In June we average about 5 Highs which reach 25°C. In 2023 we had 14, including 2 which reached 30°C. We also had 3 Highs below 15°C, which is about average.


Hot Days

At the end of June we've had 47 days reach 20°C, which is 6th most on record. The average is around 37.

That includes 26 days which reached 25°C, which is the most on record. and is more than many years (2020 & 2020) get in an entire summer.

At the end of June we've had 15 Highs reach 28°C, which is the most on record.

For 30°C days so far we've had 4. Recently 2021 had 6 by this point, and 1912 has the record with 9.


Low Temperatures

For the Lows, we set new warmest-Low records on the 9th, 10th and 12th. That was followed by a pretty cool week, and then we were above average to close the month.

Overall 9 Lows were below average and 21 were above.

June 2023 had our 2nd warmest Lows on record behind 2021, and so there were a lot of warm nights. We had 12 Lows above 15°C, when the average is 2.


Final Frost
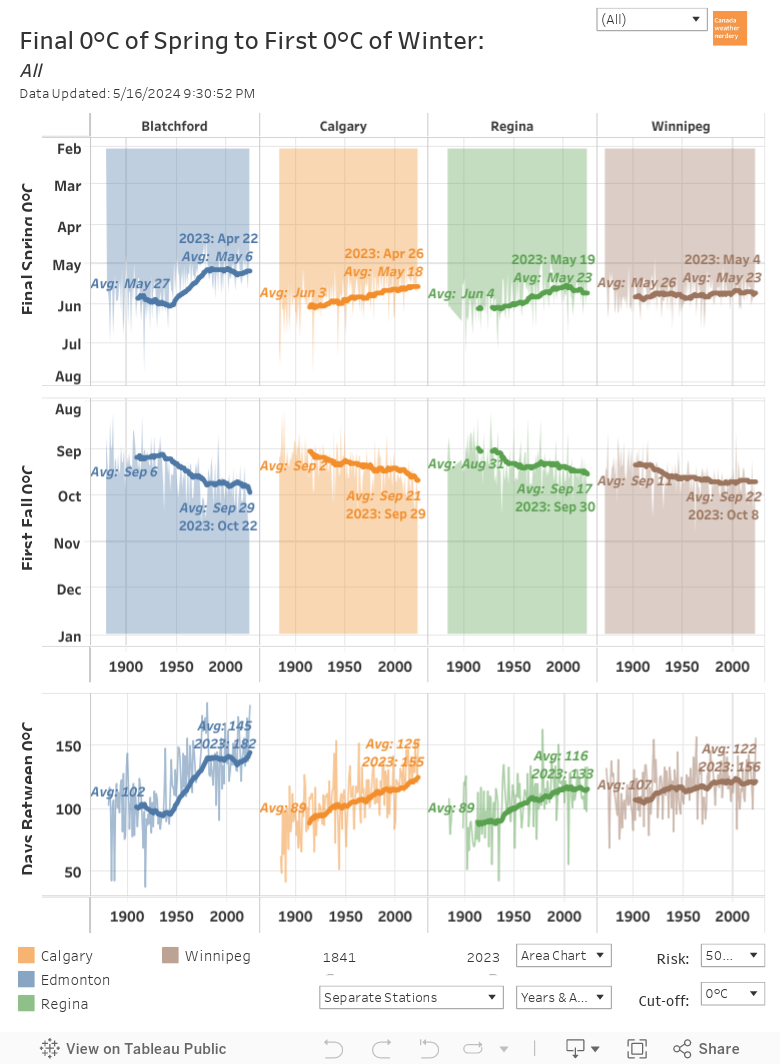
Blatchford's final frost was way back on April 22nd, which was pretty early.

Calgary's final frost on April 26th set a new record for them.

Saskatoon's April 30th and Winnipeg's May 4th were both pretty early for them.

Regina's May 19th was typical.

Closer to home, the airport's final frost on April 29th set a new record there.

Stony Plain's April 26th was pretty early.

And Campsie's May 18th was typical for recent years, but would have been very early a few decades ago.


Warm & Cold Months
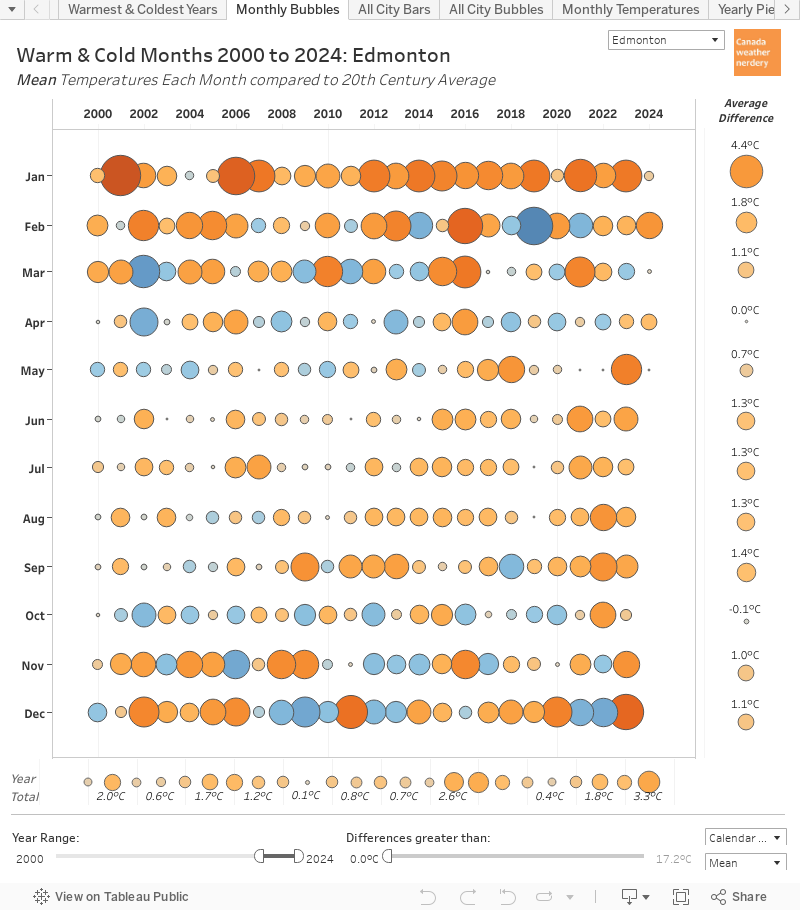
June 2023's High was 3°C warmer than the 20th century average, so here it is a medium-sized orange bubble. We've had lots of warm Junes recently, with a few cooler ones spread around. The Low was 4.2°C above average, and joins many orange bubbles in recent years.


Across Canada
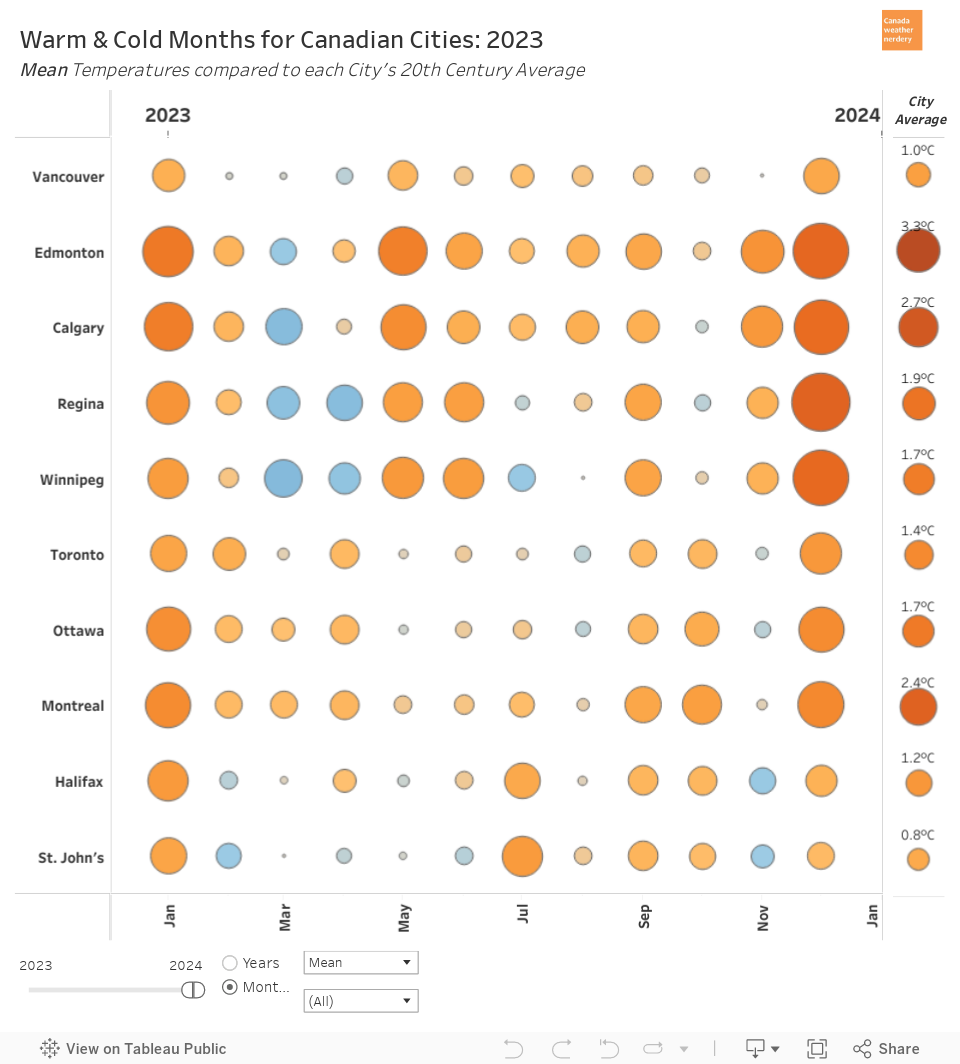
Across the country June 2023 was well above average in the west, especially in Saskatchewan and Manitoba at 4°C above their 20th century average. Central Canada was closer to average.

June 2023's temperatures ranked in the top-5 or top-10 across the western cities.


The Horserace
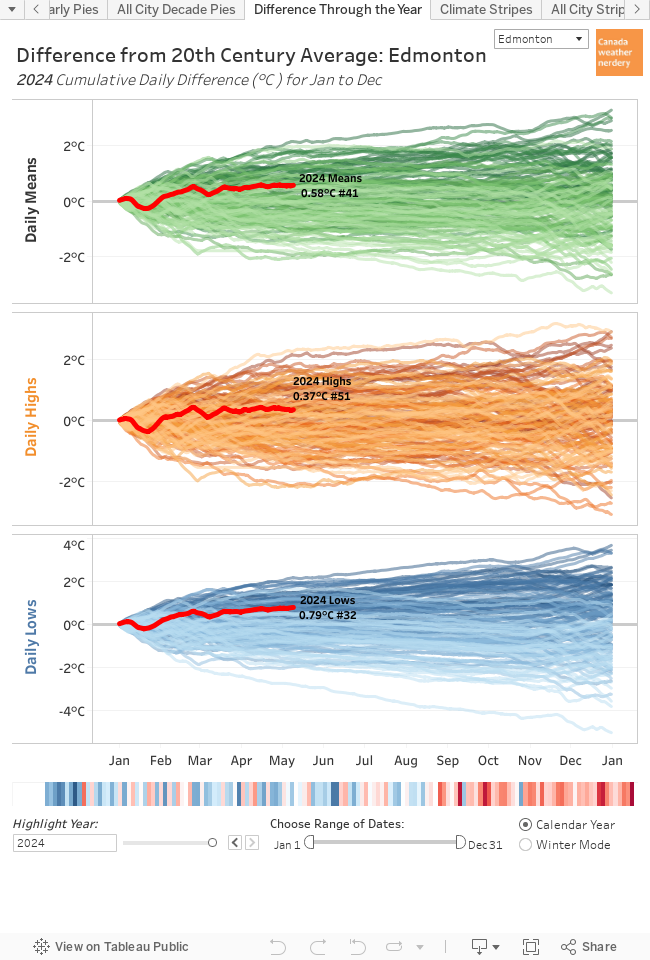
We're 6 months into the year, and after the warm May & June 2023 ranks as Edmonton's 10th warmest year on record, with an overall temperature 1.5°C above our 20th century average. The Highs are a little cooler at 13th spot, and the Lows are in 9th spot.

For 2023's average Highs, so far Edmonton, Toronto, Ottawa, Montréal & Halifax are all having a top-15 year. For Lows Edmonton, Calgary, Ottawa & Halifax are having a top-20 year.


Precipitation
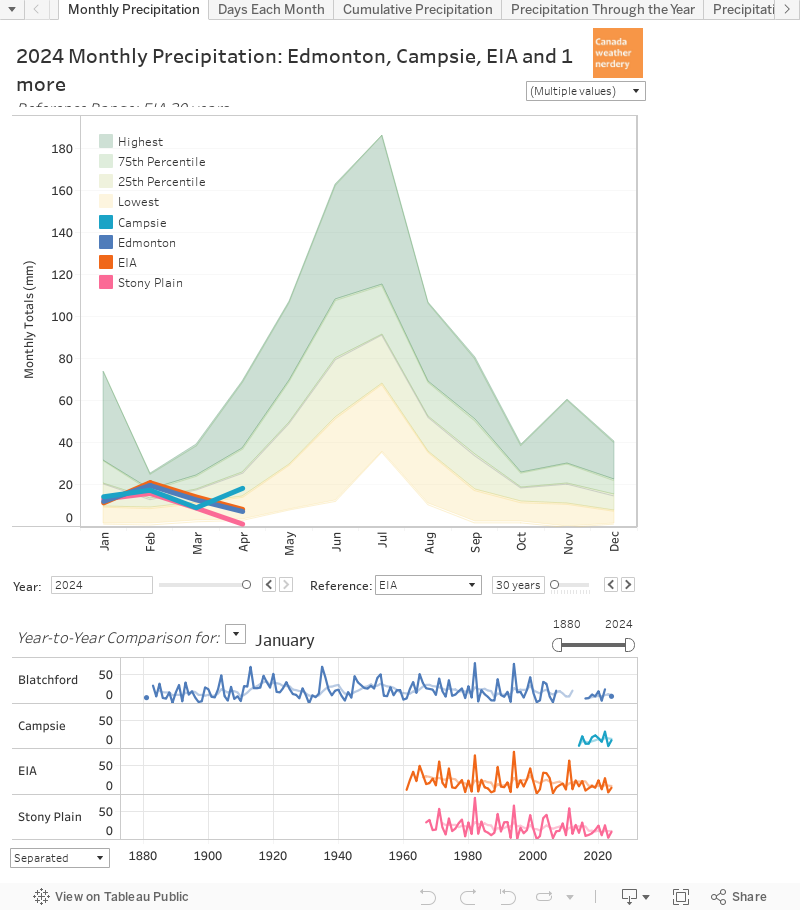
In June we average 80mm of precipitation. All of the local stations were above that, and Blatchford was in the lead with 150.3mm, for its 8th rainiest June on record. The airport had 139mm, and Stony Plain had 115mm.
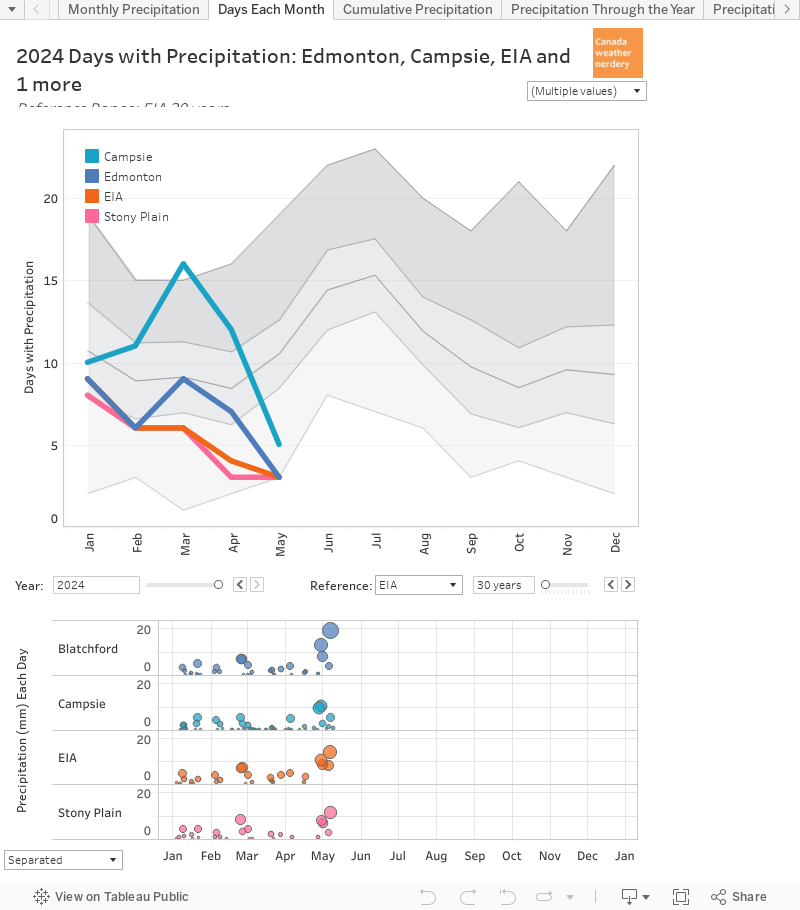
In June we average around 14 rainy days. 

June 2023 had lots of rain, but number of rainy days was actually pretty low, with most stations down around 10 or 11.
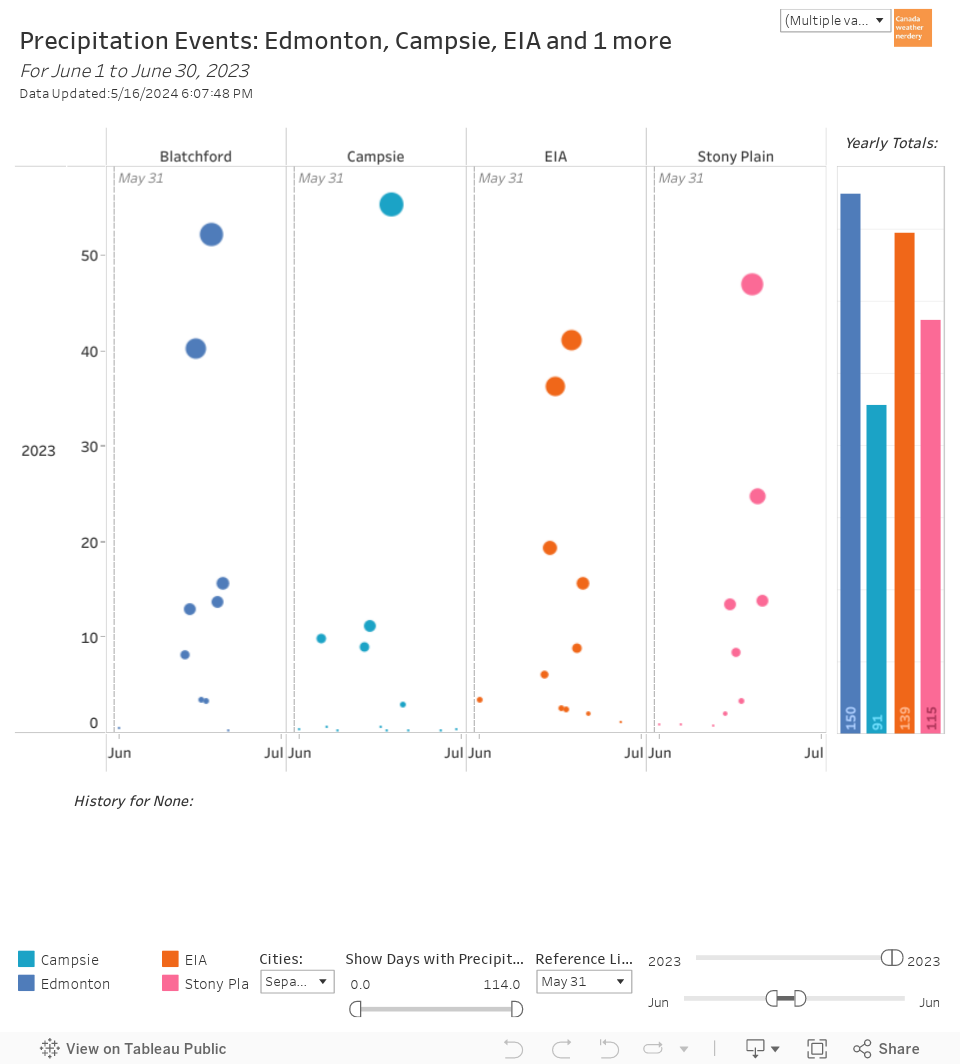
We usually get some big summer storms in June, and 2023 was no exception.

Blatchford got 52mm on the 18th, and 40mm on the 15th. The airport's biggest storm was 41mm on the 18th, and Stony Plain got 47mm.

By the end of June we average 206mm of precipitation for the year.

After a very dry start to 2023, all of the rain in June pushed us up to around average, with 214mm at Stony Plain, 203mm at Blatchford, and 194mm at the airport.


The June 2023 Mini-Flood
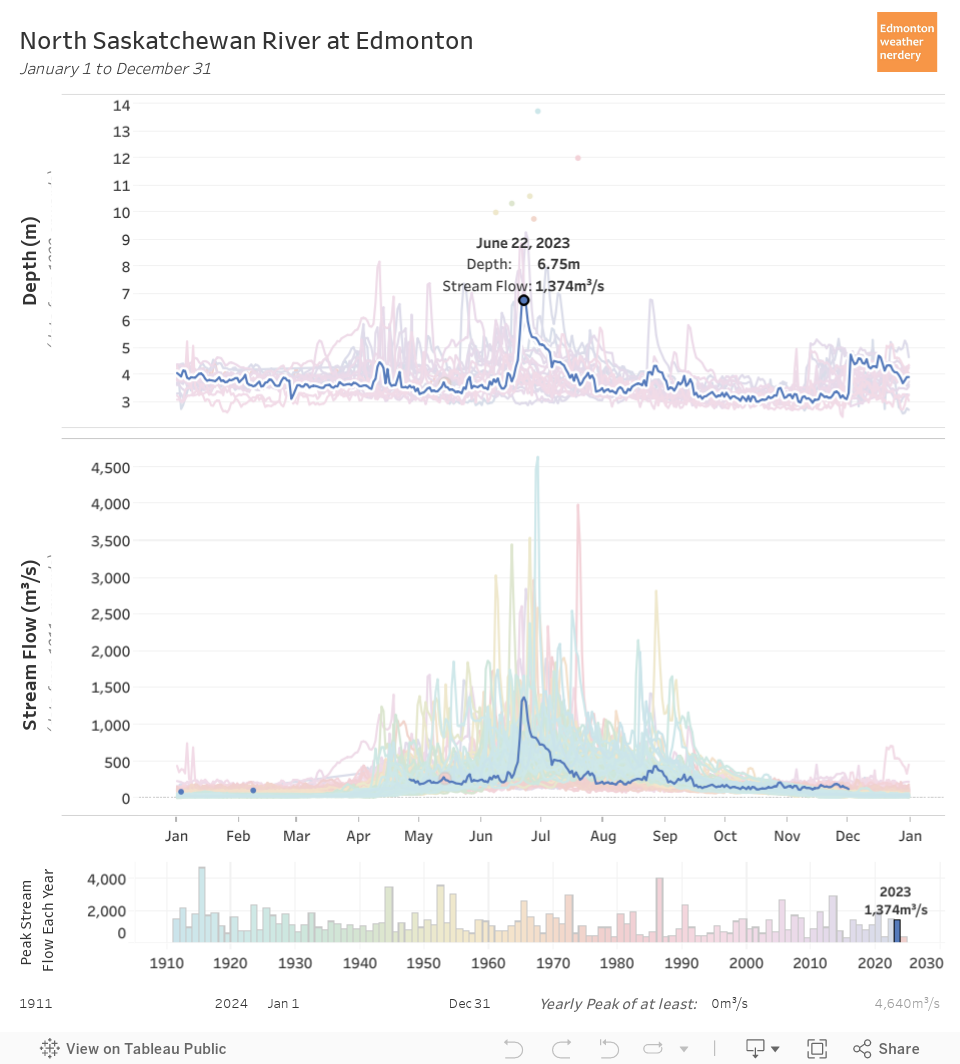
With the June storms the river did have a mini-flood on June 22rd, reaching 6.75m and 1,374m3/s.

In recent years 2022 got to 1,454m3/s, 2020 was 1,899m3/s, and 2013 reached 2,847m3/s.


Precipitation Across Canada

This chart has the precipitation for 2023 for these 11 Canadian cities. 

Halifax and St. John's are at the top, with over 600mm. Central Canada and Vancouver are from 300-500mm. And the prairie cities are down below around 200mm.

For 2023 precipitation so far 2023 Toronto is having a top-10 year, Vancouver is having a bottom-10(ish) year, and Winnipeg is having one of its lowest years on record (which doesn't appear to be a measurement error?).
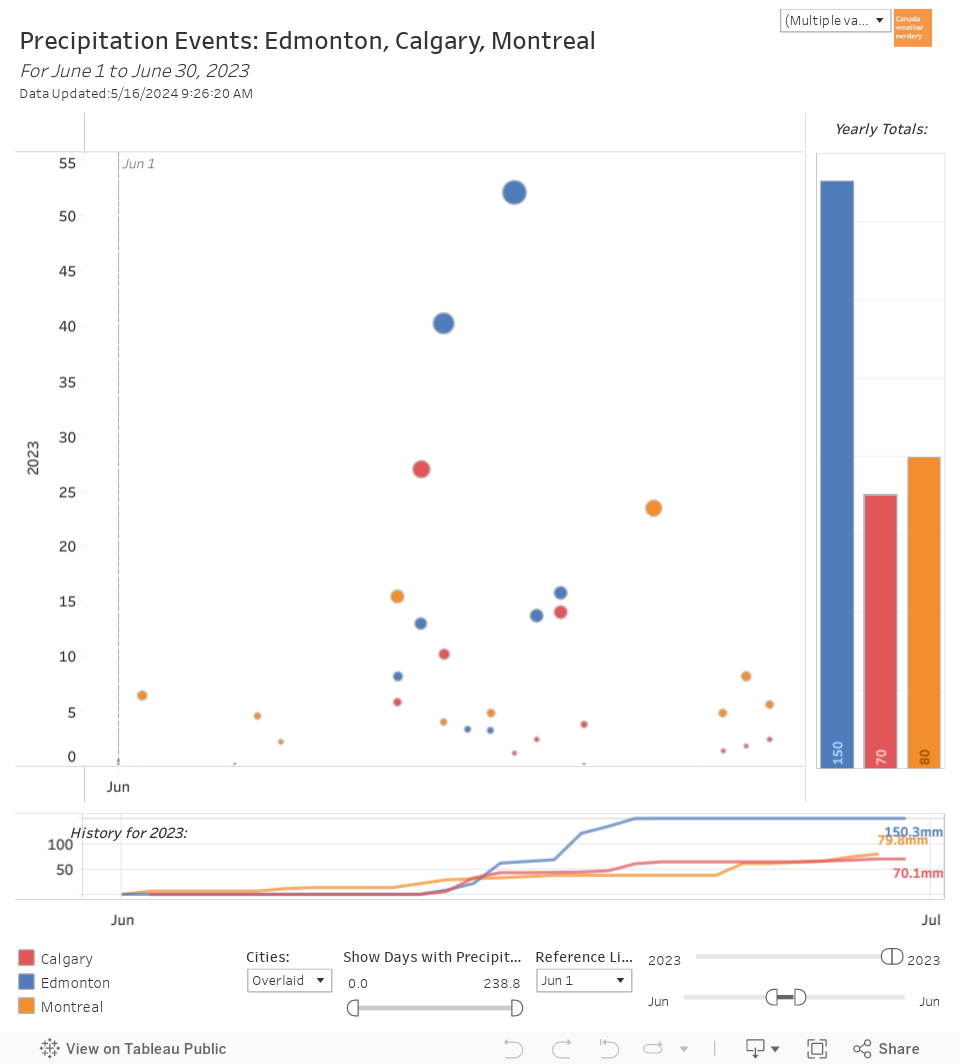
For June 2023 precipitation Halifax and Edmonton were the big winners with 214mm and 150mm.

The biggest storm was Edmonton's 52mm, but Halifax, St. John's, Regina and Toronto all had 30mm+ days.


July
For July, the average High is about 23.5°C. It has around 25 days reach 20°C, including about 10 at 25°C. Most July's will get at least one 30°C day, but recently 2020, 2019 and 2016 didn't. July is also usually our rainiest month, with an average of 90mm.

2020/07/04

July 2020 Mini-Flood

With the recent rain there was some excitement on the North Saskatchewan this weekend:


On July 3rd the river peaked at a depth of 7.95m and a streamflow of 1,899m³/s. Just a few days earlier on June 30th it had been in a more normal range for this time of year at 5.1m and 635m³/s. So in 3 days the depth jumped by nearly 3m, and the streamflow tripled.


1,890m³/s+
With a peak of 1,899m³/s we didn't hit the 1,900m³/s mark. But since records began in 1911 on 16 years broke 1,890m³/s. Recently that included:
  • June 24, 2013 was way up at 2,847m³/s and 9.25m.
  • June 20, 2011 hit 1,897m³/s and 7.88m
  • June 21, 2005 hit 2,612m³/s and 8.85m

The Biggest Floods 
This chart shows the largest recorded floods. Detailed depth measurement only started in 1999, which is why there is less history for the blue lines compared to the green:
  • 1915 at 4,460m³/s and 13.73m
  • 1986 at 3,990m³/s and 12m
  • 1952 at 3,540m³/s and 10.59m

The 3-Day Rule?
The upper part of this chart compares the peaks of Edmonton's various big floods, and it shows what the streamflow was in the days just before and just after. (the lower part shows the rate of change from day to day).

For some reason, all of Edmonton's floods took 3 days or less to peak. 3 days before the levels were all in the normal~ish range of 800m³/s or less, then the big increases happened over 3 days, and on day 4 the numbers had started to drop. After a flood it usually takes a week or more for the levels to return to the normal range again.

None of these floods saw the levels jump up, then take a break or drop a bit, and then start climbing again to a new peak. It has always been a sudden ramp-up over 3 days, followed by a slower drop.

This "rule" isn't written in stone, because theoretically if a series of storms hit the province that could just keep adding more and more water into the system. But so far all of the major floods since 1911 have followed the 3-day rule.

2020/05/25

May 2020 Mini-Flood

On the weekend there were warnings to stay clear of the North Saskatchewan, because the big rain from last week was leading to a big increase in water.

Recent History
Here we the river depth and streamflow going back to 2015, and every spring/summer there are spikes.

This one was a fairly large one though, with the depth jumping from 4m on May 19th up to 7.6m on the 23rd. Along with that the streamflow increased by about 6x from 350m³/s up to 1,811m³/s.


1911+
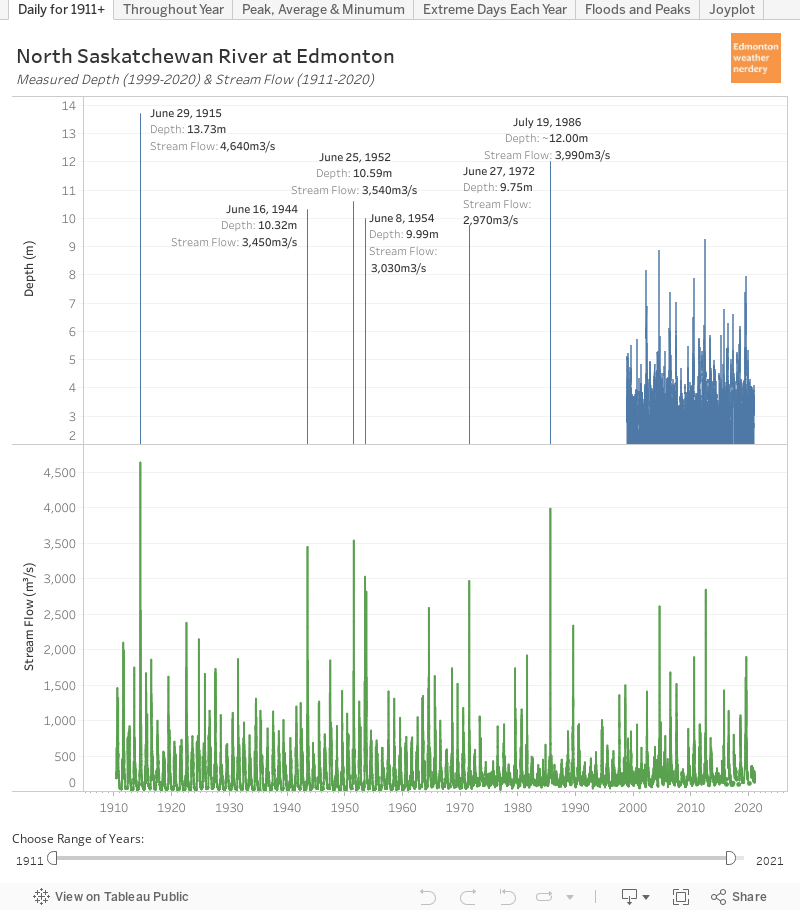
For a bit more context here we have the full recorded history. Streamflow readings go all the way back to 1911, but unfortunately daily depth measurements only go back to 1999 (although some of the notable floods are also shown).

May 2020's 7.63m was well below the biggest floods. The great flood of June 29, 1915 was way up a 13.73m, July 19, 1986 was around 12m, and 4 other floods were close to the 10m mark.

And recently the mini-floods of 2013 reached 9.25m, 2005 hit 8.85m, 2003 hit 8.17m, and 2011 hit 7.82m.

So May 2020's mini-flood was a lot of water, but not all that unusual.


During the Year
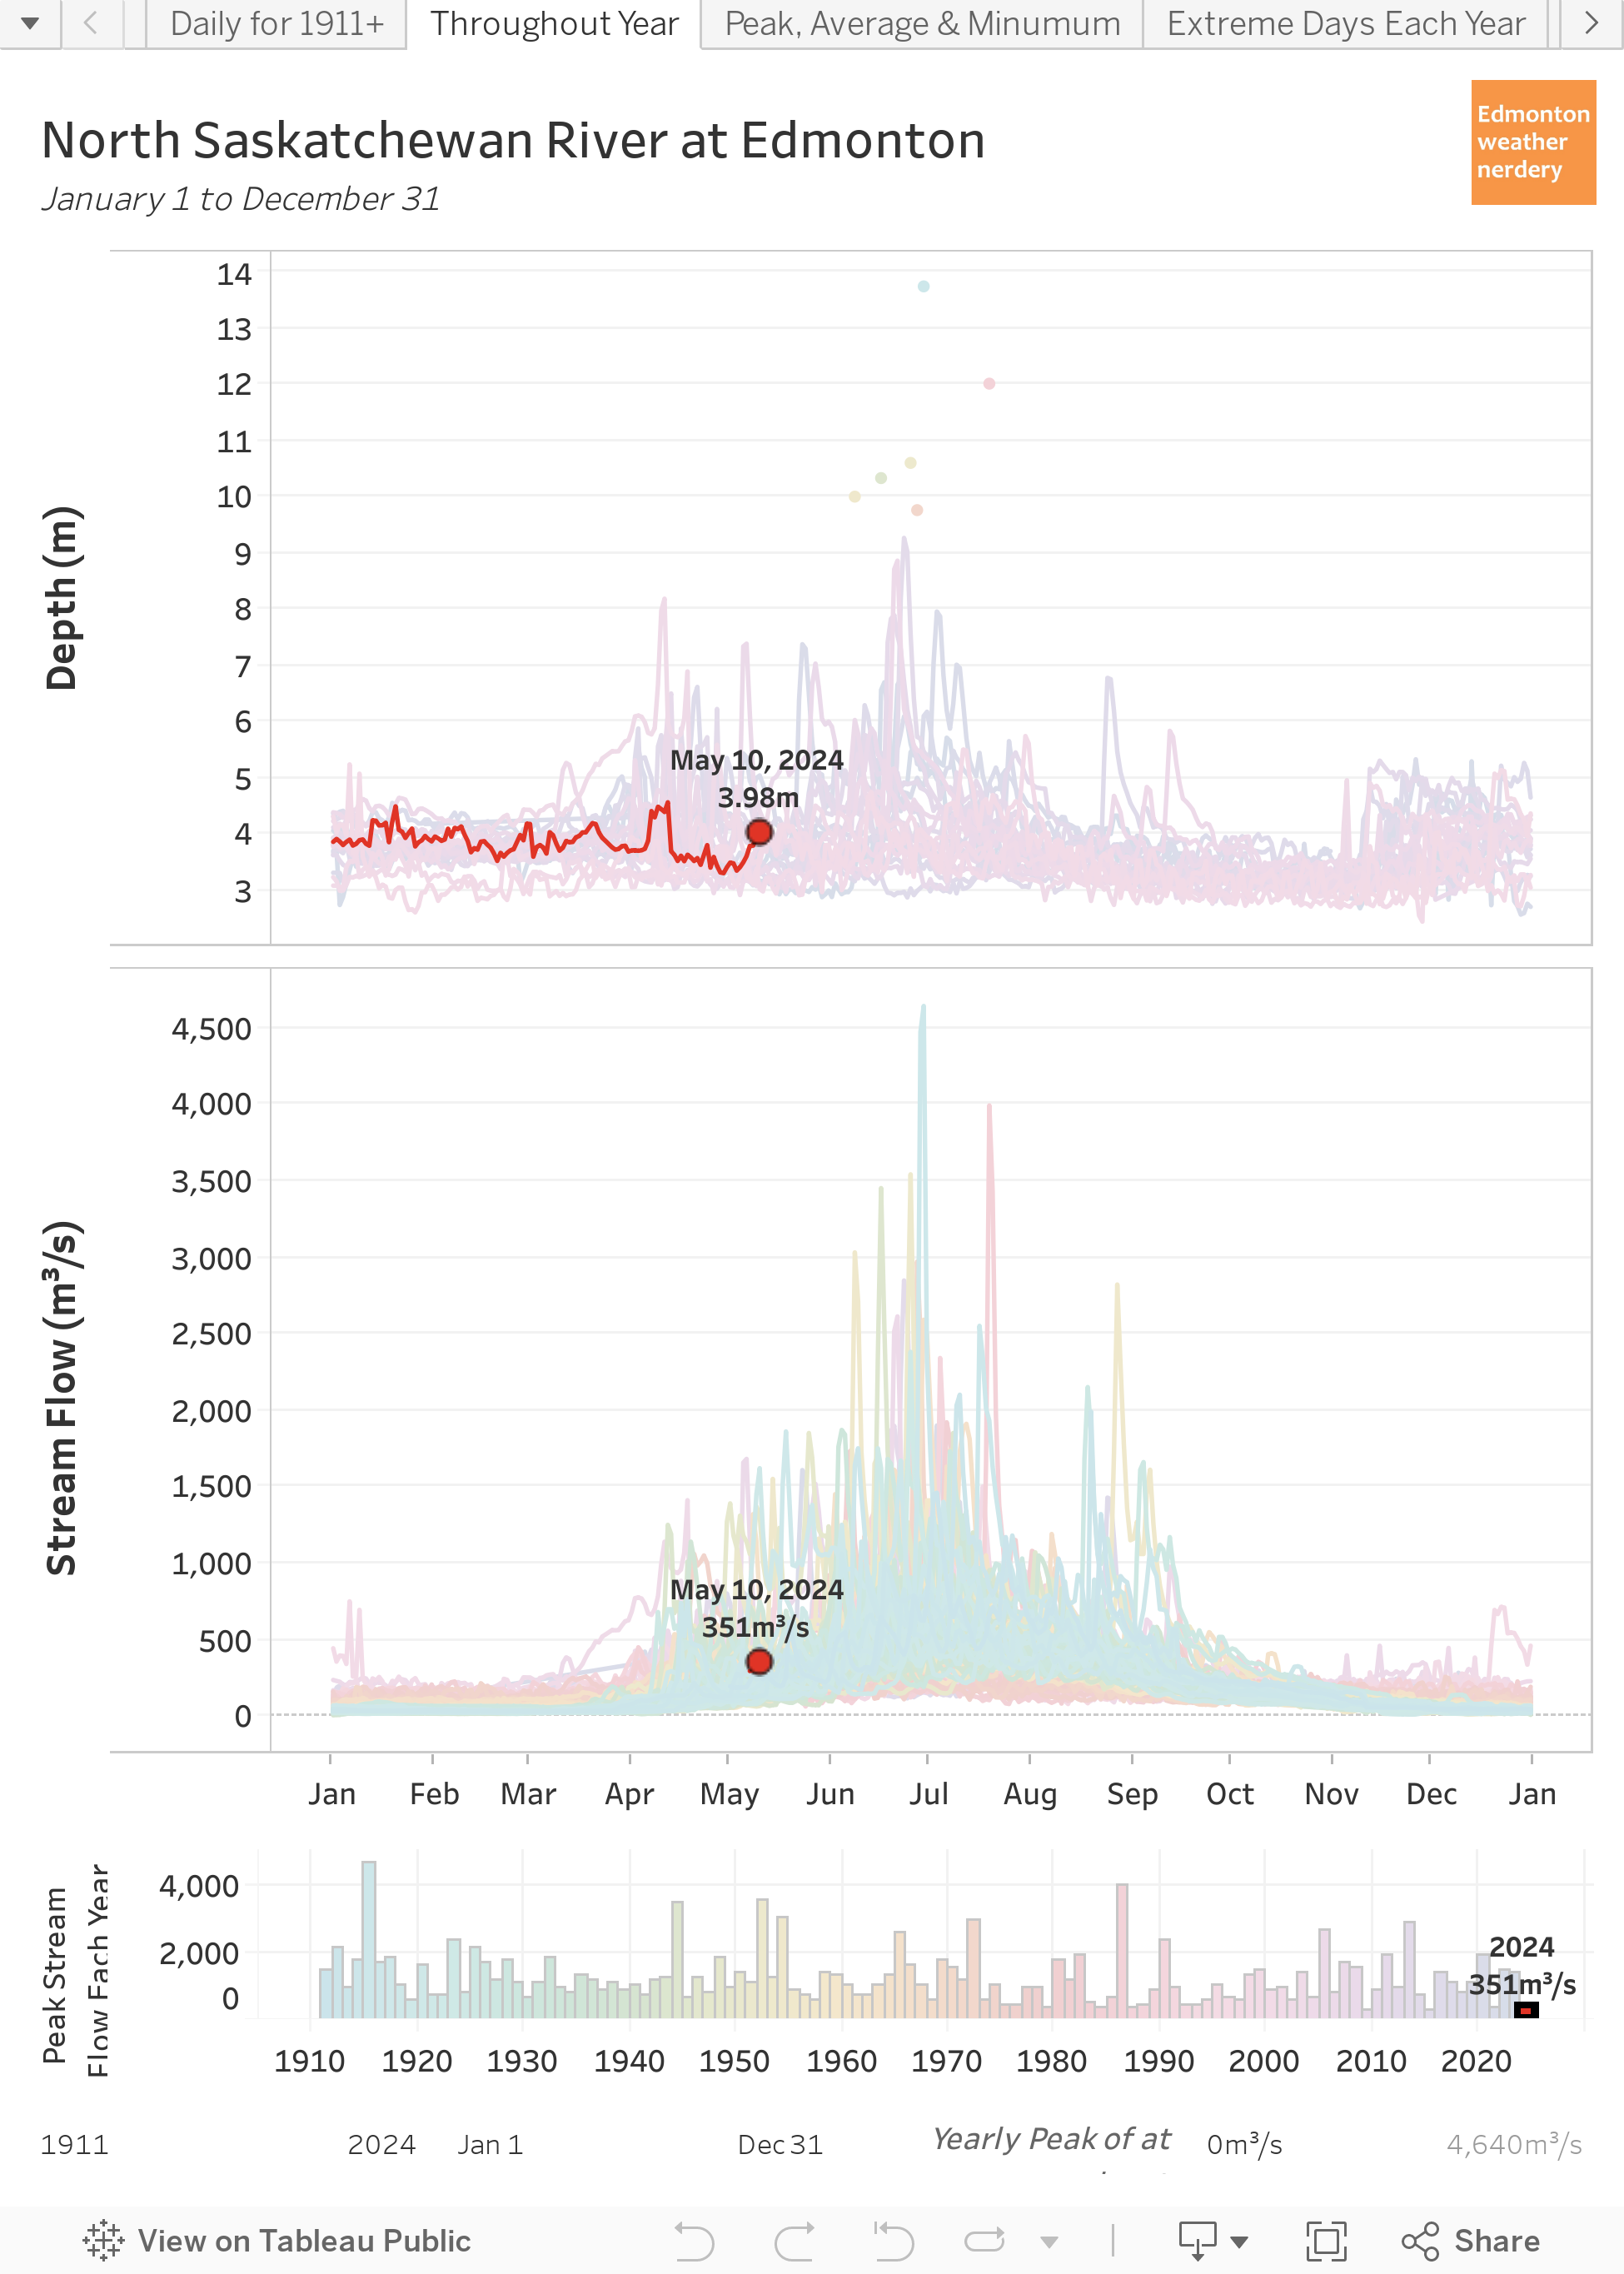
This chart shows how the river depth and streamflow vary throughout the year.

And the mini-flood of May 2020 was definitely big enough to makes its presence known, but it's well below the really big years.

We are right in the middle of high-water season, although the really big floods usually happened in June & July.


1,800m³/s
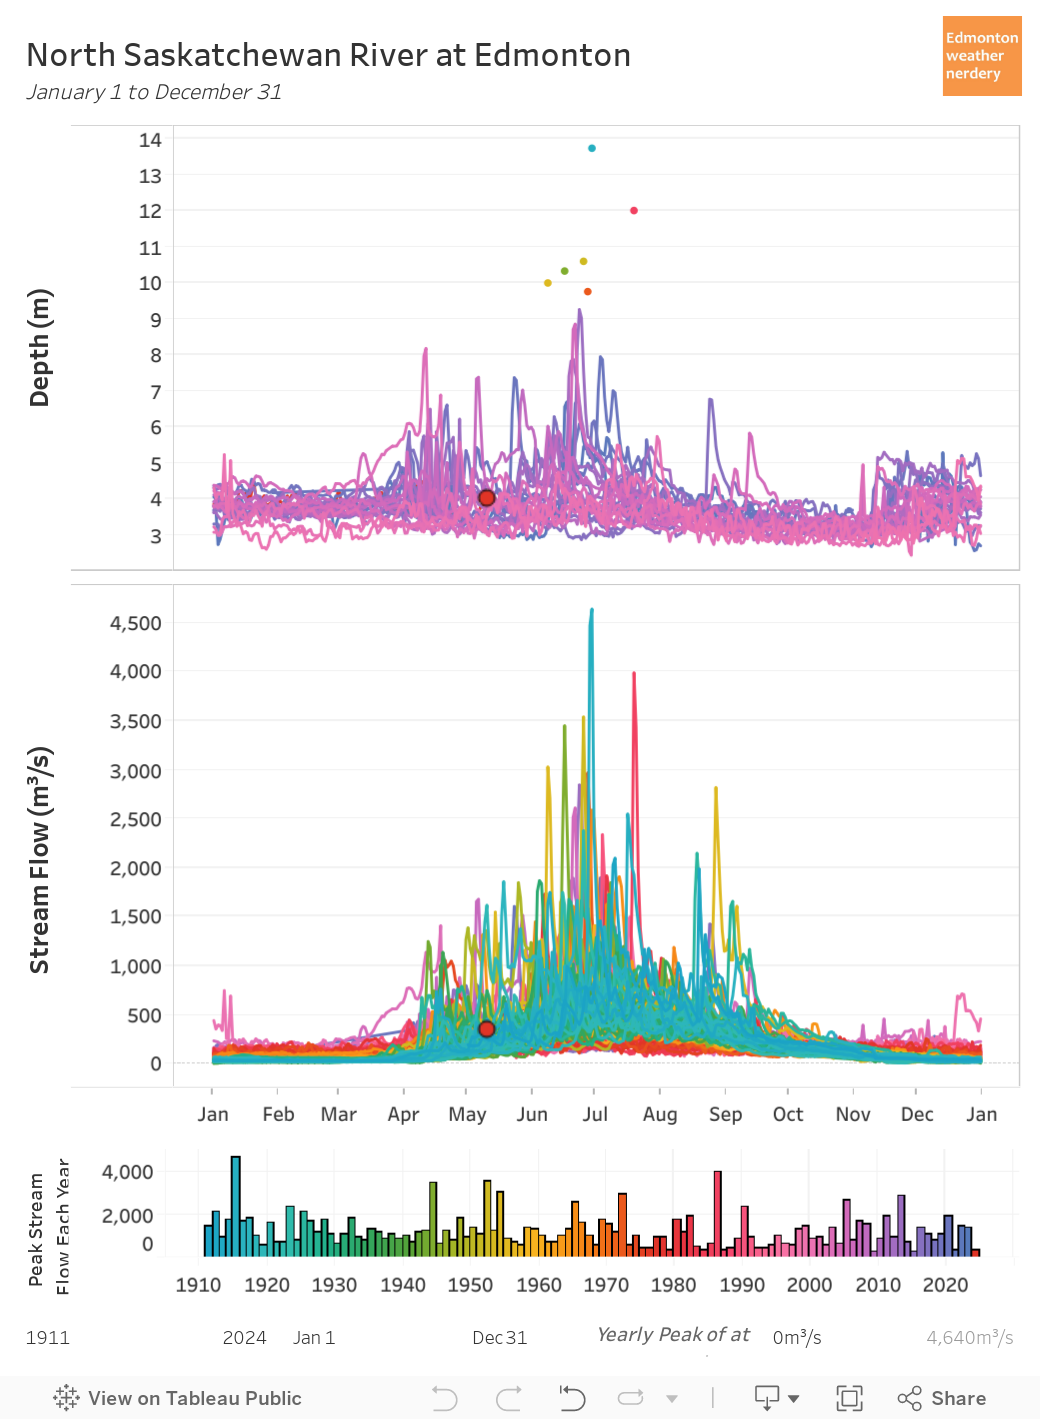
Here is the same chart, but it is cleaned up a little bit to only show the years with streamflows of 1,800m³/s.

There have only been 19 years to get that high, most recently 2013, 2011, 2005...


Streamflow History (again)
Here's one more pretty chart which collapses all of the streamflow data for 1911-2020.

Here the various spikes are nicely visible, and you get a sense of how they are spread throughout the year, and throughout the years.

This chart can also be filtered to only show the 1,800m³/s+ years:

...and we can see that our little flood was pretty early in the year, and there might be more to come?

So that was a quick look at this recent mini-flood. If you are interested in a bit more historical context we took a deeper dive into the river data last year in: The North Saskatchewan River - from Top to Bottom

2019/08/05

The North Saskatchewan River - from Top to Bottom

Today we are going to take a deep dive into the North Saskatchewan river in Edmonton. We will be using a whole series of interactive dashboards, and if you have ever had any questions about the river you might be able to find the answers here.


History: 1911-Present


To get things started, here we have daily data recorded at the Low Level bridge.
  • Stream Flow (m3/s) recordings in green go all the way back to 1911.
  • Depth (m) in blue starts in 1999.

The river level and flow fluctuate throughout the year, and the tall green and blue spikes represent floods and other high flow conditions.

Edmonton's largest recorded flood was June 29, 1915 with the water rising to 13.73m and 4,640m3/s:

From: https://citymuseumedmonton.ca/2015/06/29/june-29-1915-edmontons-river-valley-floods/

The photo of the Low Level Bridge with a freight train being used as ballast is quite well known, but the second photo of the Dawson bridge shows just how far the river spilled over its banks.

For some context, the river's average depth in the summer is around 3.5m with a stream flow of 300m3/s. During the great flood of 1915 the river's height was 10m (or 30'/3 storeys) above average, and the volume of water was about 15x more than average.

The second largest recorded flood was just over 30 years ago in 1986. The stream flow peaked at 3,990m3/s, and the depth was about 12m although I couldn't find an exact number for that. There are also reports of a large flood in August 1899 which reached 12.61m, but the records for that aren't complete. Other large floods were June 25, 1952 at 3,540m3/s and 10.59m, and 1944, 1954 and 1972 were also all around the 10m mark.

In recent years on June 23, 2013 the river reached 2,847m3/s and 9.25m. That was the same week that Calgary had its large flood. 2005 was another big year reaching 2,612m3/s and 8.85m.

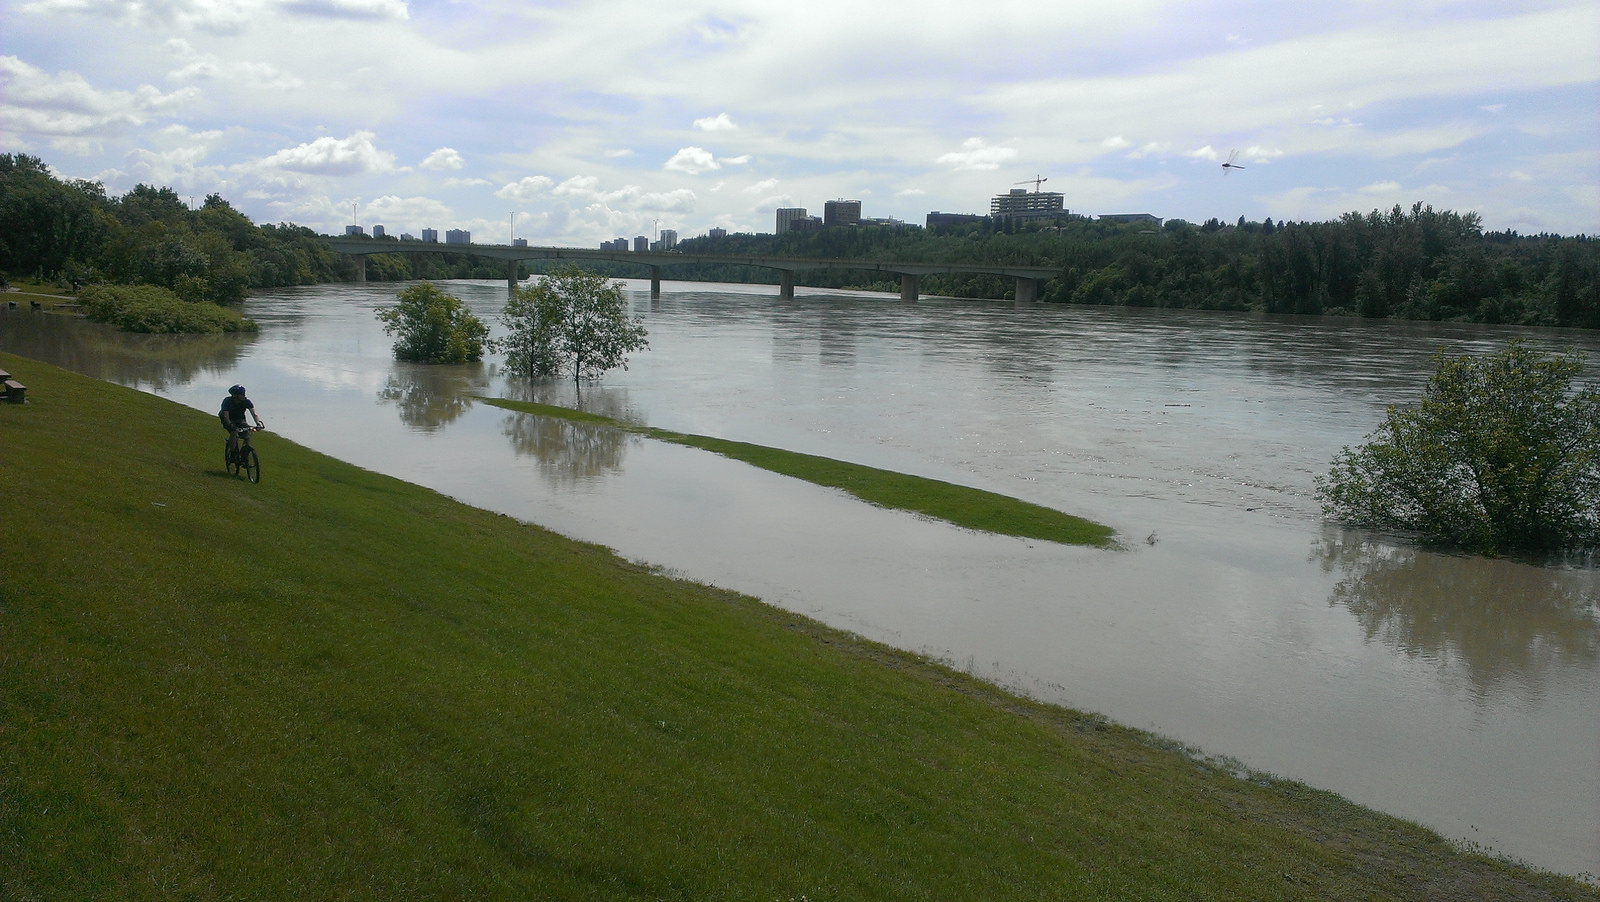
This is what the 2013 mini-flood looked like:


Changes Throughout the Year


Here we have all of that daily data rolled into the calendar year from January-December.

Two caveats for this chart:

  • the depth data is only available for 1999 onward, so if you click through the various years the upper chart will be blank for 1911-1998.
  • I'm not really sure how accurate the readings are during the winter - for recent years since 2015 the winter stream flows aren't even measured.

With that said the river fluctuates throughout the year and has a fairly reliable peak in late-June or early-July. All of the largest floods occurred in June & July, but some years - 2003, 2007 & 2018 - also recorded big spikes in April & May during spring runoff.

One other thing to look for here is 2017, which is the year that the "accidental beach" hit the news. That summer the river depth was below 3.5m starting in early August, and that is low but it isn't really low.


3.5m is around the middle of the range for late-summer, but in 2018 the depth stayed closer to 4m through the end of the summer, and for 2019 so far we have generally been over 4.5m.

Beach to the left of me, Cloverdale to the right.
The beach was still around in 2018 & 2019, but the higher water levels create a wide (but not particularly deep) channel between it and Cloverdale which makes it hard for people to get to.


Changes Over Time


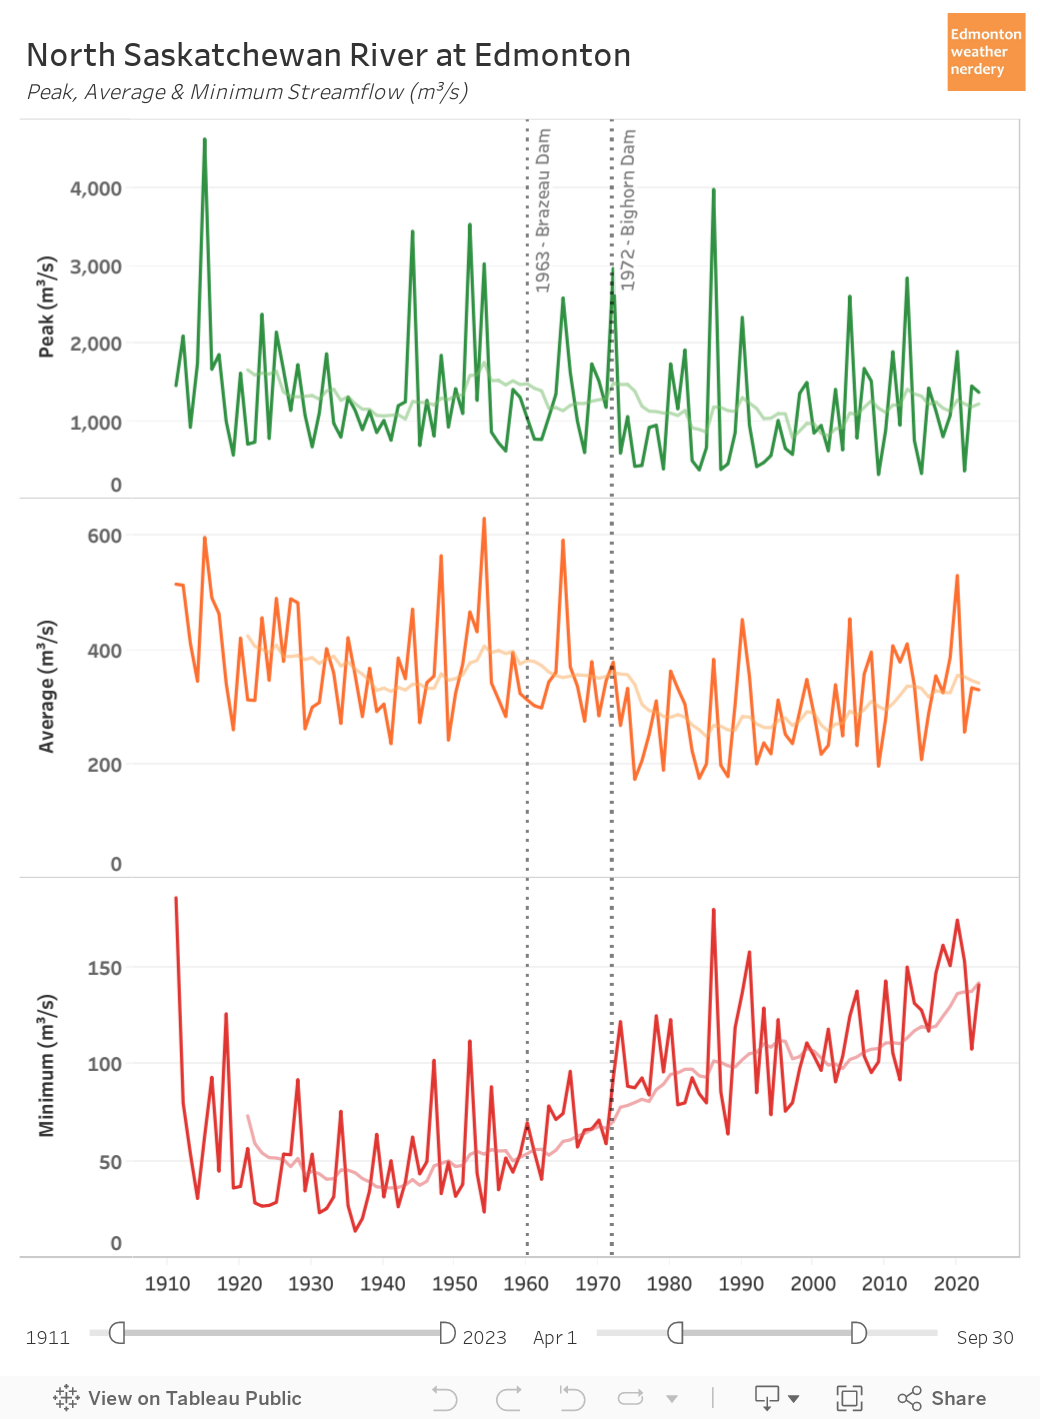
Are there any trends over the past century? That's a complicated question, because in 1963 the Brazeau Dam was constructed, and then in 1972 the Big Horn Dam was added. Those dams change the river's behavior throughout the year.

People often think that dams will stop floods, but once the reservoir behind a dam is full there's nothing more it can do. And so Edmonton's second largest recorded flood was in 1986, after both of the dams were built.

When we look at the peak stream flow each year it has averaged 1,100m3/s since 1911, and that average hasn't really changed since the construction of the dams. We have had a few less spikes though, because in the 61 years prior to the dams being built there were 6 years where the river peaked above 2,500m3/s, and in the 47 years since only 3 years have reached that high.

For the average flow during the summer, following the construction of the dams the average flow has been around 300m3/s, with some years just below 200m3/s while others have been as high as 400m3/s. Overall that is down compared to before the dams when the average was closer to 350m3/s, and the individual years typically ranged from 250m3/s to 450m3/s.

The most noticeable change here is on the low-end, with the river currently bottoming-out on average at around 100m3/s each year. Prior to the construction of the dams the average-minimum was half of that, at around 50m3/s.

Taproot Edmonton recently did a discussion of the history of the dams in: Dam Complicated. It high-lighted the importance of the dams for maintaining that minimum flow throughout the year - to provide a reliable supply for drinking water, agriculture, and industry (and also power generation).


Extreme Days


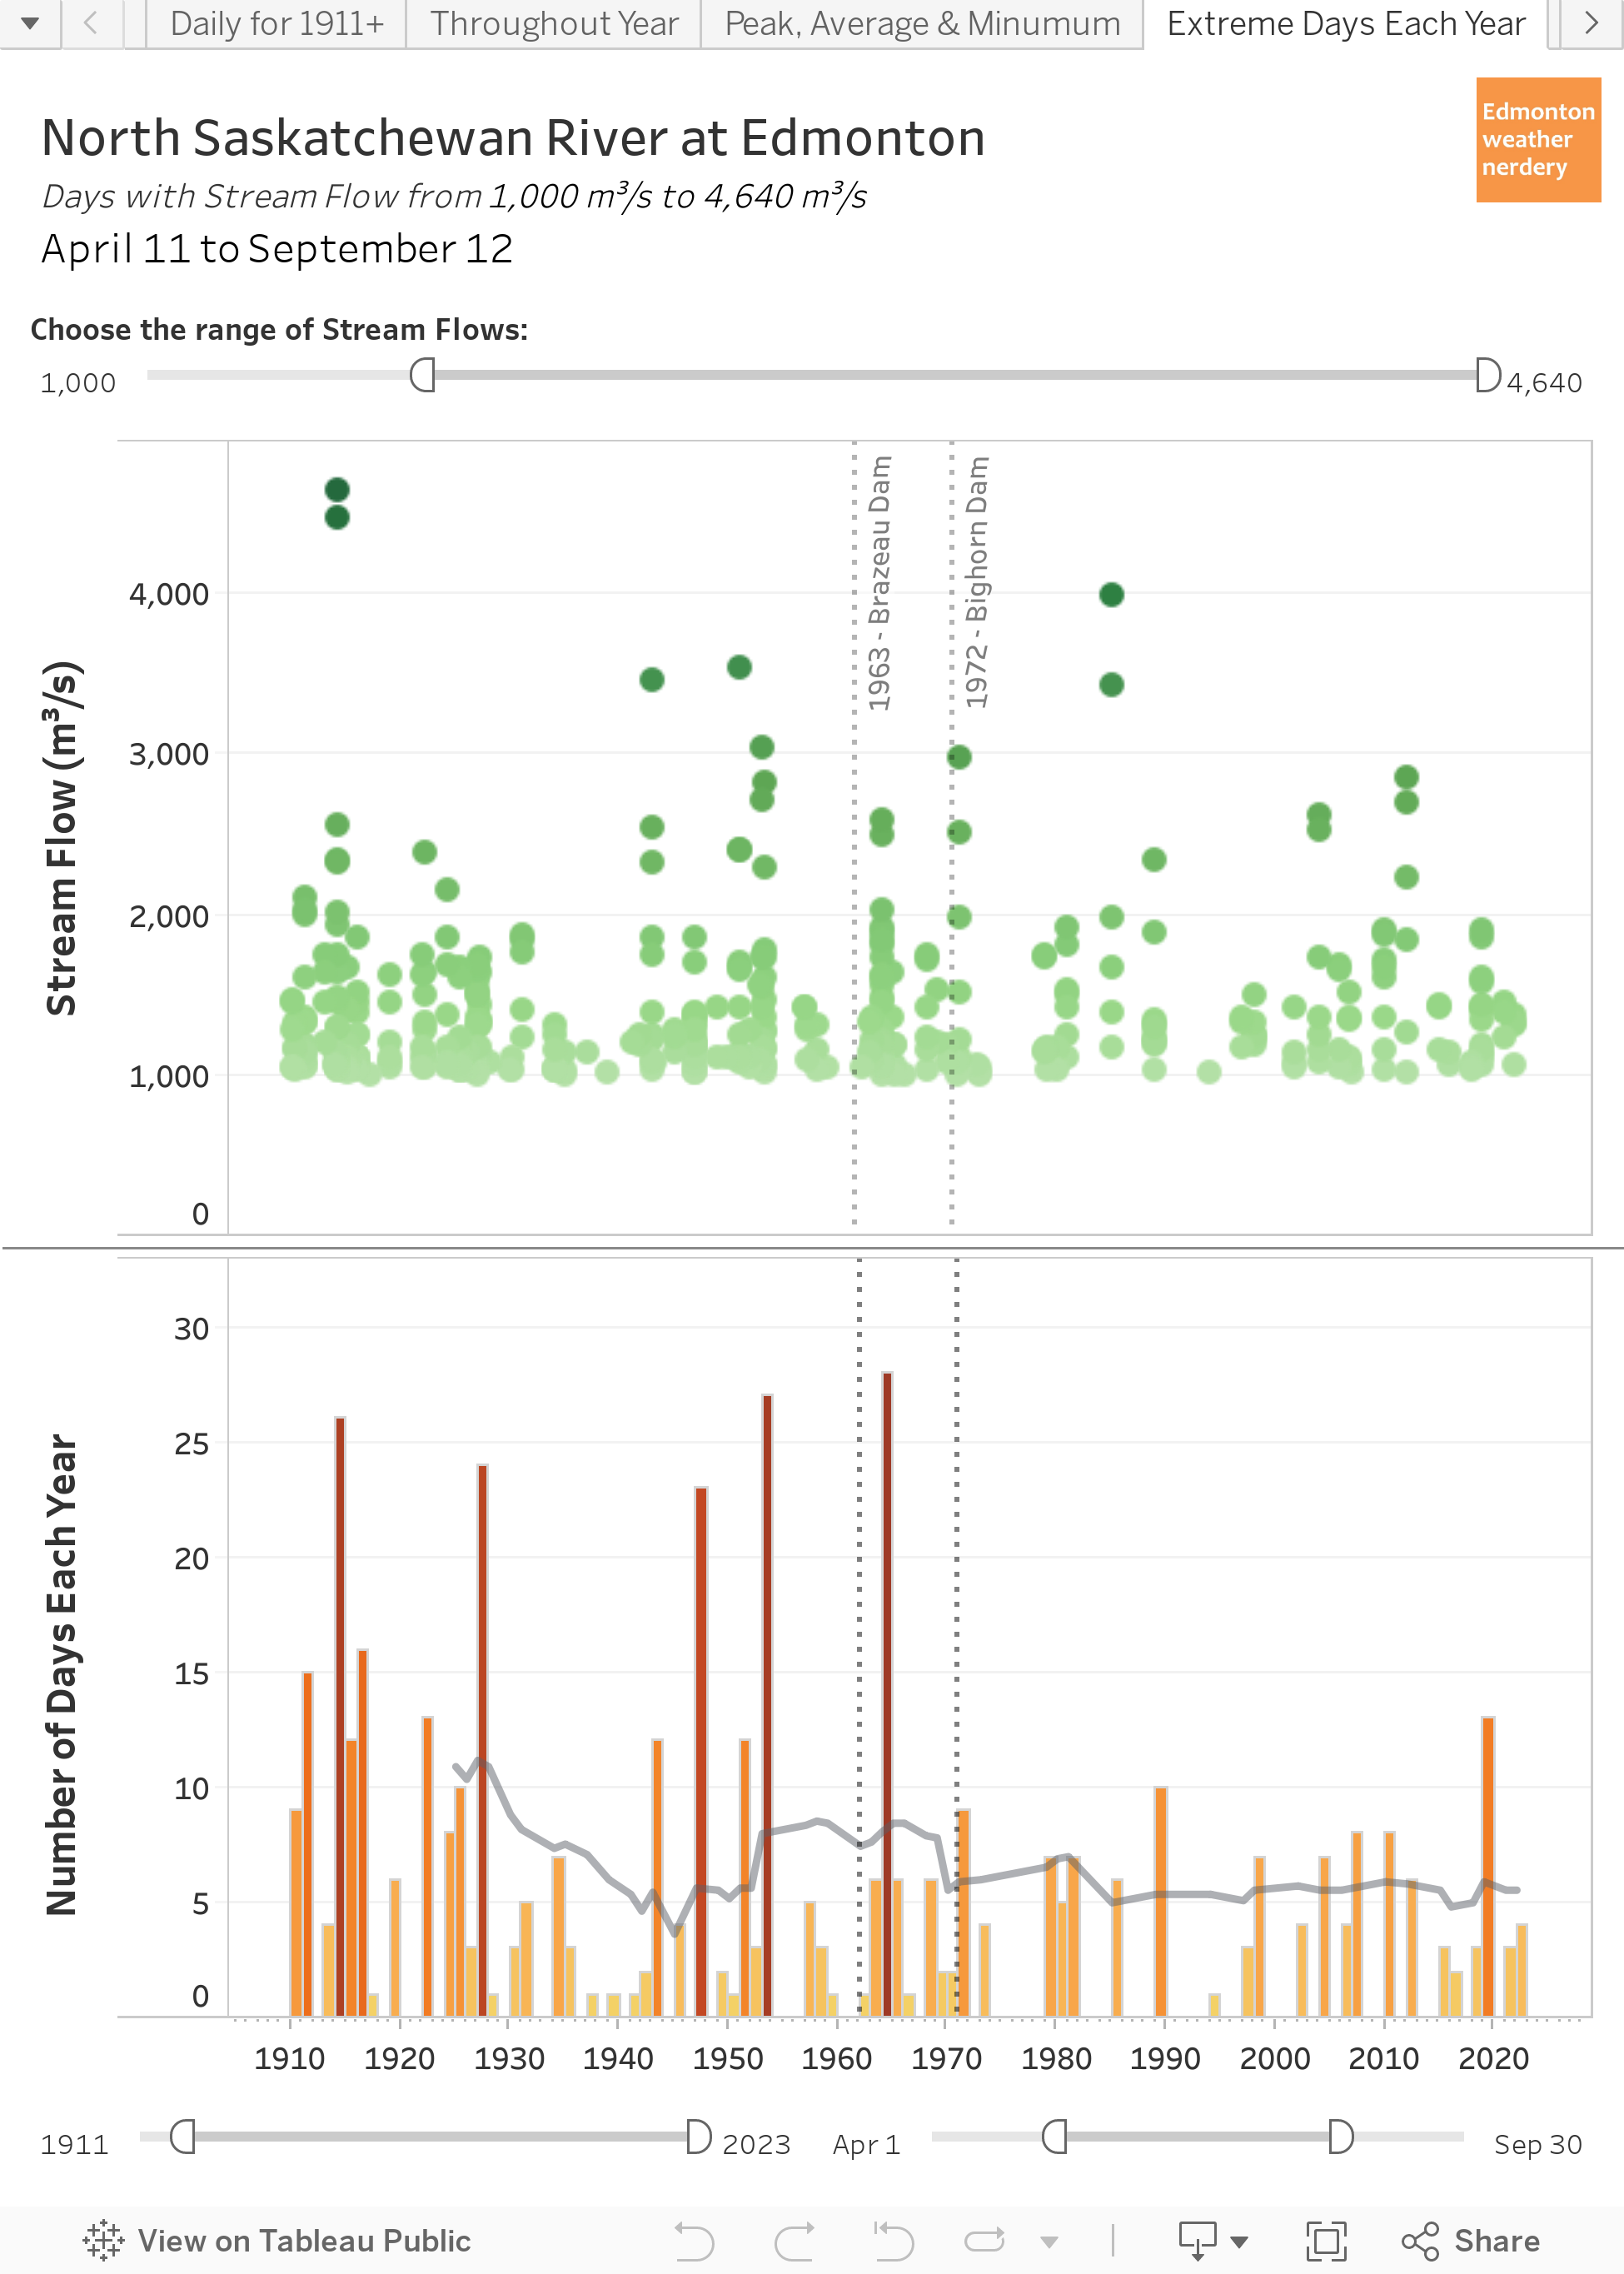
This dashboard lets us compare the number of high or low days each year, and we will start with the high days and flows of at least 1,000m3/s.

1,000m3/s isn't a flood, but it is on the high end of the river's typical range. And here we can see that the number of 1,000+m3/s has become much less variable since the construction of the dams. Since 1972 the high years have had at most 8-10 days with 1,000m3/s per year, while prior to the dams some years had 15 or even 25 days.


Flipping things around, here we have the number of low stream flow days each year. Since the construction of the dams the number of days with stream flow below 100m3/s has plummeted from an average of more than 150 days per year a century ago to less than 50 days today.

So the dams have moderated the high-flow days a bit, and have greatly reduced the number of low-flow days.


The Floods


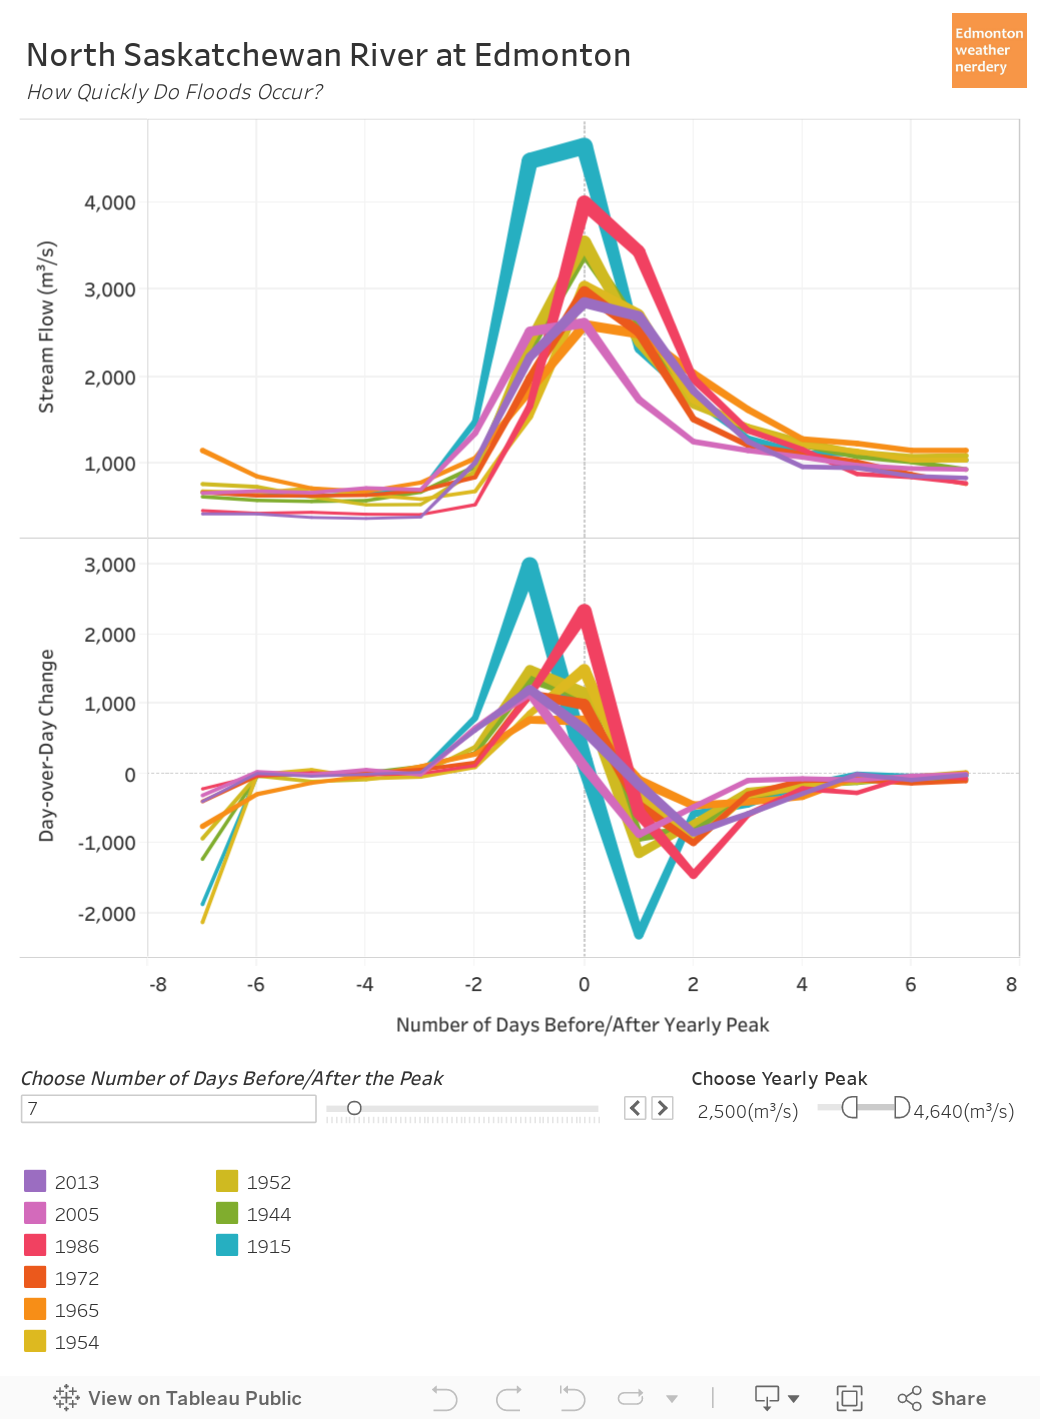
And finally, in this dashboard we can compare how quickly the streamflow changed in the days immediately before and after Edmonton's historic floods. The first chart shows the streamflow each day, and the second shows the day-over-day difference.

Our most recent big flood in 2013 ramped-up from 400m3/s to 2,847m3/s over the course of 3 days. And then by 4 after the peak things were back down to around 1,000m3/s.

The great flood of 1915 took 2 days to go from 700m3/s to 4,470m3/s, and then on day 3 it increased a little bit more to 4,640m3/s. Then within 4 days it was back down to around 1,000m3/s. For a bit of trivia: during Calgary's big 2013 flood the Bow River peaked at 1,840m3/s and the Elbow peaked at 700m3/s, for a combined total of about 2,540m3/s.

Comparing all of these curves the ramp-up typically takes 2~3 days to go from average~ish to peak, with volumes that are 8x, 10x or even 15x above average. And then things ramp down a bit more slowly settling at around 1,000m3/s after a week.

And that's it for our big look at the North Saskatchewan River in Edmonton. I hope that this will be one of the more comprehensive discussions of the river that you will ever find, but if I've missed anything please let me know in the comments, or send me a message on twitter at https://twitter.com/yegwxnerdery.

2016/08/26

August 2016 Mini-Flood

The river has been in the news a lot in the last few days, with warnings of rapidly rising water levels. It peaked on the 25th, but here's what we saw over those few days:


Before this, it had been at around the 3~3.4m mark for days, but then over the course of about 36 hours it rose 3.3m (11') to reach 6.8m. And with the increase in depth, the flow jumped from about 200m3/s to 1,400m3/s.

I don't have much in the way of historical data for river flows, but here is the Alberta Environment chart of river flow for the year:

Alberta Environment and Sustainable Resource Development > North Saskatchewan River at Edmonton(05DF001)
http://www.environment.alberta.ca/apps/basins/DisplayData.aspx?Type=Figure&BasinID=4&DataType=1&StationID=RNSASEDM

The most unusual thing about this flood is that it happened in August, while floods are normally supposed to take place in June.

Here is a comparison of this 2016 mini-flood to the one that peaked on June 23 2016:


I wasn't sure quite how to line these up, so I've matched the peaks: 11am June 23 2013 lines up with midnight August 25 2016.

The June 2013 mini-flood was much larger. It started a little higher - 4m & 350m3/s - and it peaked much, much higher at 9.5m and 2,900m3/s.

This year's miniflood was quite a bit faster though, with levels increasing from 3.5m to 6m in just 12 hours. That's 2.5m (8'), while back in 2013 the largest 12 hour increase was only 1.4m (4.5').

2016/06/24

2016 River Levels

Something a little bit different today.

3 years ago this week, while Calgary and southern Alberta were famously flooding, up in Edmonton the North Saskatchewan was having a bit of a mini-flood as well.

Here are a few pictures from June 23, 2013:


The speed of these things is amazing:


Over the 4 days from June 19, 2013 through June 23 the river rose from 4m to 9.4m - that's 5.4m or almost 18'. And the volume increased by 7x, from 400m3/s to 2,800m3/s.

2,800m3/s is 10,080,000,000 L/hr, which is a ridiculous number.

I was reminded of this while in the dogpark today, because the river levels are very low.
3 years ago this spot was under 23' of water
It's tough to really convey that in a picture, but it's only June and there are already islands poking up in the middle of the river around the High Level bridge.

Alberta Sustainable Resource Development has a website with data on all of the province's river basins. As of June 24, 2016 the North Saskatchewan in Edmonton is sitting at about 2.4m deep, with a flow of 110m3/s.

And here is a chart that is taken straight from their website:
Source: http://www.environment.alberta.ca/apps/basins/DisplayData.aspx?Type=Figure&BasinID=4&DataType=1&StationID=RNSASEDM


The dashed lines are the high & low quartiles that I often also like to use on my charts. And right now 2016 is well below the typical range of about 240-550m3/s.