
History: 1911-Present
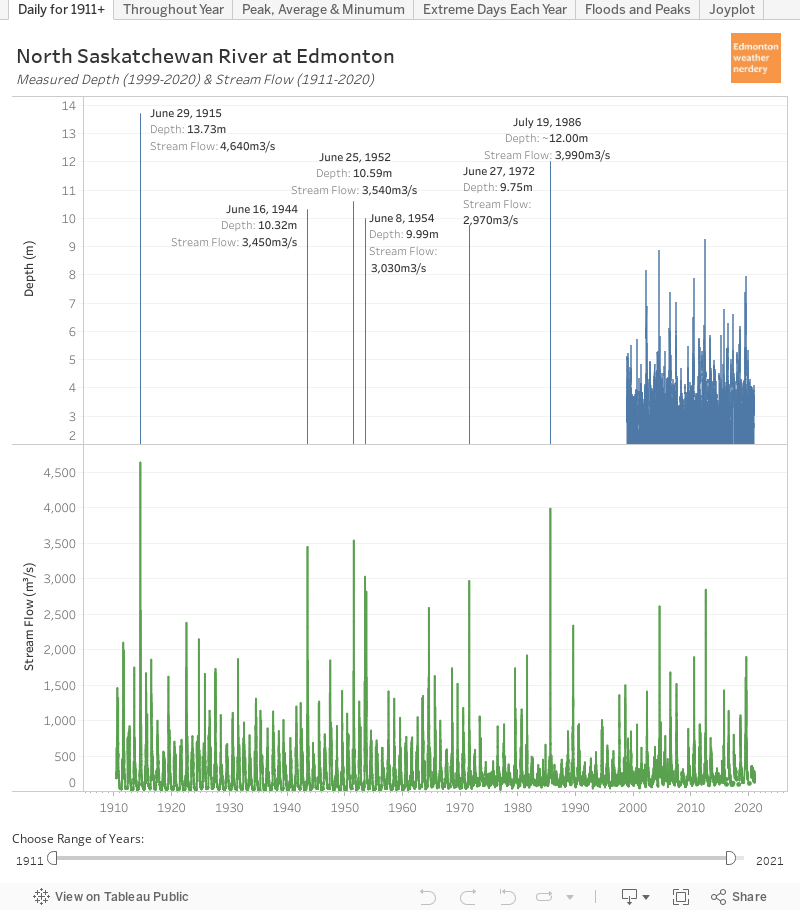
To get things started, here we have daily data recorded at the Low Level bridge.
- Stream Flow (m3/s) recordings in green go all the way back to 1911.
- Depth (m) in blue starts in 1999.
The river level and flow fluctuate throughout the year, and the tall green and blue spikes represent floods and other high flow conditions.
Edmonton's largest recorded flood was June 29, 1915 with the water rising to 13.73m and 4,640m3/s:

 |
| From: https://citymuseumedmonton.ca/2015/06/29/june-29-1915-edmontons-river-valley-floods/ |
The photo of the Low Level Bridge with a freight train being used as ballast is quite well known, but the second photo of the Dawson bridge shows just how far the river spilled over its banks.
For some context, the river's average depth in the summer is around 3.5m with a stream flow of 300m3/s. During the great flood of 1915 the river's height was 10m (or 30'/3 storeys) above average, and the volume of water was about 15x more than average.
The second largest recorded flood was just over 30 years ago in 1986. The stream flow peaked at 3,990m3/s, and the depth was about 12m although I couldn't find an exact number for that. There are also reports of a large flood in August 1899 which reached 12.61m, but the records for that aren't complete. Other large floods were June 25, 1952 at 3,540m3/s and 10.59m, and 1944, 1954 and 1972 were also all around the 10m mark.
In recent years on June 23, 2013 the river reached 2,847m3/s and 9.25m. That was the same week that Calgary had its large flood. 2005 was another big year reaching 2,612m3/s and 8.85m.
This is what the 2013 mini-flood looked like:


Changes Throughout the Year
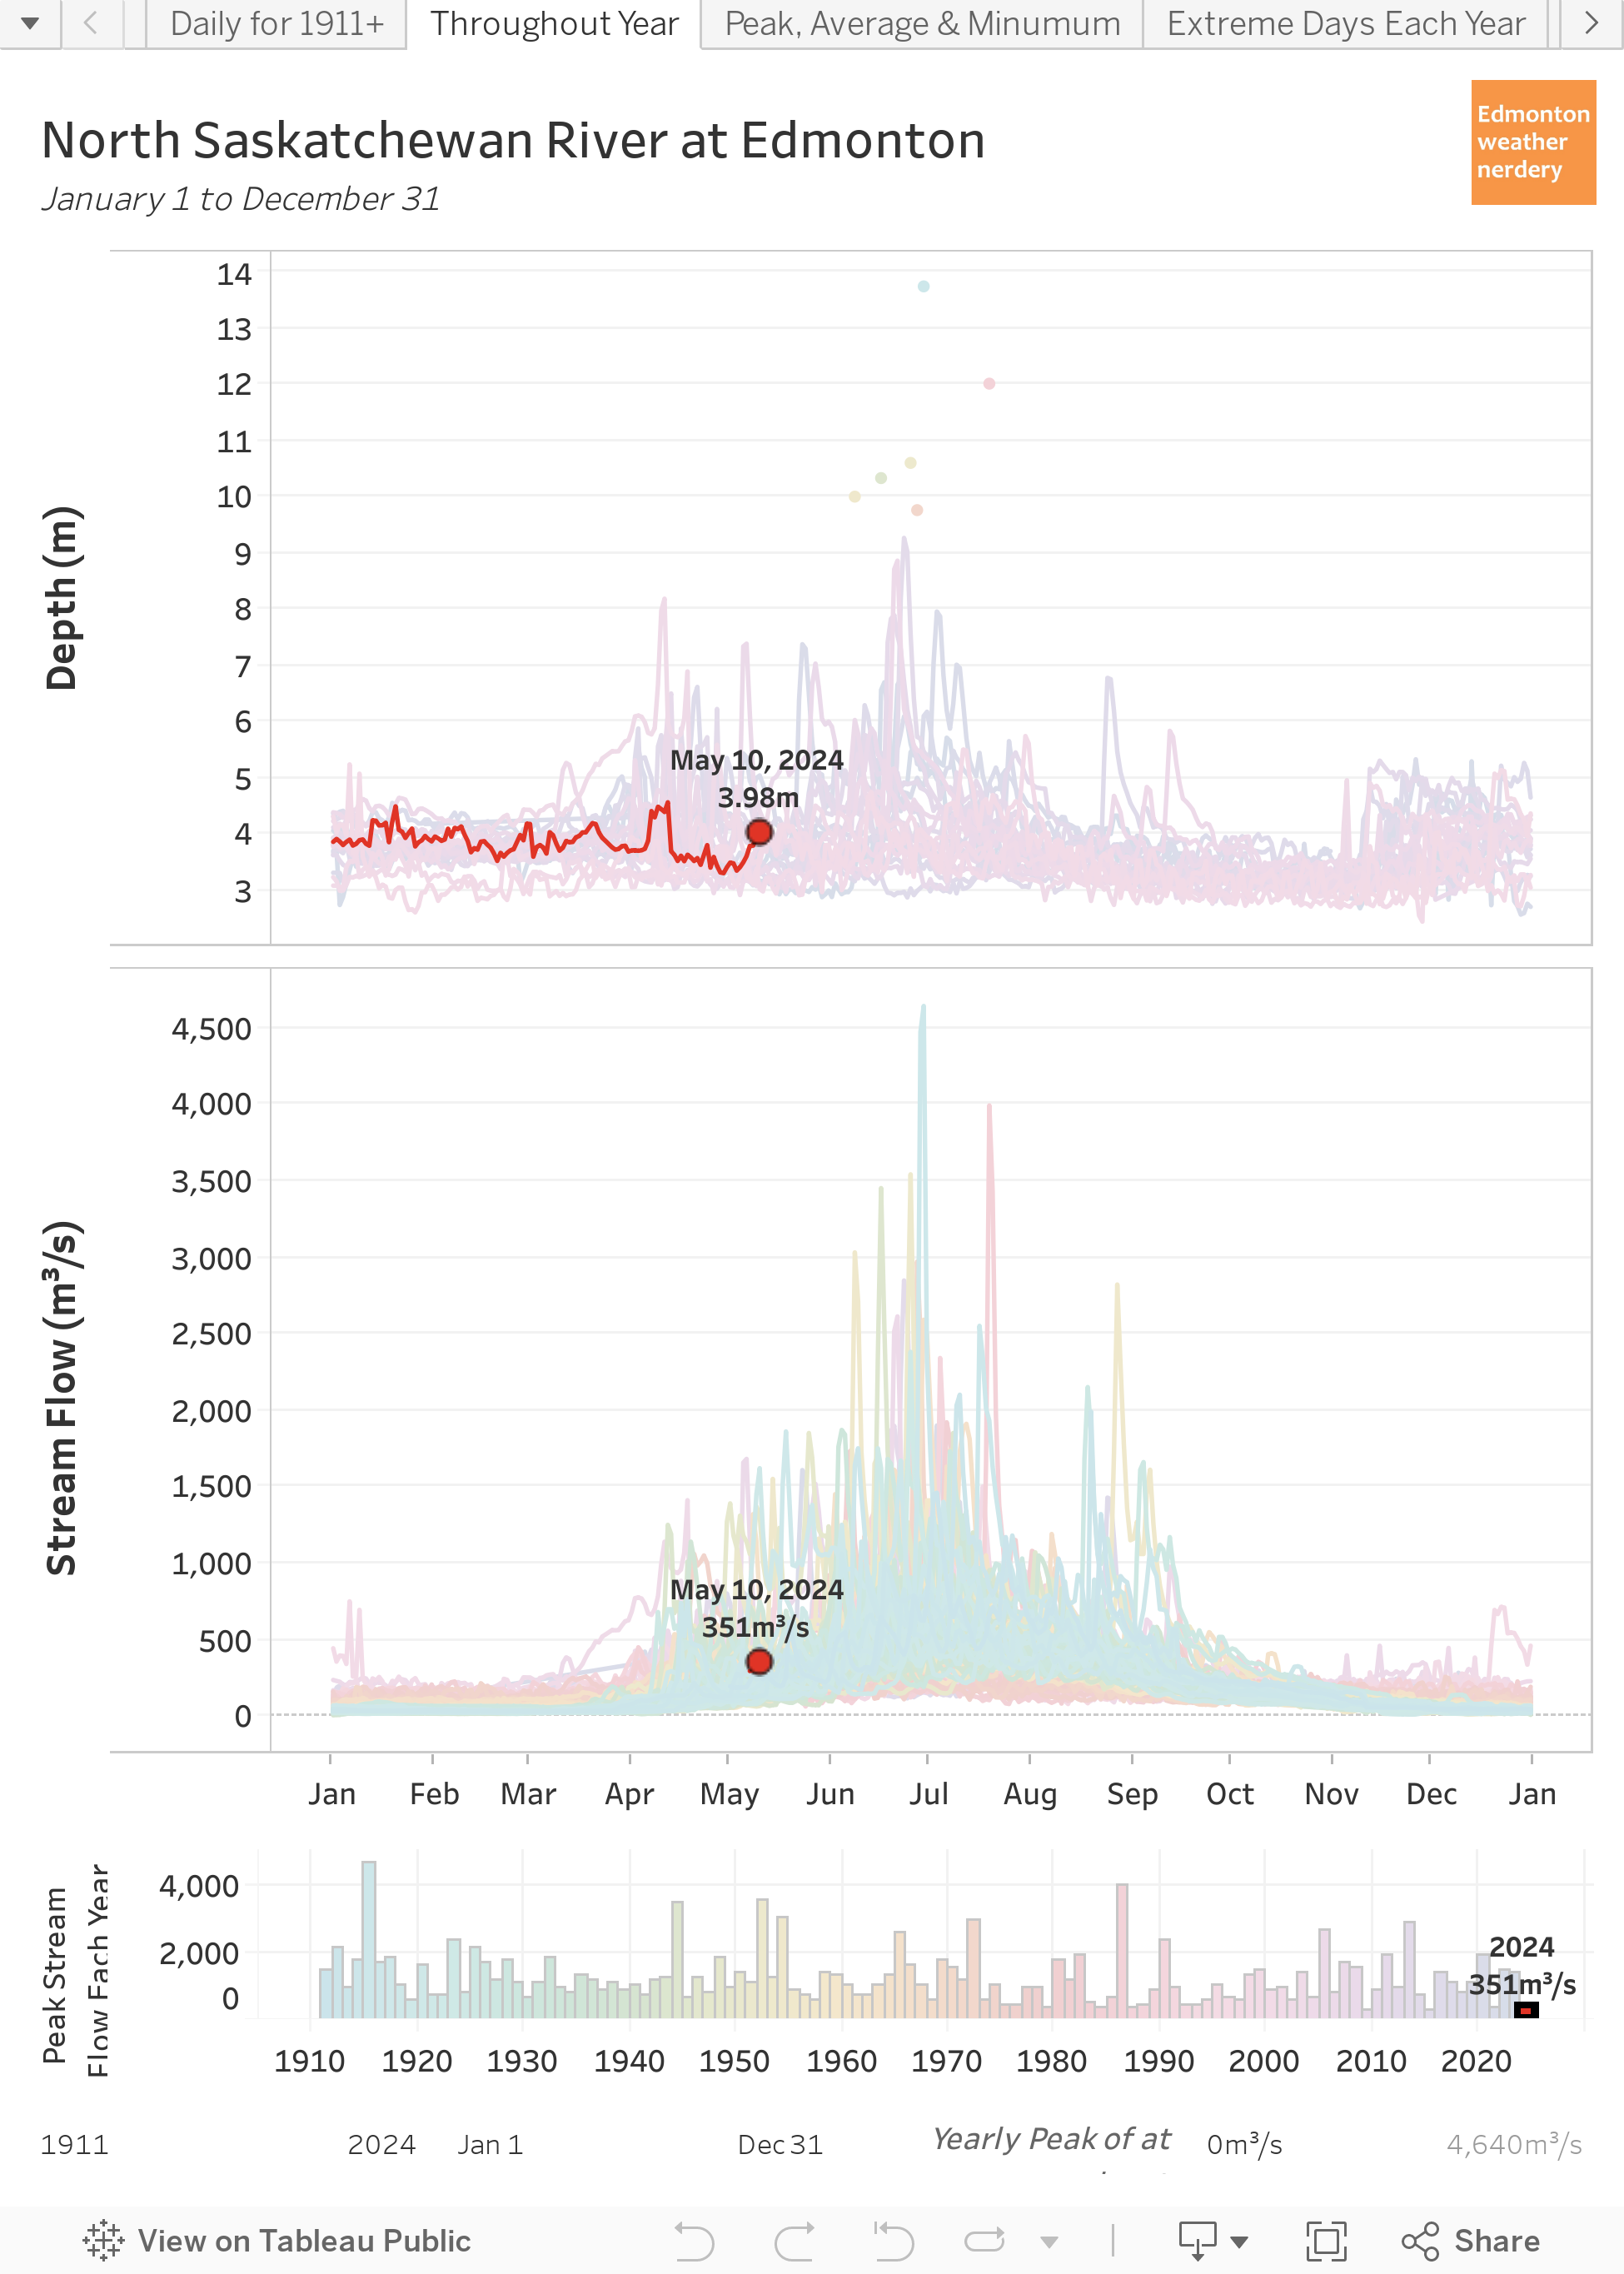
Here we have all of that daily data rolled into the calendar year from January-December.
Two caveats for this chart:
- the depth data is only available for 1999 onward, so if you click through the various years the upper chart will be blank for 1911-1998.
- I'm not really sure how accurate the readings are during the winter - for recent years since 2015 the winter stream flows aren't even measured.
With that said the river fluctuates throughout the year and has a fairly reliable peak in late-June or early-July. All of the largest floods occurred in June & July, but some years - 2003, 2007 & 2018 - also recorded big spikes in April & May during spring runoff.
One other thing to look for here is 2017, which is the year that the "accidental beach" hit the news. That summer the river depth was below 3.5m starting in early August, and that is low but it isn't really low.
3.5m is around the middle of the range for late-summer, but in 2018 the depth stayed closer to 4m through the end of the summer, and for 2019 so far we have generally been over 4.5m.
 |
| Beach to the left of me, Cloverdale to the right. |
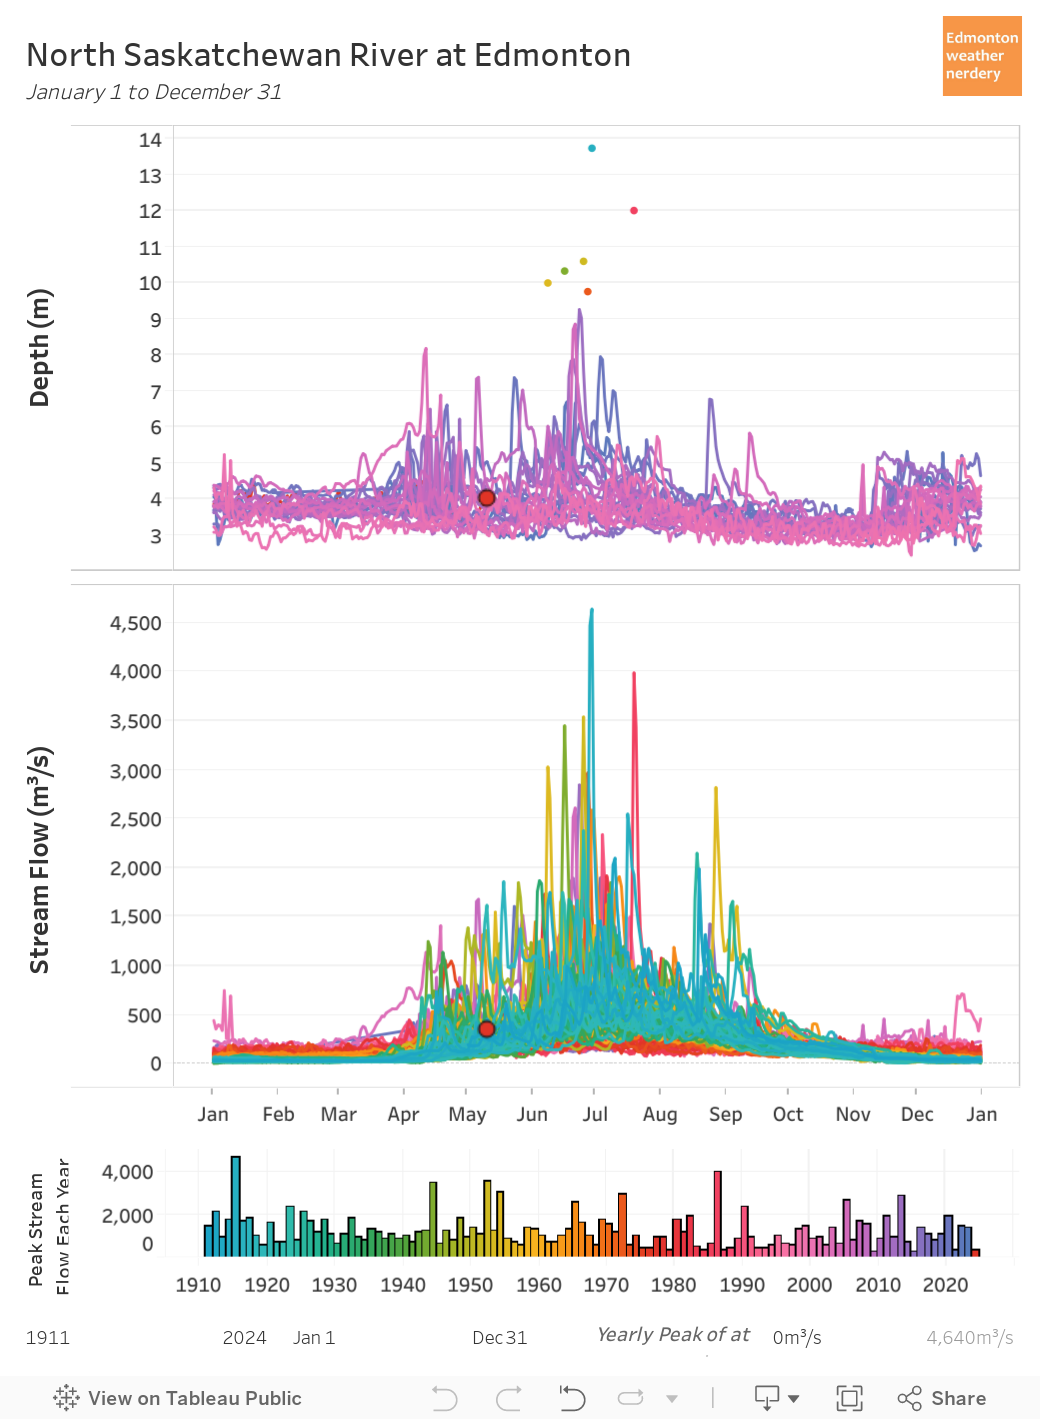
Changes Over Time
Are there any trends over the past century? That's a complicated question, because in 1963 the Brazeau Dam was constructed, and then in 1972 the Big Horn Dam was added. Those dams change the river's behavior throughout the year.
People often think that dams will stop floods, but once the reservoir behind a dam is full there's nothing more it can do. And so Edmonton's second largest recorded flood was in 1986, after both of the dams were built.
When we look at the peak stream flow each year it has averaged 1,100m3/s since 1911, and that average hasn't really changed since the construction of the dams. We have had a few less spikes though, because in the 61 years prior to the dams being built there were 6 years where the river peaked above 2,500m3/s, and in the 47 years since only 3 years have reached that high.
For the average flow during the summer, following the construction of the dams the average flow has been around 300m3/s, with some years just below 200m3/s while others have been as high as 400m3/s. Overall that is down compared to before the dams when the average was closer to 350m3/s, and the individual years typically ranged from 250m3/s to 450m3/s.
The most noticeable change here is on the low-end, with the river currently bottoming-out on average at around 100m3/s each year. Prior to the construction of the dams the average-minimum was half of that, at around 50m3/s.
Taproot Edmonton recently did a discussion of the history of the dams in: Dam Complicated. It high-lighted the importance of the dams for maintaining that minimum flow throughout the year - to provide a reliable supply for drinking water, agriculture, and industry (and also power generation).
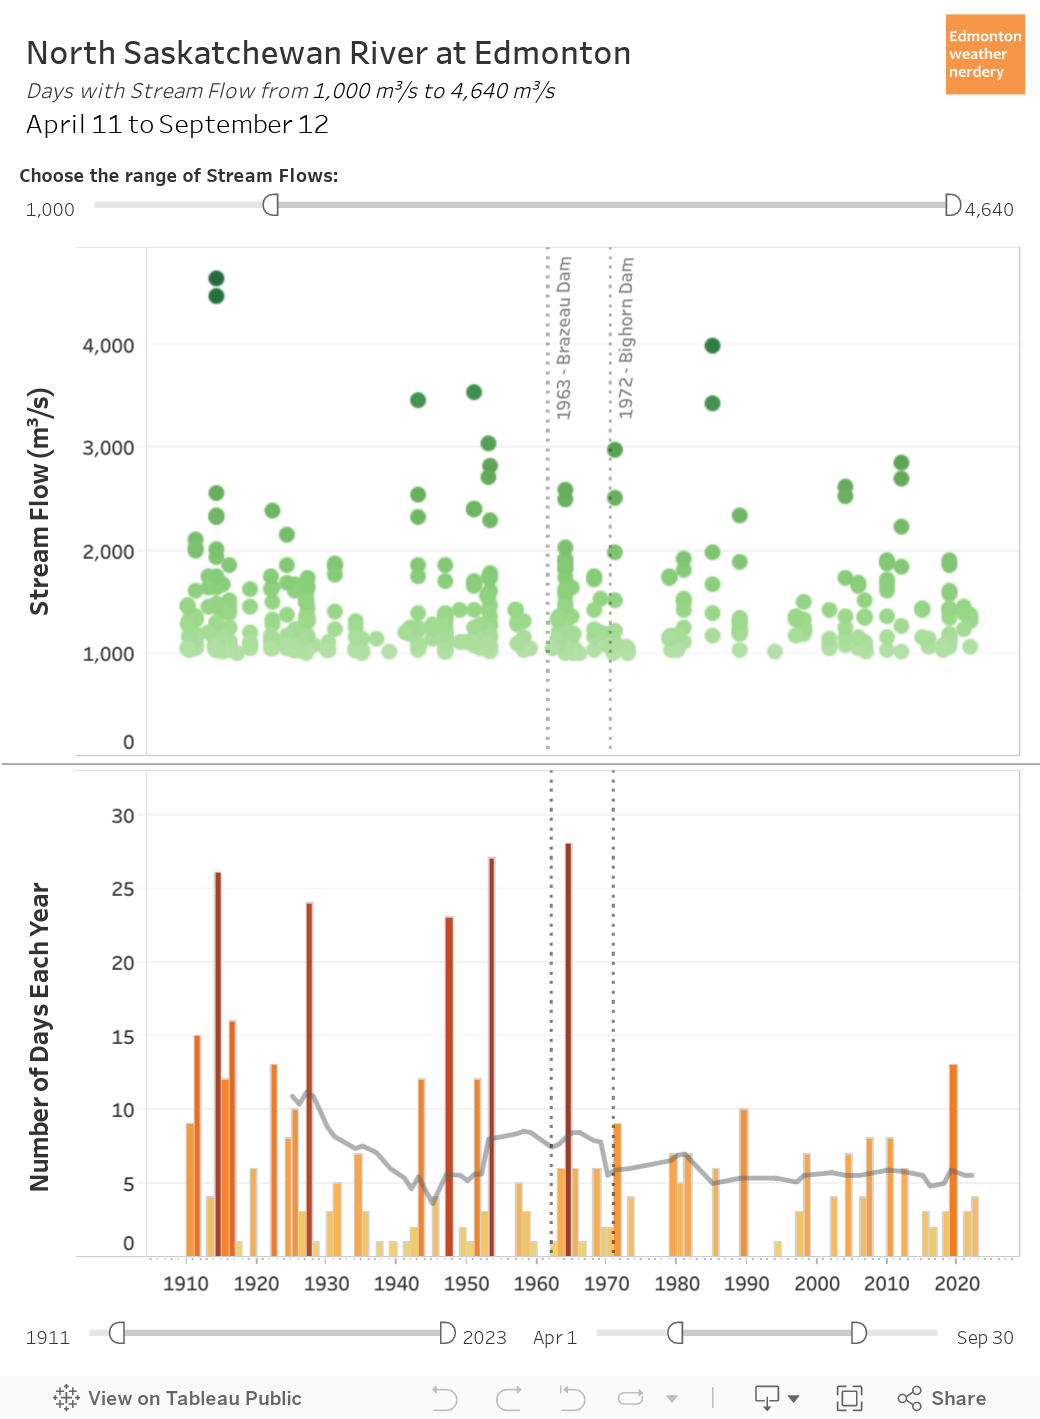
Extreme Days
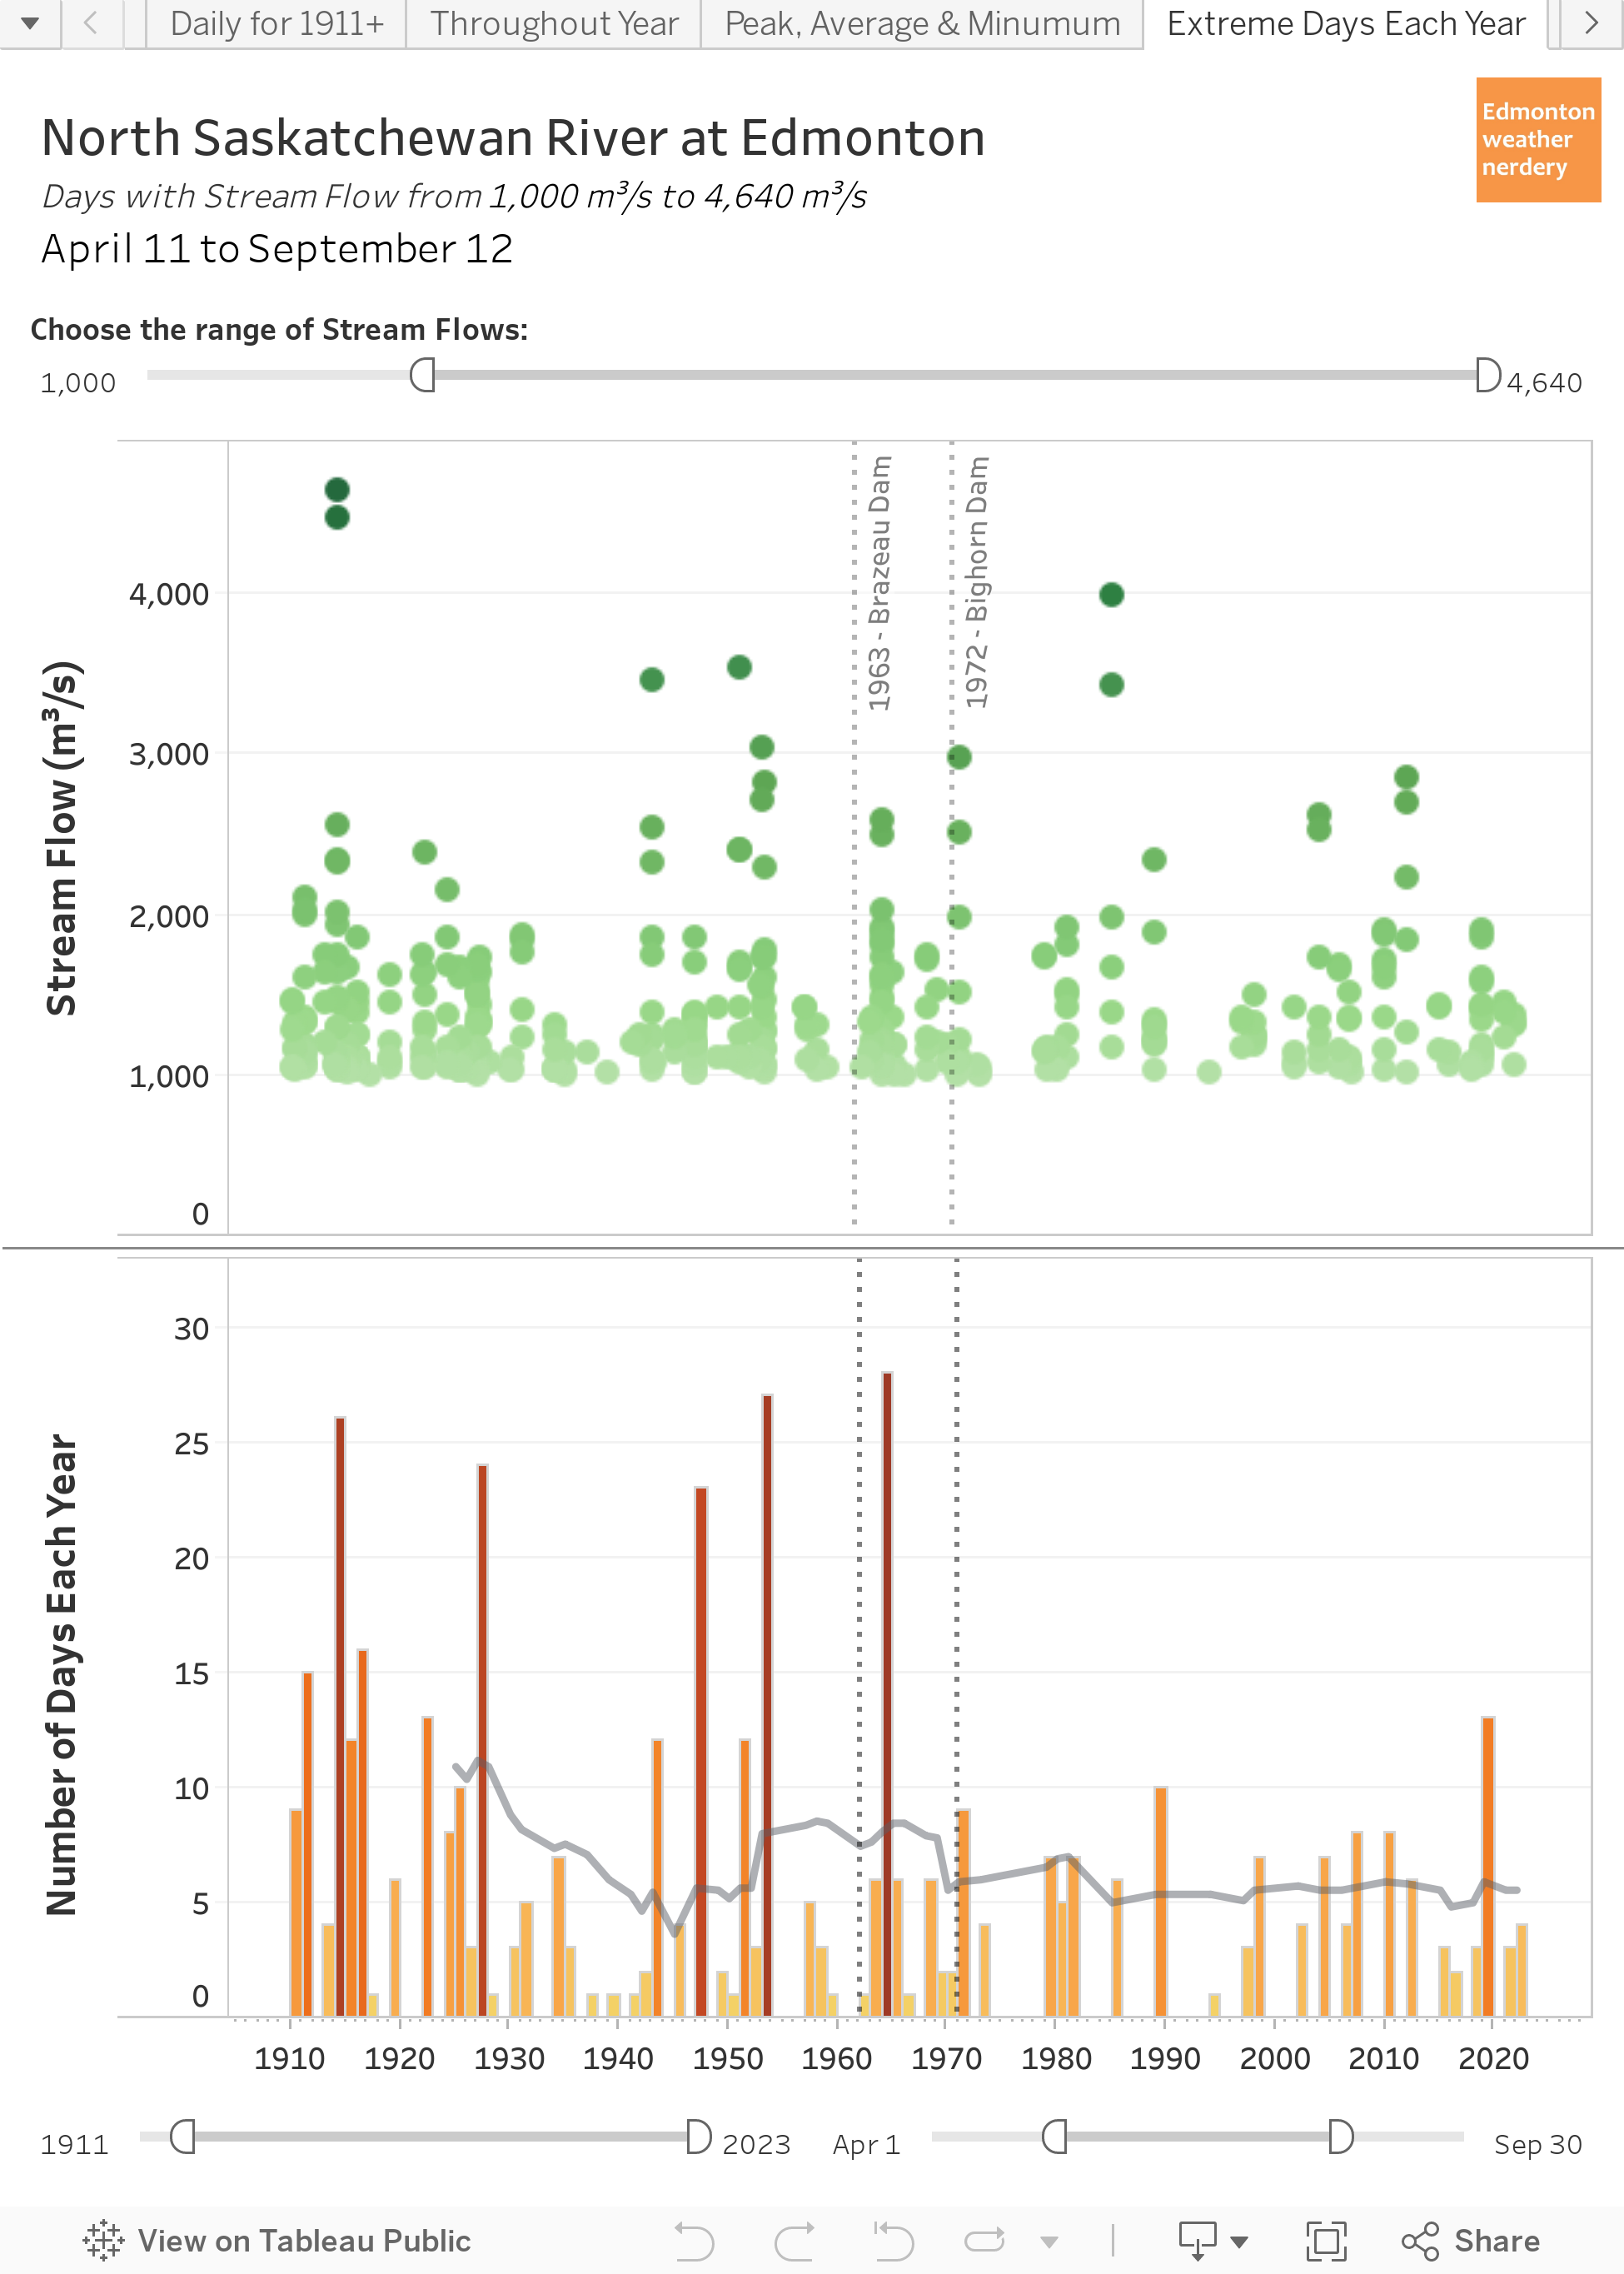
This dashboard lets us compare the number of high or low days each year, and we will start with the high days and flows of at least 1,000m3/s.
1,000m3/s isn't a flood, but it is on the high end of the river's typical range. And here we can see that the number of 1,000+m3/s has become much less variable since the construction of the dams. Since 1972 the high years have had at most 8-10 days with 1,000m3/s per year, while prior to the dams some years had 15 or even 25 days.
Flipping things around, here we have the number of low stream flow days each year. Since the construction of the dams the number of days with stream flow below 100m3/s has plummeted from an average of more than 150 days per year a century ago to less than 50 days today.
So the dams have moderated the high-flow days a bit, and have greatly reduced the number of low-flow days.
The Floods
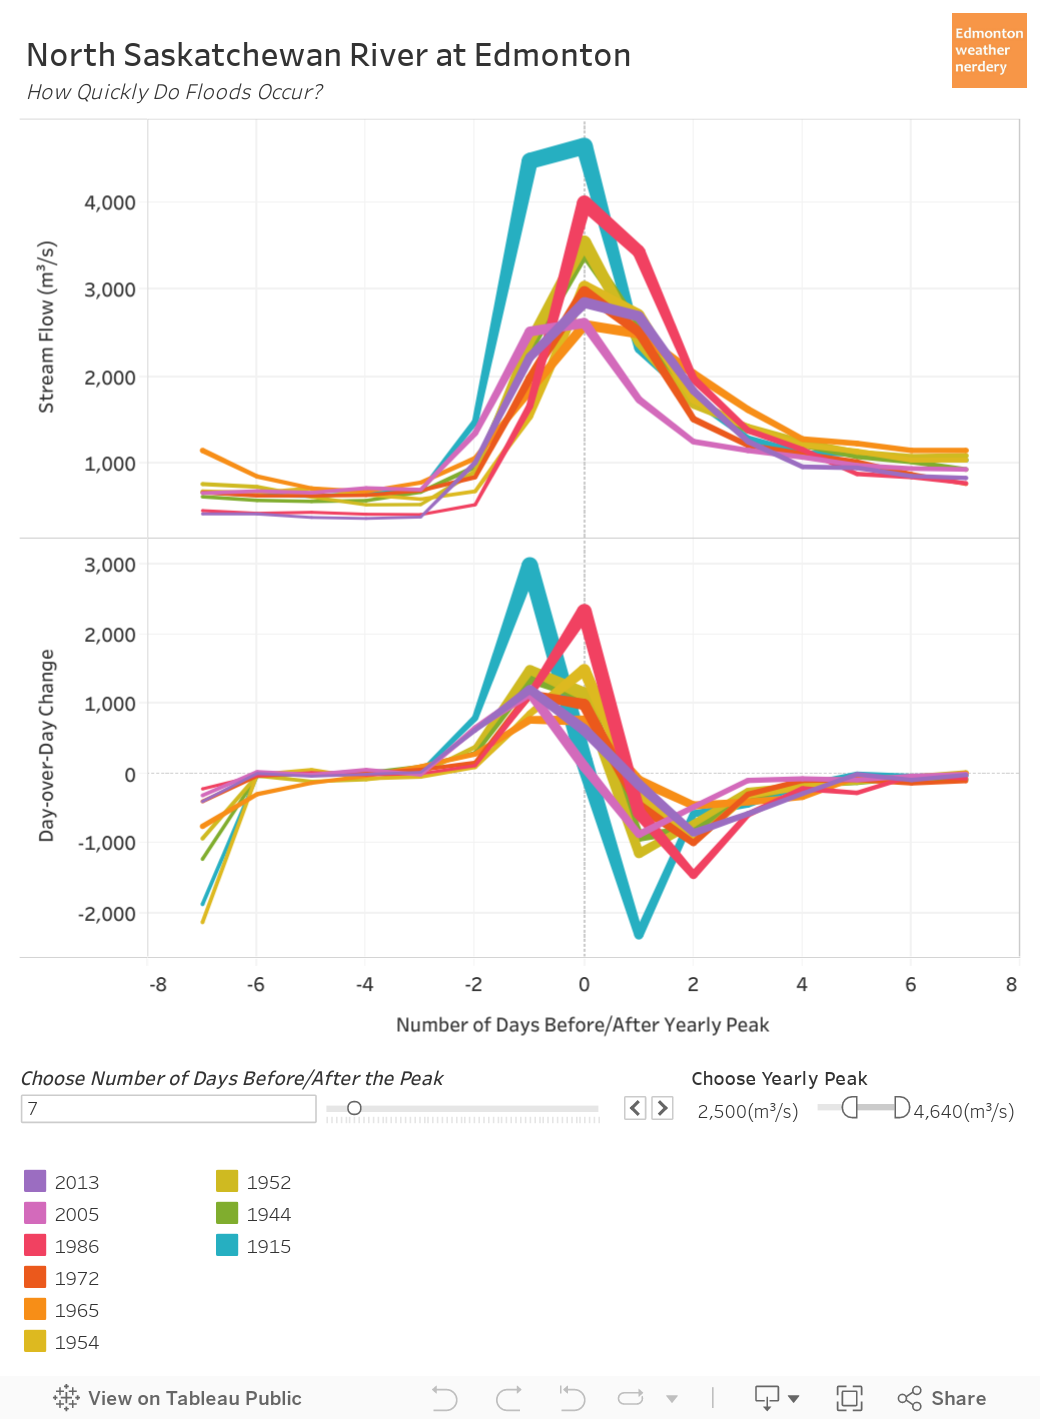
And finally, in this dashboard we can compare how quickly the streamflow changed in the days immediately before and after Edmonton's historic floods. The first chart shows the streamflow each day, and the second shows the day-over-day difference.
Our most recent big flood in 2013 ramped-up from 400m3/s to 2,847m3/s over the course of 3 days. And then by 4 after the peak things were back down to around 1,000m3/s.
The great flood of 1915 took 2 days to go from 700m3/s to 4,470m3/s, and then on day 3 it increased a little bit more to 4,640m3/s. Then within 4 days it was back down to around 1,000m3/s. For a bit of trivia: during Calgary's big 2013 flood the Bow River peaked at 1,840m3/s and the Elbow peaked at 700m3/s, for a combined total of about 2,540m3/s.
Comparing all of these curves the ramp-up typically takes 2~3 days to go from average~ish to peak, with volumes that are 8x, 10x or even 15x above average. And then things ramp down a bit more slowly settling at around 1,000m3/s after a week.
And that's it for our big look at the North Saskatchewan River in Edmonton. I hope that this will be one of the more comprehensive discussions of the river that you will ever find, but if I've missed anything please let me know in the comments, or send me a message on twitter at https://twitter.com/yegwxnerdery.
Hello,
ReplyDeleteI would like to know the website where you got this interesting river depth data from.
Thanks