2019/07/21

Top of the Summer - 2019

It feels like summer has only just begun, but July 22rd is roughly the peak of Edmonton's summer.

Here's how things have gone so far this year:


From mid-June to late-July we have been below average, and that shows up here as blue. And the past month hasn't just been below average, but was also below where we were for a chunk of May and early-June.


This dashboard shows the number of hot days each summer.

So far 2019 has had 11 25°C days, which ranks it as #118 out of 139. It's way down from the past 4 summers which all had 25-38 25°C days, but still above 2011 & 2005 which were both down at only 6. And so far in 2019 we've had 45 days which hit 20°C, and that ranks as #93.

The good(?) news is that the peak of summer lasts for a few weeks:


Our average temperature along with the 25th & 75th percentiles (where temperatures will fall about 50% of the time) stay reasonably constant for about two-and-a-half weeks, until August 9th. After that though they start to slowly fall as we slide ever further into the abyss.


Here is the dashboard again, except that this time it is looking at the back-half of summer, from July 22 onwards:


For the rest of the summer we average about 42 more 20°C days, including about 18 more at 25°C.

2019/07/14

Hot & Cold Days - Dashboard

Today we are going to take a look at two more interactive dashboards, and these ones will let you look at Edmonton's history of really warm & really cold days.

We talk about temperatures a lot around here, and these old posts have some detailed discussion on what we will see in the dashboards:


But now let's look at the dashboards:

Warm Days Each Year Dashboard


Cold Days Each Winter Dashboard

Both dashboards work the same way, but the warm days are grouped by Year (Jan-Dec) while the cold days are grouped by Winter (Jul-Jun).

Now we will take a look at some examples of how these can be used:

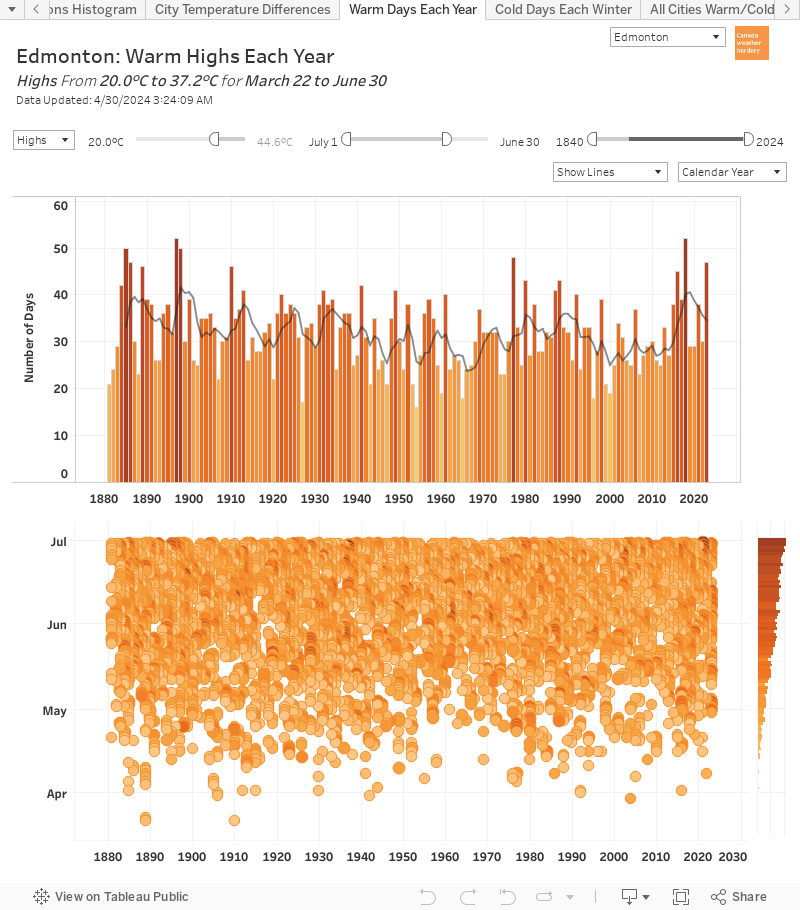
Warm Highs Each Year

The simplest thing we can do with these dashboards is to see all of the warm days for each year. This example image is for Highs of 25°C, but we can change that to 20°C or 30° or even 0°C.

With all of the history we can see which years had a lot or a few warm days, how things have changed over time, and when throughout the year the warm days occur.


Cold Lows Each Winter

And here's the cold version of the previous example, with the number of -25°C Lows each winter. Last winter 2018-2019 had more than average, but over the last century that average has fallen from close to 40 -25°C Lows each winter down to about 10.


Extremes: 33°C Highs

We can also use these dashboards to look at extreme temperatures. In this example we have all of Edmonton's Highs of 33°C or more, going back to 1880.


Late Frosts

Here we are looking at the history of frosts after May 15. To keep things simple we've limited this to recent years from 1985 onwards.


Slow Summers

The summer of 2019 has gotten off to a slow start, with a cold June & early-July.

Here the dashboard shows the number of 25°C days each year between June 1 & July 12. 2019 had 5 days, which is definitely on the low side of things, and is well below the last 4 years, but it isn't record-breakingly cold.


Early Winters

Here we have all of the -20°C Lows that occur really early in the winter, from mid-October to mid-November. The ridiculously cold Halloween of 1984 shows up with its low of -24°C.


Melty Winter Days

This chart shows how many High above freezing we get each January. This is something we've talked a lot about on this blog in the past, because Edmonton has always has mid-winter melts. But in recent January's we are at the top of the range, and it's less variable with most years being up over 10.
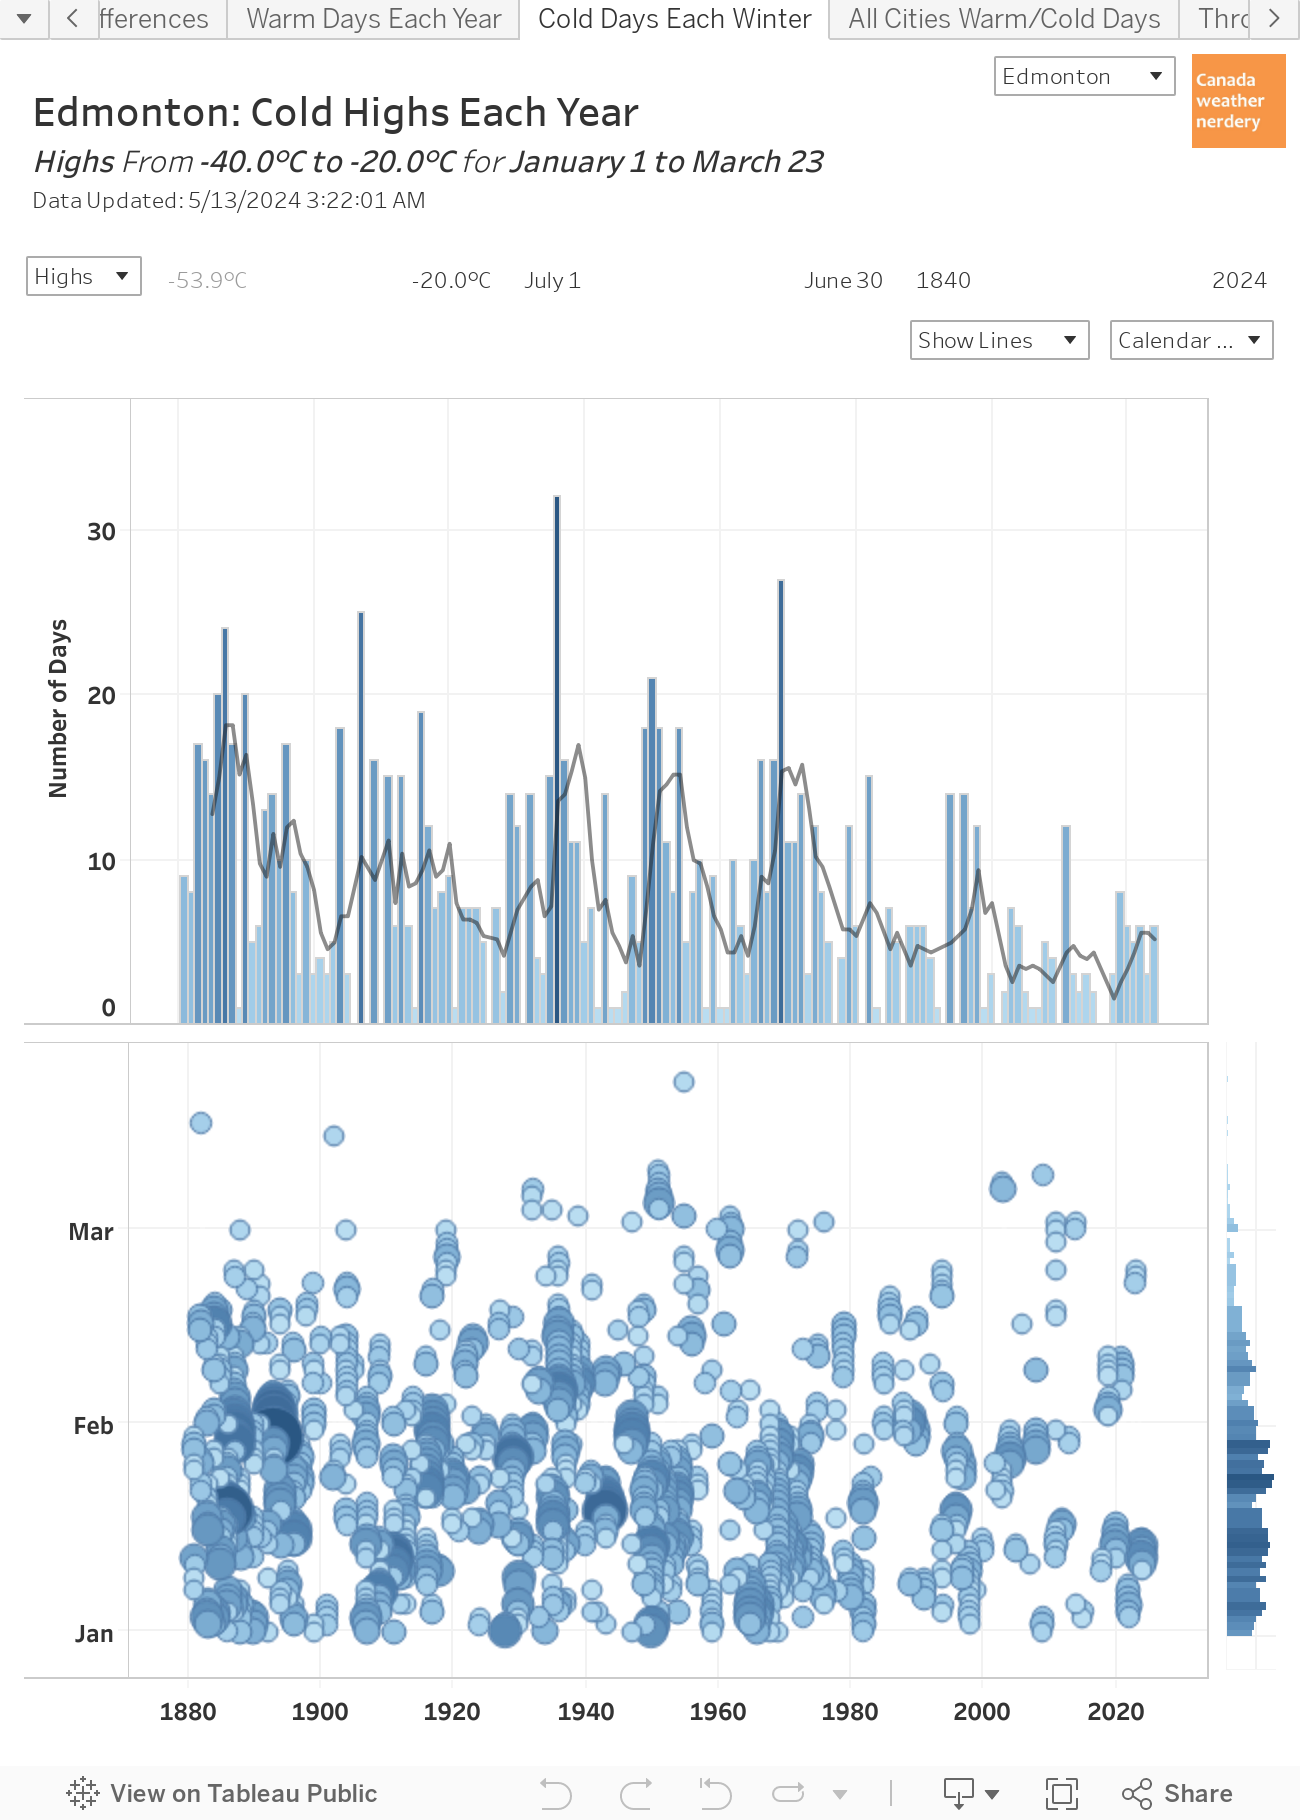

Cold Februarys

And finally, the February of 2019 was really cold - but how cold was it? Here we have the number of -25°C Lows each February. 2019's 16 was well below the records from back in the 1930s, but it was about 10 more than any February since 1979.

That's it for our tour of these two dashboards. They provide lots of interesting ways to slice and dice the data for Edmonton's warmest and coldest days.

2019/07/13

Daily Temperatures & Precipitation - Dashboard

Recently I have built a whole bunch of interactive dashboards to help visualize weather data. In the next few posts we will be taking a closer look at them to see how they can be used.

Today we are going to start with an easy one: Blatchford's High Temperatures, Low Temperatures, and Precipitation going back to 1880.


For these instructions I will be linking to fixed images, but this widget will let you try things out.


Daily Temperatures & Precipitation

If you were curious about Edmonton's history of Christmas you can set the data to December 25, and you will get the daily history going back to 1880:
  • The daily High temperatures for each year, along with the 30-year average, and the record warmest & coldest.
  • The daily Low temperatures, 30-year average, and records.
  • The daily Snow (grey), Rain (blue) or total Precipitation (green).
    For 1880-2007 the Blatchford station measured Rain and Snow separately, but that changed and for recent years only the total Precipitation (Rain & Snow combined) is available.
So that's fun. But you can also use this chart to select multiple days:


Weekly Temperatures & Precipitation
Here we have the same chart, but this time "Choose Day(s)" is set to include December 25-31.

Here we have the average temperatures & total precipitation for the whole week from Christmas to New Year's. This could be done for a week, or a few days, or a few weeks.


Monthly Temperatures & Precipitation
Taking things one step further here we are looking at the entire month of December. You could also select several months, to combine the summer months of June, July & August together.


Recent Years

And finally, if more than a century of data is just too much you can use the "Choose Range of Years" to filter the results down to a more reasonable range.

So that's it. It's pretty simple, but it provides a lot of flexibility to poke around through the data. This is just one of several new dashboards, and some of the others are accessible using the tabs at the top of the widget. In future posts we will spend some time going through all of them.