2017/04/25

Record Watch - Snowy April

And why not one more...


From Environment Canada's updated numbers, on April 24th 2017 moved into top spot as the snowiest April ever recorded at the International Airport. With 43.2cm it just barely edges out 2002, which had 43.1cm.

So 2017 is the overall soggiest, as well as the snowiest.

As I was saying yesterday, we still have quite a way to go to catch the older records from Blatchford...but it's okay if we don't:

2017/04/24

Record Watch - Soggy April

As I type this on April 24th, it's snowing again.

A few weeks ago we looked at April Snowstorms, and before that it was April Showers. Today we're going to combine the two, because the International Airport has now recorded more Rain+Snow in April 2017 than during any other April. (and there's still a week to go...)


Here we have the totals of Rain and Snow for April 2017.

Combining the two together we're now well into 1st place with 68.4, above 2nd place 1990 which was down at with 60.6. 

And with 40.2cm of Snow alone, we're currently the 5th snowiest April, still a bit below 1st place 2002 which had 43.2cm. Although again, it's snowing again right now.

Rain+Snow vs. Total Precipitation


Environment Canada tracks 3 precipitation measurements at the Edmonton International: mm of Rain; cm of Snow; and mm of Total Precipitation.

Total Precipitation is usually the sum of the Rain + Snow, but since Snow is fluffy and it's measured in cm, Environment Canada converts that to a mm-equivalent by dividing by 10. So 1cm of Snow = 1mm-equivalent of Precipitation. That's shown in the last line of the example above, with 0.2mm of Rain, 0.6cm of Snow, and 0.8mm of Total Precipitation.

That's how it normally works, but sometimes there's a bit of a discrepancy and Total Precipitation does not quite match Rain+Snow. Here are the comparisons of the two for all of the Aprils at the International:


For a shoulder-season month like April I think it's nice to see the breakdown between rain and snow, but Environment Canada's "official" measurement is Precipitation, rather than just adding Rain+Snow together. And in terms of Precipitation 2017 is at 66.5mm, slightly below the combined 68.4 that we saw above. That's still enough for 1st place though, compared to 1990 in 2nd place at 61mm.

I don't know how Environment Canada decides when there is a difference or not? The largest gap here is 2002, with 48mm of rain+snow, but only 33m of precipitation. The second largest is 1968, at 5mm. And then it drops to the 2mm or 3mm mark, which is where April 2017 is.

This isn't a a huge deal, but to avoid any confusion I wanted to mention it.

Blatchford

The Edmonton International isn't a perfect match for the City of Edmonton, but in recent years the Precipitation data for Blatchford hasn't been great, so that's why I use the International instead.

Blatchford used to have good data though, so here it is, going back to 1881. Strangely enough, at Blatchford the 5 years that had the most Rain + Snow all occurred before records at the International started.

1955 had the most, with 88.1mm. That's still well above our 68.4mm for 2017, although 2017 would fall in the 3rd spot. And there's still a week left in April 2017. And it's snowing again right now.

I'll take a complete look at where April's precipitation ends up next week during the monthly review.

2017/04/18

2016-2017 Winter in Review - versus Calgary

Today we're going to look back at the winter of 2016-2017 again, this time to see how things compared between Edmonton and Calgary. This is a battle-of-Alberta that Edmonton will never win, but it's something I'm always curious about.

We've looked at Calgary weather plenty of times before, but that has been averages and trends, where today will be more of a day-by-day comparison.

This will also be focusing on November-through-March, even though as I write this in mid-April Edmonton is in the midst of Winter Part 2: The Revenge while Calgary and everywhere else have moved on to spring. But anyway...

High Temperatures

Here are the daytime High temperatures for Edmonton and Calgary, for this past winter from November through March. There were 96 days when Calgary was warmer than Edmonton, and 49 when Edmonton was warmer.

The fact that Calgary is generally warmer than Edmonton should not come as a surprise. But what I do think is interesting, is just how closely the temperatures track one another. We can see here that the temperatures in Edmonton and Calgary followed the same rollercoaster - albeit with Edmonton shifted down a few degrees on some days.

We've talked a lot about chinooks in the past, and this winter almost everytime that Calgary broke above the freezing mark Edmonton did too. The only time that Edmonton went one way and Calgary the other was in late November, when Edmonton was around freezing but Calgary jumped up to 10°C. (although it's also happening right now in mid-April)

With this chart it's tough to get a sense of how the gaps compare, so next we'll take a look at the actual temperature differences.

High Temperature Differences

Here we have the difference in daily High temperature for Edmonton and Calgary.

In this chart the orange days (on the positive side of things) are when Edmonton was warmer, and the red (into the negative) are when Calgary was. When Edmonton was warmer it was usually only by a few degrees, but when Calgary was warmer in some cases it was by 5°C-15°C.

Breaking it down by month:
  • At the end of November we can see that two-week stretch where Calgary was 5°C-10°C warmer than Edmonton. 
  • In December things were fairly balanced 
  • For January Calgary was solidly warmer
  • In February Edmonton actually spent a good portion of the month warmer than Calgary
  • And to end off, in late-March Calgary warmed up to spring-like temperatures a few days faster than Edmonton did.


Here we have the same chart, but this time it shows the average temperature difference, as well as the 10 biggest differences.

The average difference varies throughout the winter. For December and February it hovered around 0°C, and even crept onto the Edmonton side of things at the end of February. In early November and January Calgary averaged about 3°C warmer. And in late-November and late-March Calgary averaged 5°C warmer.

The largest gap was 15°C on March 13, with Calgary at 9°C and -6°C Edmonton, as Calgary recovered from the mid-March deepfreeze much more quickly than Edmonton did. And we can see that the really large 10°C-15°C gaps usually only happen one day at a time. Calgary isn't 10°C warmer for a whole week, but it is 10°C warmer the day that a chinook moves in, and then Edmonton usually catches up a bit the next day (although mid-April is going to make a liar of me).

In total, there were 6 days when Calgary was 10°C or more warmer than Edmonton, and 30 when it was 5°C or more warmer. On the flipside, Edmonton was 5°C warmer than Calgary only once, on February 27.
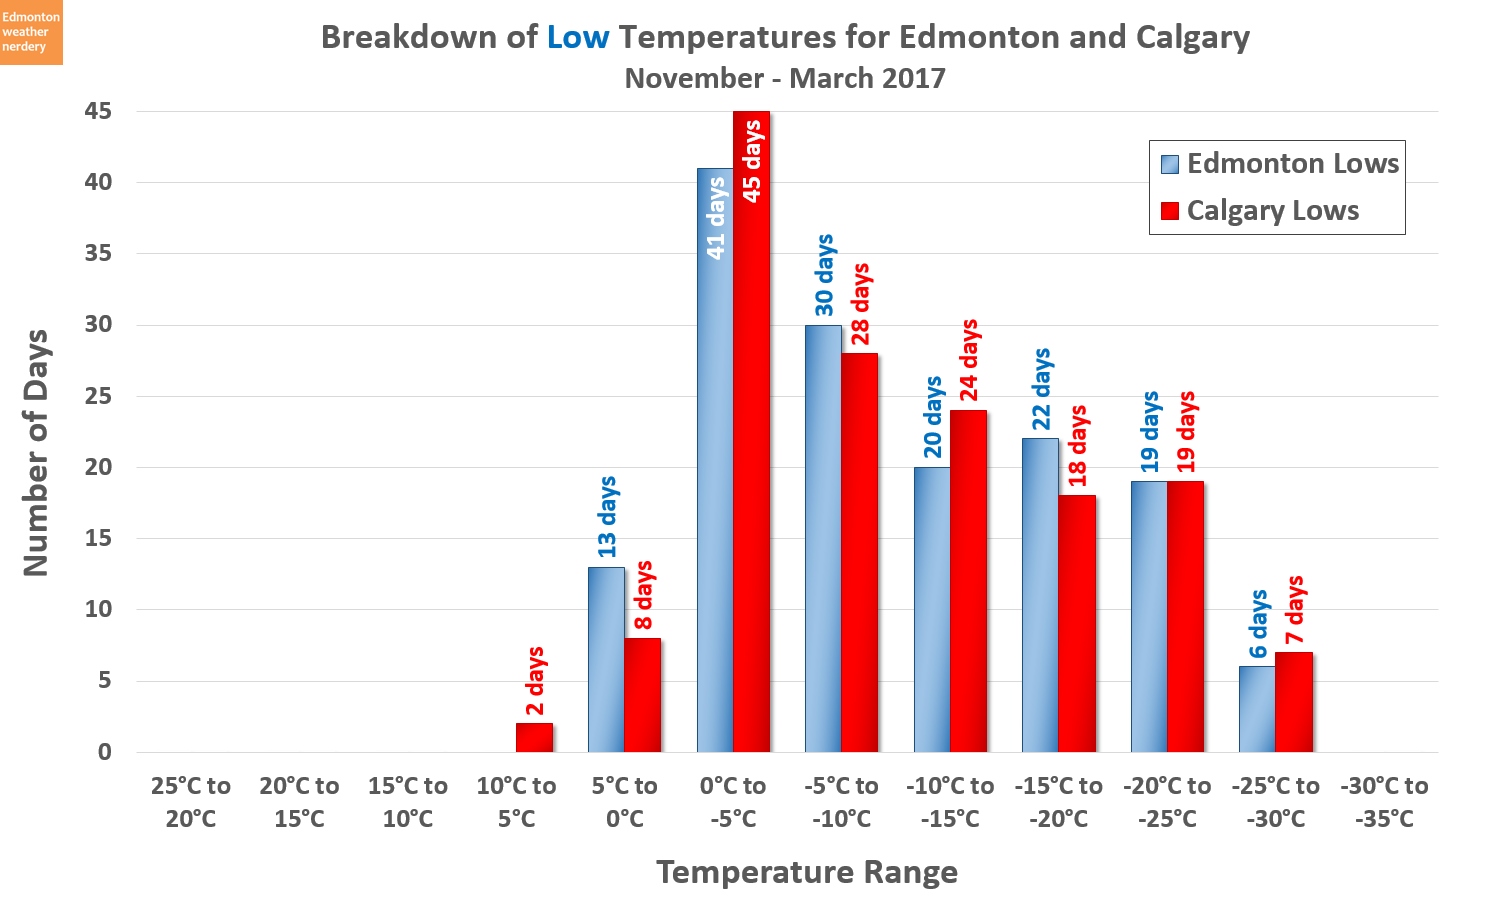
Low Temperatures

Here we have the daily Low temperatures for Edmonton and Calgary, and here things are a little bit more balanced than what we saw for the Highs. This winter there were 79 nights when Calgary was warmer than Edmonton, and 76 when Edmonton was warmer.

And again, the temperatures in Edmonton and Calgary follow a very similar path.

Lets take a closer look at the temperature differences again:

Low Temperature Differences
Here we have the difference in Low temperatures for Edmonton and Calgary. Days where Edmonton was warmer show up on the positive side in blue, and warmer Calgary days are into the negative in red.

Breaking it down by month again:
  • For November Edmonton's overnight lows were pretty consistently warmer than Calgary's 
  • December was balanced between the two cities
  • January's lows in Calgary were generally warmer than Edmonton's
  • And them February and March were a mix


Here we have the 7-day average difference, as well as the 10 largest differences.

The average difference varies from about 3°C warmer for Edmonton to about 3°C warmer for Calgary. As we saw with the last chart, Edmonton was warmer in November and Calgary was warmer in January, but the other months are more of a mix.

The two largest gaps were 9°C: on February 8 Edmonton dropped to -21°C while Calgary fell to -30°C; and on March 14 Calgary warmed up to -1°C while Edmonton was stuck down at -10°C. The rest of the top 10 are split between Edmonton and Calgary, and range between 5°C-8°C difference.

Temperature Breakdown

Finally, here are how the High temperatures add up for the two cities.

For November through March Calgary had 2 more days between 20°C-25°C, 2 more between 15°C-20°C, 8 more between 10°C-15°C and 4 more between 5°C-10°C.

That's a total of 16 more days above 0°C for Calgary, with Calgary breaking above freezing on 85-of-151 days, and Edmonton managing 69-of-151.


For the Low temperatures things are pretty similar between the two cities. Edmonton had 3 more nights above freezing than Calgary did, and Calgary had one extra night below -25°C. Although this is with the caveat that we're comparing Edmonton Blatchford to the Calgary International, which is something that we've looked at in great detail before.

Snowy Months

Temperatures are only part of the story of winter though, so now we're going to switch over to snow to finish things off for the day:


When we look at the monthly snowfall totals, we can see that monthly average for October through February are pretty similar for Edmonton and Calgary. But Calgary's spring tends to be snowier, with higher averages in March, April and May.

2016-2017 was a little bit more complicated than that, though. We had about 10cm more snow than Calgary in both October and November, but then Calgary had 10cm more in December. January was pretty similar for the two cities. Then Calgary had a very snowy February with 36cm compared to our 9cm. Then in March we had about 10cm more again. And now, as of mid-April we're well above our average for the month, and Calgary is still below theirs.

Cumulative Snow

When we add all of that up over the course of the winter, this is where we end up.

For the early part of the winter Calgary was below Edmonton, but their snowy December pushed us into a tie, and then their very snowy February put them in the lead. But all of the snow that Edmonton just received at the start of April pushed our cumulative total up 124cm, and just a little bit above Calgary's at 120cm. Going back to the averages again, between now and June Calgary would typically get more snow than we would, but looking at the current forecast for Edmonton, who knows?

Conclusion

So today was another marathon. But now we've really dissected one specific winter, instead of always looking at averages. This wasn't necessarily a "typical" winter, although I'm not sure that any are? But it's interesting to see how closely the temperatures tracked, what the temperature jumps from chinooks really look like, and how much the snow can vary between the cities.

2017/04/16

April Snowstorms

A few days ago we looked at April Rainfall, but with the recent weather it feels like April snowstorms are a more pressing concern.

Monthly Snowfall

I've said in the past that April is on-average about as snowy as February, but as of April 15th we're well past our April average. At 29cm April is now actually our snowiest month of the winter, beating out March at 27cm and October at 22cm.

April Snowstorms

This bubble chart shows all of the April snowfall events at the International Airport, going back to 1961. A snowfall "event" here is the total from several consecutive days of snow, and the bigger the bubble, the more the snow.

In the past 3 days we've received 24cm of snow, which makes it the largest snowstorm this winter - beating two 12cm storms in early-October and early-March. And earlier this April on the 3rd we got what seemed like a lot of snow, but it was actually only 4.2cm.

To make it easier to compare 2017 to previous years, lets bring in some numbers:


Here we're focusing on the big snowstorms. Since 1961, the International had 24 snowstorms in April with 10cm of snow or more, and 7 with 20cm or more.

The largest April snowstorm at the International was 40.7cm on April 6-7, 1991. And with 24cm from April 13-15th 2017, our recent snowstorm is actually the 4th snowiest April snowstorm ever recorded at the International.

In 2002 and 2004 we had similar, large snowfalls during this same week of April - 28.1cm and 19.2cm respectively. And both 2003 and 2008 had snowstorms around the 20cm mark even later in April. So this sort of thing is not uncommon, but it has been a few years since one of these happened - the most recent large~ish April snowfall was back in 2014 with 10.4cm.

Bubble charts can make it a little tough tough to get a sense of scale, so lets look at these snowfalls in a different format:


Here we have the daily snowfall as a 3d landscape, instead of the bubble chart.

I'd said previously that the largest April snowstorm was in 1991, and it appears here as the largest peak. The other ~20cm snowstorms are also all pretty visible, with our 24cm in 2017 off on the far right side.

In early April we can see plenty of little snowfalls, and in the middle of the month there seems to be a strange cluster of 15cm~20cm days. But then as we move into late April the number of snowfalls tapers off, although we still see some big days.

One final caveat, though:

This is the history of our snowfalls for May. And during May we get snow about half of the time. Sometimes it's a just a little bit, but sometimes it can be a lot.

2017/04/13

Easter Long Weekend

Today we'll take a look at the recent weather history for Easter.

Temperatures

Here are the High and Low temperatures for each Easter long weekend, going back to 1995.

Easter is a little strange, because it moves around a lot. Since 1995 the earliest that Easter fell was March 21-24 in 2008, and that latest was April 22-25 in 2011. For Edmonton weather, the difference between late-March and late-April can be the difference between winter and spring.

The coldest recent Easter was 2002 with Highs below 0°C and Lows around -10°C. 2002 was also one of the years with an early Easter on March 29-April 1. And the warmest recent Easter was 2000 with 2 days above 20°C, and it was one of the late Easters on April 21-24.

The average High for all of these years was 10°C, and the Low was -2°C. The last few Easters have all been pretty unremarkable, and have just hung around that average.

And even though the Easter of 2017 is pretty late in April, it looks like we're going to be on the cold & snowy side of things.

Rain & Snow

Earlier this week we saw that April isn't a particularly rainy or snowy month, and that's the case for Easter as well. 2014 was a fairly late Easter from April 18-21, but it still had 6cm of snow. Easter 2009 was a little bit earlier on April 10-13, and had 6mm of rain across the 4 days.

Based on all of the snow that is currently in the forecast, it looks like the Easter of 2017 could be a notable one.

And with that, I think we've now got all of the holidays covered.

2017/04/09

April Showers

We've had a few rainy days here to start things off in April. Environment Canada doesn't track historic data on May flowers (that I'm aware of, anyway), but today we're going to look at what it has to say about April showers.

Rainy Months

Here we have the typical distribution of rain for each month of the year, going back to 1995.

If you've been to Edmonton Weather Nerdery before this chart might look pretty familiar, but today is actually the first time that I've ever used it. In the past few months we've spent a lot of time looking at a similar chart for snow, and last summer we looked at total precipitation (rain + snow). But this is the first time that I've looked at rain by itself.

The average rainfall for each month is the white line in the middle of this chart. It's surrounded by a band for the 25th-75th percentiles, which is where we'll fall about half of the time. And then there are the 2nd highest & 2nd lowest amounts since 1995, and then finally the very highest & lowest.

The recent average rainfall for April is 15mm, and the rain we had this weekend has already pushed 2017 up above that to 21mm. The rainiest April since 1995 was in 2010 with 39cm, and that was still below the average rainfall that we get in May, which is 42mm. And May is well below June, which is well below July. So April in Edmonton is not a particularly rainy month.

2016 Rain & Precipitation

April is a shoulder-season month though, and it might get rain one day and then snow the next. So this chart shows how the amount of rain compares to the total precipitation (rain + snow), using 2016 as a reference.

June, July and August are the only months of the year which are fairly reliably snowfree, and so the centre section of this chart is pretty consistent, whether we're looking at rain or at precipitation. But all of the other months will typically see a combination of rain and snow, and so the chart for total precipitation shifts up a bit.

That shift isn't huge though, because we really don't get that much precipitation (rain or snow) during the winter. I've mentioned this before, but our average precipitation in July is 93mm, compared to a total of 87mm for all 5 winter months from November-through-March combined.

April Rain or April Snow?

Since April will usually get a mix of rain and snow, here we have the rain and snowfall amounts separated out, going back to 1995.

There is a lot of variation from year to year, but the 5-Year averages tend to be in the range of 15-20mm of rain and also 15-20cm of snow. In the last 5 years we've ranged from a very low 2016 with 5cm of snow and 4cm of rain; to 2012 with 24cm of snow and 36cm of rain.

Last week I was saying that we might see a bit more snow this spring, because right now we're only at 4cm while the average is about 20cm. But as is always the case, the average is skewed a bit by the really snowy years. In the 22 years that are shown here, there were 8 other Aprils which had 6cm of snow or less. So 2017 could stay as one of those low-snow Aprils, or we might get another storm? But then May also gets some snow about half of the time.

In terms of April showers though, with 21mm so far we've already had more rain in April 2017 than in 17 of the last 22 years. And there's more in the forecast for this week.

2017/04/06

2016-2017 Winter in Review - Snow (so far)

Earlier this week we took a look back at the temperatures of the winter of 2016-2017, and today we're going to look at snowfall. Our snow isn't necessarily over yet, because we'll probably have a few more snowy days in April or May. But today we'll work with what we've got, so far.

This will be a quick run through of all of the snow charts that I've got, and most of them are based on data from the Environment Canada weather station at the International Airport. The Airport isn't necessarily a perfect representation of the city, but snow measurements at Blatchford in the past few years have not been good. If there is Blatchford data available though, I'll include it for comparison.

Snowdepth

We've looked at snowdepth quite a bit in the past few weeks, but here's a reminder of where we are in the first week of April.

We got lots of snow in early-October, but were below average for most of the winter, and then dropped very close to 0cm at the end of February. Early-March delivered quite a bit of new snow, but that quickly melted. On March 21st we dropped to "trace"amounts of snow of the ground, and on March 29th we hit 0cm.


Here is a comparison the snowdepth for each winter going back to 1995-1996. The last 3 winters have all had relatively little snow and early melts. But that follows a few years like 2010-2011, 2012-2013 and 2013-2014 which were all quite snowy.


Hitting 0cm on March 29th makes the winter of 2016-2017 the 8th-earliest melt at the International Airport, just behind 2014-2015, and about two weeks later than last year. But 2016-2017 is about a week or two earlier than a "typical" winter, and a month earlier than slow years like 2010-2011 and 2012-2013.

Snowy Days

This chart shows how many snowy days we typically get each month, and for 2016-2017 we bounced around the average, right in the range from the 25th-75th percentile.

This data is from the Airport, which actually did record tiny amounts of snow in August & September - 0.1cm on August 27th, and 0.4cm on September 4th. We've seen that the airport can get much colder than the city though, and on those days it stayed well above freezing in town.


This chart is originally from how often does Edmonton get snowstorms, and it shows how much snow we get during a typical snowfall - 1cm, 2cm, 5cm, etc.

For all of recorded history at Blatchford and the International, about 45% of the time a snowfall is less than 1cm, and about 65% of the time it's less than 2cm. Large snowfalls of 5cm happen about 15% of the time, and more than 10cm is less than 5% of the time.

In 2016-2017, our various snowdays lined-up pretty nicely with the longterm averages. This winter we didn't have any days with more than 10cm, but October 14 was very close with 9.5cm, and our 2nd-snowiest day was 7.6cm on March 4.

Snowy Months

Our snowiest month this year was March, with 27cm, which is not unusual. Our 2nd-snowiest was October though, and at 22cm it was well above the average. December was pretty close to average, and November, December and February were all on the low-side of things.

Cumulative Snow

When we add up all of those snowfalls over the course of the winter, this is where we end up.

For most of the winter 2016-2017 was hugging the 25th percentile, until moving up a bit closer to the average in March. So this was a low-snow year, but not a really low one

Our total average snowfall each winter is about 125cm, and as of the beginning of April we're sitting at 100cm.

Total Snow Each Winter

This is the recorded history of winter snowfall totals, which we first looked at here.

There's a lot of variation from year to year, but an average of about 125cm each winter has been fairly consistent, going back to the start of the 20th century.

In recent winters we've mostly bounced around between 100cm~150cm. Although there have been standouts like 2002-2003 with 225cm, and 2000-2001 at only 38cm. Last winter 2015-2016 was also very low at 53cm.

As of April 4th we're sitting at 100cm of snow for 2016-2017, but there are still two months left:

April & May

Finally for today, here is the same chart that we were just looking at, but this time it is only showing the snow totals for April & May. This is what we might want to expect from the next two months.

At the International Airport, since 1960, the only year that recorded 0cm of snow in April & May was 1998. There have been a few other low years though, and last year was quite low with 4.8cm. The flipside of that is a year like 2003, which recorded 70cm of snow in these two months.

More typically we get about 20cm of snow during April & May, and so far this April we're at 4.2cm (which is not shown on the chart). So everyone should have their 2nd-winter Hobbit-memes ready, because the snow is probably not done with us yet.

2017/04/04

2016-2017 Winter in Review - Temperatures

Today we're going to look back at the winter of 2016-2017, to see how its temperatures compared to other recent years.

I know that everyone has their "2nd winter" hobbit-memes queued-up for the next spring snowstorm, which is pretty inevitable. Since 1960 the only year with no snow in April & May was 1998. It's possible that the snow that we got on April 3rd was it for the year, but there might still be more to come.

But with the start of April our "1st winter" is really over, so lets take a look back. The charts today will all be ones that I've used in the past, and since some of them can be a little bit complicated I'll provide links back to the original explanations.

High Temperatures

Here we have the high temperatures for November through March. This chart highlights the warm & cold records that we broke, and also shows how much time we were above and below the recent average.

In terms of records, we broke 3 all-time record highs: two during the November heatwave, and one during a February chinook. We also had 8 other days which were the warmest since 1996, and 3 which were the coldest.

The red and blue areas emphasize how far we were above or below average. The general story of this winter was:
  • November started very warm, and stayed quite warm for the whole month.
  • December started with a coldsnap, and after that the temperature jumped around.
  • January started with a coldsnap, followed by two warmspells.
  • February started with a coldsnap, followed by a warmspell, before cooling off.
  • March started with a coldsnap, but the month ended a bit above average.
I've said before that "average" ≠ "typical" and we see that here. For the whole winter the temperatures swung back and forth from above the average to below it, and only a handful of days were actually close to the average.

Low Temperatures

The Lows are similar to the Highs: 14 recent warmest days, including 3 all-time records; and then also 4 recent coldest days during the coldsnaps.

Our coldest days this winter were February 7th at -27.4°C and December 17th at -27.3°C, and then four other days at -25°C. The Edmonton International of course got much colder - dropping below -32°C 4 times - which we talked about in versus - The Edmonton International Airport: Part 2.

The Horserace

We first looked at this chart in Edmonton's Warmest & Coldest Winters, and it shows how the winter of 2016-2017 compared to the last 10 winters, and how they all compare to the 20th century average.

When you add up all of the daily temperatures from November through March the winter of 2016-2017 comes in as our 21st warmest overall. That was helped by the very warm November, and the warmspells of January and February.

And of the last 10 years, 2016-2017 was actually our 3rd warmest winter, although it didn't always feel like it. It comes in just above 2009-2010 and 2014-2015, and well below 2015-2016 and 2011-2012 which were in 1st and 6th spots overall.

In the last 10 years the 2 notably cold winters were 2013-2014 and 2010-2011 in 82nd and 86th respectively, and they were even colder than the average for the 20th century. I find that a little surprising, because while I specifically remember that 2010-2011 was a harsh winter, I'd actually thought that 2013-2014 was fairly mild.

Warmest and Coldest Winters

Here is Edmonton's entire history of warm and cold winters. This one also has a bit of a complicated history, which we originally looked at in Edmonton's Warmest & Coldest Winters.

This shows how much warmer or colder each winter was, compared to the 20th century average. In 21st place, an average day during the winter of 2016-2017 was 2.64°C warmer than the 20th century average. That's just above 2009-2010 at 2.60°C and 2014-2014 at 2.58°C. Those numbers are dependent on the timeframe that we use, and will shift if we decided to start counting in October of December instead of November. But today we will stick with November-March, and looking at the most extreme winters, 2015-2016 was 5°C warmer, and 1886-1887 was 6°C colder.

Things bounce around quite a bit, but with the 5-Year Average we can see that since the mid-1970s the winters have generally been quite warm. Although again we see 2013-2014 (-1°C) and 2010-2011 (-1.3°C) were particularly cold, and in the late-1990s there was a string of cool winters.

Coldsnaps

A few weeks ago we looked at the Really Cold Days this winter:

The winter of 2016-2017 had 25 days below -20°C, which is pretty typical. 

When we look at how those cold days were distributed throughout the winter we get this:


Here we have the coldsnaps below -20°C, and the days below -25°C are also highlighted. This is a chart that we first looked at in Coldsnaps & Deepfreezes if you're interested in a bit more background. This chart only goes back to 2010-2011, because showing more years is just too crowded.

Our longest streak of days below -20°C was 6, although December and early-January were pretty busy, with 18-of-the-25 cold days. The longest string of days below -25°C was 3, which is fairly typical for early January. And while the coldsnap in early March seemed like it lasted forever, it was actually only 2 days below -20°C.

Warmspells

The flipside of coldsnaps is warmspells (or perhaps chinooks...) and here we have all of the warm winter days grouped together. This is a little difficult to read, which is ac sort of the point, because we actually get a reasonable number of warm days during the winter.

With 69 days above 0°C and 42 above 5°C we were again pretty typical. The February warmspell is the most notable, with 11 straight days above 0°C, and 6 above 5°C, although the two January warmspells came close to that.

Breakdown

When we take a look at the whole winter, here are how the High temperatures breakdown.

Believe it or not, from November-March about 46% of the days had highs above 0°C. And even during the deepest part of winter from December to February the temperature broke above freezing 33% of the time, and above -5°C about half of the time. With the coldsnaps it's easy to forget the warm days, but this breakdown is pretty consistent for most years.


For Low temperatures there's a lot less orange, because we don't stay above freezing overnight very often.

For this November-March we stayed above freezing 9% of the time (14 days). For December-February it was 4% (5 days), which was actually more warm nights than during last year's warm winter.

For High temperatures we saw that we're above -5°C about half of the time, and the Lows are usually above -10°C about half of the time. That depends a bit on the year though, with cold winters like 2010-2011 and 2013-2014 skewing things a bit.

That feels like a pretty exhaustive look at the temperatures of the slightly-warmish winter of 2016-2017. If you're interested in last year, my less-exhaustive review is here: 2015-2016 Winter in Review. And in a few days we'll take a look at this winter's precipitation (so far).

2017/04/01

March Review / April Preview

Spring has sprung during the last few days, but here's a quick reminder of the temperatures over the last month:

High Temperatures

We started the month with a very warm March 3rd, at 10.5°C. But then we plunged into a cold snap, which included a High of -11.8°C on March 12, which was the coldest March 12th we've had recently. After the coldsnap, the rest of March ranged between average and warm.


Digging into the numbers, with an average high of 0°C this March was a little bit on the cool side. Going back to 1998 7 years were colder, and 12 were warmer.

The early coldsnap shows up in blue, with 8 Highs below -10°C, and 2 below -15°C . But to balance that off we had 7 highs above 10°C.

Low Temperatures

For the Lows we see the coldsnap in early March again - it was not pleasant, but it was still almost 15°C warmer than the coldest early-March temperatures that we've had in recent memory.


With an average Low of -9°C this March was again on the cool side of things.

The coldsnap doesn't look so bad here though, with only 2 days below -20°C, compared to some years which had 9 or 11.

Snowfall

March was our snowiest month this winter, with 27cm of snow of the winter. It was also the only month since October to have above-average snowfall. And even though things are snowfree right now, we do usually get some snow in April, and even in May about half of the time.

Snowdepth

We just took a close look at snowdepth a few days ago. But all of snow that we got in March briefly pushed our snowdepth up to 15cm. Within a week that had almost all melted though, and then a week later we were down to 0cm.

April Temperatures


As we move into April the temperatures take a bit of a step up. There's a pretty good chance that we'll see some days above 20°C, and (less impressively) most days this month should break freezing. We'll still probably see a few overnight Lows below freezing, though.


I've been doing these topographical maps for a few months now, and with the addition of April things are finally starting to make sense (sort of). Where January, February and March all stayed in the same blue-beige range, with April we finally see a real shift into the warmer temperatures.

The end of March marks Edmonton Weather Nerdery's unofficial end-of-winter, so in a few days we'll be back with a 2016-2017 Winter in Review.