2016/03/31

March Review / April Preview

The end of another month means it's time to see how things went.


It was a warm March, with the second most days above freezing in last 20 years, after 2010. It also had the second most days above 10°C with 8, again being beaten by 2010.

It wasn't particularly unusual though. It seems that about half the time March has 25+ days above freezing, and the other years have an extra week or two of colder temperatures (and occasionally much colder temperatures).


This March there were 8 days when the low did not drop below freezing. That ties with 2015 and 2005 for the most warm nights. And there were no lows below -10°C which was similar to 2010. Typically though, March will have anywhere from 5 to 15 days below -10°C.

So what to expect from April?

That's a lot of orange, and not much blue. And it looks like I'll need to change my scorecards at the bottom, because they're not very useful anymore. We'll frequently see a few days in the low 20's. In a lot of years every day in April will be above freezing. And overnight lows are usually above freezing more than half of the time.

This might not be the start of summer, but for me it is definitely the end of winter.

2016/03/24

versus: Rural Alberta & the Heat Island Effect

“Someday from this ragged collection of tents a great city will arise” 
-- Rev. Angus McQueen, 1881
That comes from a piece of public art that is located on Victoria Promenade, and it gives a nice sense of how Edmonton has changed since the 1880's. In the last few weeks I looked at how Edmonton's winters have warmed over the last century, but considering that it has grown from a camp of about 200 people to a CMA of 1.36M wouldn't we expect it to get warmer?

Cities are warm. When a small area is filled with people and vehicles and buildings those all generate heat, and then that heat is retained by all of the concrete and asphalt. This is known as the heat island effect, and it is separate from climate change, because climate change is global while heat islands are local.

To see how much of an impact the heat island effect has had on Edmonton's winters I'm going to look at some of the nearby rural stations. A natural comparison would be the infamously cold Edmonton International Airport, but it only has data going back to 1961. I would like to go further back than that though, and so the Environment Canada stations that I'll be looking at are:


These three stations have 87 years of overlapping data from 1915-1916 through 2002-2003. They also seem to be a nice distance away from Edmonton - not too close, but not far enough that they're into chinook country or past the treeline.

Calmar currently has a population of about 2,100 people, and is 35km as the crow flies from downtown Edmonton. Sion and Campsie are 54km and 97km away respectively, and both are part of the county of Barrhead, so unfortunately specific population numbers aren't available.


To give some context for Edmonton in 1915: from 1911 through 1914 the population grew from 24,900 to 72,516 which included the annexation of Strathcona. But then in 1915 it fell by 18% to 59,339 with the start of World War I and the ensuing recession. By starting the comparison in 1915 we will be looking at a period when Edmonton had already grown into a city, although at that point it may or may not have met the expectations of Rev. McQueen.


These charts are going to have a lot of data, so to try to keep them readable Campsie, Calmar and Scion are all pushed to the background. The specifics of one station are less important than how Edmonton compares to all the rural stations in general

Looking at the average temperatures for each winter, for the high temperatures Edmonton has been fairly middle-of-the-pack over the course of the 87-year comparison. For the low temperatures though, Edmonton is consistently above the 3 rural locations, with gaps typically ranging between 3 and 5°C.


For the number of winter days above freezing, the distribution looks similar to the daytime highs with Edmonton firmly in the middle of all of the stations.

For the days below 20°C though, Edmonton moves to the bottom of the pack (which is a win, in this case). Out of the 87 years, there were only 10 when any of the rural stations had fewer cold days than Edmonton.


And that continues for the very cold days below -30°C and -40°C, with Edmonton consistently recording the fewest. Edmonton last recorded a -40°C in 1972, but for the rural stations that was still an occasional occurrence through the 1990's. And below -30°C the rural stations typically had two or three times more days per year than Edmonton.


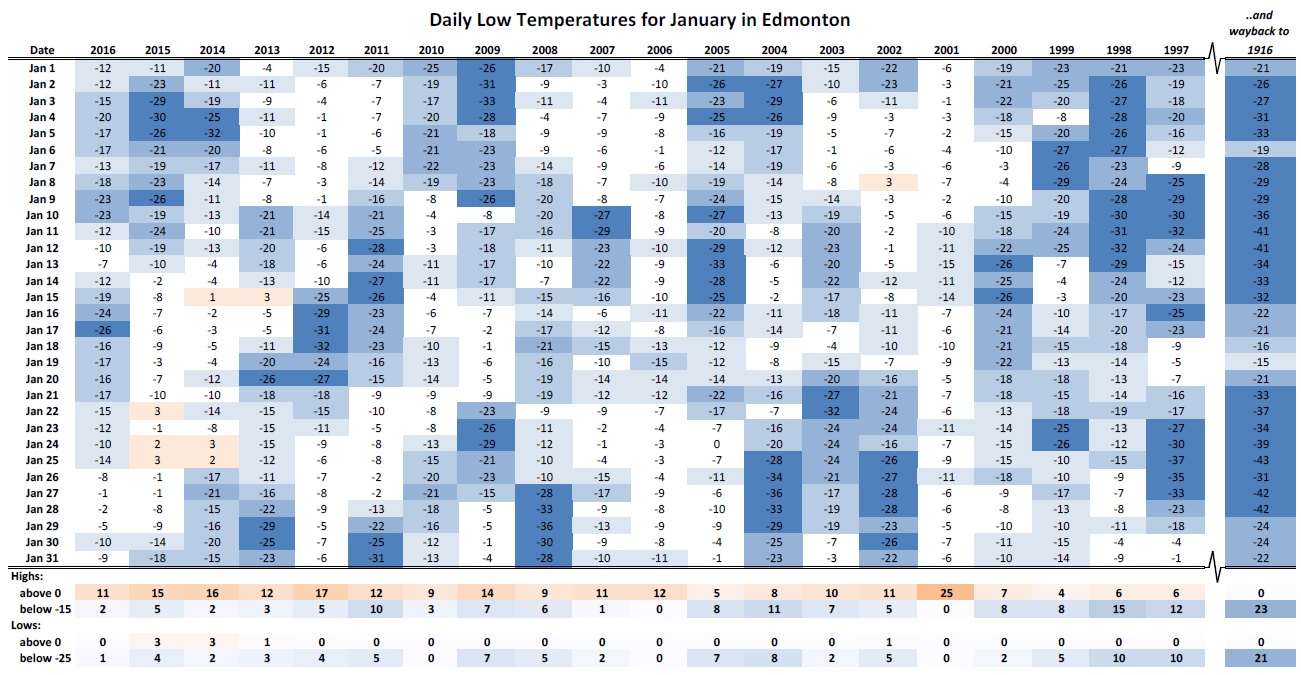
Here are Edmonton's 10 coldest days from 1915-1925 compared against the 10 coldest from 1993-2003. We can see that Edmonton's coldest days have gotten noticeably less cold, from around -43°C to -35°C.

On those really cold days the gap between Edmonton and the Calmar and Campsie stations has actually increased. The rural stations have gotten warmer, but Edmonton has gotten warmer faster. Where Edmonton used to be 3°C to 5°C above the rural stations on the coldest days, there is now a difference of 8°C or 9°C. The Edmonton International Airport is quite close to Calmar, and I assume that this is what we're seeing on those occasions when the airport reports "the second coldest temperature on earth!" while downtown is a comparatively balmy -35°C.


We only get a few super-cold days each winter, and so their impact averaged across a winter is pretty minor. Here we see how the low temperatures have changed for each station over the decades, which smooths out the data a bit. Edmonton is right inline with Calmar and Campsie, with an increase of about 5°C over the 87 year period.


Looking at the trends Edmonton might be warming a bit more than those two stations. These are just "best-fit" lines, but they show that the Edmonton increase is a degree or two faster per century (for anyone curious, the R² are pretty weak, ranging from 0.05 to 0.2). That gap hasn't been reflected in the nominal change over that last 87 years, but that might just be a fluke due to having a cold 1915 and a warm 2003 as the start and end points.

But what's going on with Sion?


I have no idea. Sion has warmed the most of the four stations, with the lows increasing by 2~3°C more than Edmonton's. Is it a microclimate; or is it impacted by nearby industry or a body of water; or is it bad data that is skewing things? I have nothing to compare it against, because unfortunately there aren't any other nearby stations with a similar range of data.

So then what about the heat island effect?

In my last few posts I looked at how Edmonton's winter has changed since the 1880's, but in the background there was always the question of how much of that was due to Edmonton's growth as a city.

It's true that Edmonton does not get as cold as the rural locations, but that was also the case in 1915. We do see some changes at the extremes - the -30°Cs and -40°Cs - but averaged across an entire winter, or just looking at the warm days the results for the rural stations are similar to Edmonton. Sion has warmed more than Edmonton, and Calmar and Campsie have warmed about as much, or maybe a little bit less.

So it looks like the heat island effect might take the edge off of winter's coldest days, which is certainly appreciated. But for the overall warming of Edmonton's winters over the last century, not very much of it is due to the move from tents to highrises.

2016/03/17

136 Years of Walking Uphill Both Ways

Last week I looked at the number of warm days in a typical Edmonton winter, and found that it hasn't changed much in the last century. In the 120 days between November and February we get about 49 days above freezing, and 100 years ago that number was 48. Some decades have had more and some have had less, but on the whole it has been surprisingly consistent.

Today we'll look at some of the ways that winter has actually changed, although I think there are some surprises here too.


Even though the number of warm days hasn't changed much, the daytime high and low temperatures have been increasing. Over the last century the highs have increased by 1.5°C, and the lows are up 3.5°C. In the 1880's the difference between the daytime high and low was 11 or 12 degrees on average, and now that gap has closed to 8 or 9 degrees.

I don't think that averages give a very good sense of what things were like day-to-day though, so for that lets look at temperature ranges again.


Here we have the cold, really cold, and really really cold days.

When I was looking at "warm" days, I'd used anything above freezing as the cutoff point. For the "cold" days I'm going to say that the starting point is -20°C. I don't necessarily love 0°C through -19°C, but -20°C is when the dog starts complaining, when it's maybe time to start thinking about plugging the car in, and when I really need to add layers for bikerides.

Today we get about 20 days below -20°C, compared to 49 days above freezing. That's maybe not the best ratio around, but it would seem tropical compared to the 1880s when it was 44 days below -20°C and 46 days above freezing.


This all seems pretty much as expected: the 10 year period with the most cold days was 130 years ago; the last 20 years have had the fewest cold days; and 100 years ago there would have been noticeably more cold days than are typical today.

One oddity is the winter of 1930-1931, which had only 1 day below -20°C. No other winter has ever gotten close to that. I had thought that 2015-2016 was special with its 6 days, but 1986, and 1995, 2005 and 2011 were all similar. 1930 is in a league of its own, and I'll have to take a closer look at it one day.


The breakdown of all the days below -20°C shows that the number of days in the -20°C to -25°C range has been very consistent, but the really cold days have been slowly disappearing. So generations of Edmonton grandparents weren't exaggerating - it really did used to get that cold.

Lows below -45°C were never exactly an everyday occurrence around here, but they would happen every few years up through the 1930's.

Through the end of the 1940's most years could expect a day or two below -40°C. Then those disappeared for 22 years, showed up again once in 1972, and haven't been seen since.

Currently it's been a little over 6 years since the last -35°C was recorded, on December 13, 2009. That isn't too unusual though, because there was a 7 year gap without a -35°C from 1997-2004, and an 8 year gap from 1954-1962.

The longest stretch without a -30°C was 5 years, from January 13, 1998 through January 21, 2003. Right now the most recent -30°C was last winter, on January 5, 2015.

Just personally, in 7 years of riding to work my low is -31.5°C, and that's not for lack of trying. I would love (/dread) to be able to claim a -35°C, but the weather hasn't cooperated.


So on the whole, Edmonton might not be getting much warmer, but it has been getting less cold.

The recent history though, is - once again - not something I would have guessed.


The reason that I started digging into Environment Canada's weather data earlier this winter was because I wanted to see if I could trust my memory. And it turns out that no, I can't.

For the past few years I have been enjoying (with some shame) what I had assumed were ever-more-Climate-Change-enhanced winters. Other than 2010-2011 these last few years have all seemed so mild. But looking back over the last 30 years, outside of a few nasty ones in the mid-1990's, this has been very typical.

I thought that 2015-2016 was exceptional, but 1986, 1999, 2005 and 2011 were all similar. And while 2014-2015 wasn't amazing, it seemed pretty nice at the time. But from the numbers I don't know that I'd be able to perceive any difference between it and the winters of the late 1980's.

So this has me wondering about a few things:
  • Is my November-February range wrong? It covers the extremes, but maybe the total length of the winter is what colours our perceptions.
  • Does the amount of snow matter most? I haven't looked at that yet, because Environment Canada's precipitation numbers are a little tough to work with. 
  • Do we only remember the really rough winters, and those set low expectations? 
  • Did the closure of the municipal airport to scheduled flights in 1995 do something strange to the temperature readings?
I'm reaching a bit with that last one, but I'd always intended to compare the data from Blatchford against some other stations, and I may have to do that sooner rather than later.

2016/03/10

136 Years of Winter Patio Weather

Lets assume that "winter" runs from November through February. That's 120 days.
(March is a tricky month - usually quite nice, but occasionally not - so for today I'm going to leave it out.)


Of the 120 days of winter about 50 will typically be above freezing, although there is a lot of variation. In 1955 there were only 14 days above freezing, while in 1976 there were 78. Closer to home in 2011 there were 70, or well over half the winter. That's not so bad.

(and for anyone who thinks I'm cheating by leaving March out, it averages an extra 20 days above freezing, which would move the average to 70 days out of 150)

From the chart it looks like the trend is an overall increase, with an additional 2.1 days for each passing century. But unfortunately I'm not sure that there is actually enough data here to properly fit a trendline, because if I remove 1880-1890 then the line flattens, and it actually shows a slight decrease (-0.04 days per century). The limited data available might be too variable to draw that type of conclusion.


Instead of trying to find a trend, lets look at some discrete time periods. Jumping back 100 years, how did the end of the 19th century compare with the dawn of the 21st?


Here we also see a 2 day per century increase, so maybe that initial trendline isn't too far off?

Choosing to go back 100 years is pretty arbitrary though, so instead here are the 10-year periods with the most and the least days above freezing.


Personally, I find it completely amazing that 1898-1907 had more warm winter days than today.

The coldest 10-year period 1964-1973 includes the infamous winter of 1968-1969, which had a 26 day stretch where the temperature was never above -21°C. And just generally the 40's through 60's had fewer warm days than the rest of the century.

There's a strange situation, where if you were born in the 1940's through the early 1970's, and you think "It never got this warm when I was a kid", then you are right - in a modern winter there are about 10 or 15 more days above freezing. But if you were born in 1885 through 1920, your childhood winters would have had about as many warm days as today.


Now admittedly, 0°C isn't exactly patio weather. But I like using it as a baseline because in the middle of winter any day above freezing is pretty nice. And as we've previously seen, a little under half of our winter days will actually be above zero.

As for genuine patio weather, most trips will need to have some form of thermal assistance, because not even a handful of days each winter reach above 10°C. But it's surprising to see that if you are searching for winter patio weather, your best bet might be head back a century. There were 30 solid years with more days above 10°C than we are used to today. The older weather data is a little less precise than the current stuff, and so that might lead to a few extra outliers, but February of 1896 would still have been a nice enough time to head to Whyte Ave.

This also shatters one of my personal myths - I would swear that when I was a kid it was not this warm, and that we didn't have so many false "springs" each winter. But in fact I am wrong, because my childhood decade actually had a few more warm days than we have been seeing recently. I'll use the excuse that I grew up in the chilly suburbs, but the truth is that I was probably just underdressed.

Even though the numbers over the last century are surprisingly consistent, I never want to give the impression that this blog is climate change denial in disguise. I chose to look at the history of "warm" winter days first because I thought the results were genuinely surprising. Anecdotally, I think that most Edmontonians would have expected a much more significant increase. Yes, it is up since the 70's, but even in the last 30 years things have been fairly steady.

Warm days are only part of the picture though, so I'll end off with average temperatures.


Even though Edmonton's warm winter days have been surprisingly consistent since the 1880s, the mean daily temperature has been steadily increasing. And if the warm days have stayed basically the same, then that means the cold days must really be changing. But we'll leave that for another time.

2016/03/09

Data Sources

I'm going to apologize for this one in advance, because it's going to be boring. But I wanted to write just a little bit more about the data that I'm using, and now is as good a time as any. So with that warning out of the way...

Environment Canada has weather data for Edmonton going back to 1880. It is broken up over 3 weather stations:

The first station was located near what would eventually become the CN Rail yards, and more recently the new downtown arena. I don't know what would have been there in 1880 though, since rail didn't reach Edmonton for another 20 years. The second and third stations were located near each other at the City Centre Airport.

There is some overlap in the times that the stations were recording: 1937-1943 for the first and the second station, and 1997-2005 for the second and the third. Since duplicate data is available for those years, I felt that I really should compare the results to see how much they vary.


For the 1937-1943 period the results of the two stations are within +/- 1°C of each other 62% of the time, and within +/- 5°C 99% of the time. And there are a handful that are way off, at +/- 15°C. For the more modern 1997-2005 period there is much less variation, with 87% within +/- 0.5°C, and 99% within +/- 1°C, with the largest gap being 4°C.

I broke the numbers into "Summer" (using the term loosely) and Winter just to see if the variation might depend on the season, and for the 1997-2005 period it really does. For those stations most of the discrepancies occur during the winter, while for the 1937-1943 period it's much more balanced. The 1937-1943 data is also nicely centered around zero, whereas looking at 1997-2005 the third weather station frequently measures about 0.5°C colder than the second station during the winter.

So with all of that said, there's really not much that I can do with this. The data is the data. The second and third stations are in pretty close agreement, even if the third station is a little colder. The original station was a little more variable. I'm not going to use that to try to calibrate the older data, but I will keep it in mind as margin of error. For what I'm doing I'm okay with a few degrees variation.

My approach is to make clean breaks when a new station is available:
  • 1880-1937: First Station #1863
  • 1937-1996: Second Station #1867
  • 1997-today: Third Station #27214
There are several other weather stations near Edmonton - most notably at the International Airport. I don't have much interest in the data from the International, because I don't live anywhere near there. I will definitely take a look at it at some point to see just how much colder it really is, but on a day-to-day basis I won't be using it for anything.

Sorry for the housekeeping, but I wanted to get this all written down somewhere. Hopefully next time will be more informative.

2016/03/05

The Revenant

This year the winter weather in southern Alberta made the news, as a chinook swept through and affected the filming of The Revenant. The movie needed snow, but the unseasonably warm temperatures didn't make for a convincing portrait of the midwest circa 1823.

So that raises the question, what was winter like back then?

I can't speak for the midwest in 1823, but Environment Canada does have data for Edmonton that goes all the way back to the winter of 1880-1881:


15C on November 15, 1880; 11C on December 12; 5C on January 5 and February 23; and 9C during the first week of March. Not surprisingly, it seems as though they really did have chinooks back then too.

Just lining the two graphs up, they're closer than I would have expected. Although a couple of those daytime highs down around -30C are pretty chilly.

If the daytime highs are surprisingly similar, the daytime lows are a different story:


The graphs still sort of line up in a few spots, but generally the 1880 data is shifted down 10 or 15 degrees. When it used to get cold, wow did it ever get cold.  In 2014-2015 the low flirted with -30 twice, but in 1880-1881 it was down into the -40s seven times.


I'm not going to pretend to be an expert on this. These are just two years picked basically at random - choosing a different year one way or the other might tell a completely different story.

I assume that some of the warming seen here is due to Climate Change, while some of it is due to the heat-island effect. Edmonton is now a sprawling city, and its environment and surroundings are very different from however the temperature was measured 136 years ago. I do have some thoughts on how I might try to normalize-out the heat-island effect, but that will have to wait for another time.

For right now, I'm just content to try to imagine living in -44C without modern clothes, or insulation, or heating, or transportation, or plumbing.

The normal temperature for today is...


I don't really like the "normal" temperatures that are reported with weather forecasts. I understand why they're there, but they are not very useful. They're based on the rolling 30-year average, but if you look at 30 years of data for a single day (like March 5, for example)  it's all over the place.

For anyone interested in the statistics, the standard deviations for March 5 are 7.9°C for the high, and 7.8°C for the low. So 50% of the time the daytime high can be expected to fall between -6°C and 4°C, and the actual March 5, 2016 high of 15°C is only likely to occur 2% of the time.

To help me get a better grasp on this variability, I've started putting these together:

This data is also all over the place, but seeing the bigger picture helps me psych myself up for the next month of winter commuting. Because what I really want to know is how many days will probably be warm, and how many will probably be cold, and what's the worst-case scenario for the month, or the best?

And it seems that for most years March will be mild. But every 5 years or so there is a week or two of real nastiness. That's more helpful than a 30 year average.

By the time March rolls around winter is almost over, so I probably don't actually need much of a morale boost at this point.

But even during the darkest depths of January it's helpful:

As cold as January can often feel, in the last 20 years we have always gotten at least a week of days above (or at least very close) to freezing. And many January's are much warmer than that. It's just that there are also the occasional, weeklong, extremely painful cold-snaps to contend with.

A winter without -20C?

-20C (or -4F) is what started all of this, because it's an important number.

My dog loves the winter, but she loves it a lot less when the temperature is below -20C.

And as someone who spends a lot of time on a bike, -20C is where I switch from mid-level gear to "how many layers am I wearing?" gear.

So for me, it is the point where things go from being cold, to being very cold. Below that there is still "really cold" -25C, "extremely cold" -30C, and beyond. But -20C is roughly where things stop being fun.

And as we reached the end of January 2016, I realized that I had not had a single commute below -20C. And then the end of February 2016 approached, and still no -20C. Normally I can expect one or two rides below -30C, and at least a few below -25C. But not even one ride at -20C? Is that unprecedented?


This chart needs a bit of explanation. It is meant to approximate the number of trips that someone would make if they walk or cycle to work everyday. When I go to work on winter mornings it is typically very close to the daily low temperature, and heading home will be close to the high. This chart counts each of those trips, based on the daytime high and low.

And because I've been walking or cycling to work for 10 years, this chart is roughly the history of all of my really cold days. It is just approximate though, because in 2015-2016 I am still personally at zero -20C commutes. I must have had those two -20 days off.

In this 10 year window, 2015-2016 is definitely special. But personally I find 2010-2011 to be the most interesting. That was my second winter cycling, and it had a lot of cold days - basically 25% of the rides from November through February were below -20C.

2010-2011 set a mental baseline for me, and every year since then has seemed "mild", and now I know why. Looking at the last decade, it seems that Edmonton has some mild winters like 2015-2016, some rough winters like 2010-2011, and then everything else is just winter. So it turns out that my memory wasn't playing tricks on me, and the last 5 years really have all been easier. But I should also probably reset my expectations of "normal" to a winter that wasn't the coldest one in a decade.

Looking at weekday temperatures is a bit of a deliberate cheat, because strangely we get a lot of cold days on the weekends. The score that I'm really keeping track of is "Zero -20C commutes in 2015-2016!" and so far that's still holding. It's an important distinction, because during the week I have to go to work, but for a really cold weekend I can choose not to take the dog to the park, and to stay off the biketrails.

This next chart is not commute-specific, and it shows the overnight lows for all 7 days of the week.  In it you can see that 2015-2016 has had a few additional -20C days, but it's still not a very large number.

And one final comment about winter commuting in Edmonton: it's definitely not all blizzards and -30C. Even in the cold years, someone who goes outside every weekday from November through February will see a lot of mild days.


What is this all about?

The winter of 2015-2016 marked my 10th year of either walking or cycling to work everyday. From 2006 through 2009 I had a 3.5km/30 minute walk each way, and from 2009 onwards it's been a 7km/20 minute ride.

And after 10 years, I've started thinking about the weather. And more specifically, about what is a "typical" Edmonton winter day? I feel like the last 5 winters have all been really mild, but is that true? And were things really so much worse when I was a kid? Is my memory of this stuff accurate at all?

Thankfully, Environment Canada has allowed me to answer my questions by making historical weather data easily available on their website. For central Edmonton the records are available back to 1880, although they are broken up between 3 weather stations:


I consolidated all of that into one spreadsheet. There is a bit of overlap between the stations (1937-1943, 1996-2005), but for simplicity's sake, whenever a new weather station is available I take its numbers instead of the older station. A cursory look does show variations of +/- 1C between the stations, but for what I'm doing I'm fine with that.

This is not going to be rigorously scientific or statistical. My main goal is to try to make sense of my experiences as a year-round "active" commuter in Edmonton.

This is also not about Climate Change. There are climate scientists who know much more about that than I ever could. I'm just playing with 130-odd years of weather records, and making some charts.