We will begin, as always, with Edmonton vs. Calgary.
Edmonton & Calgary: 30-Year Average Temperatures
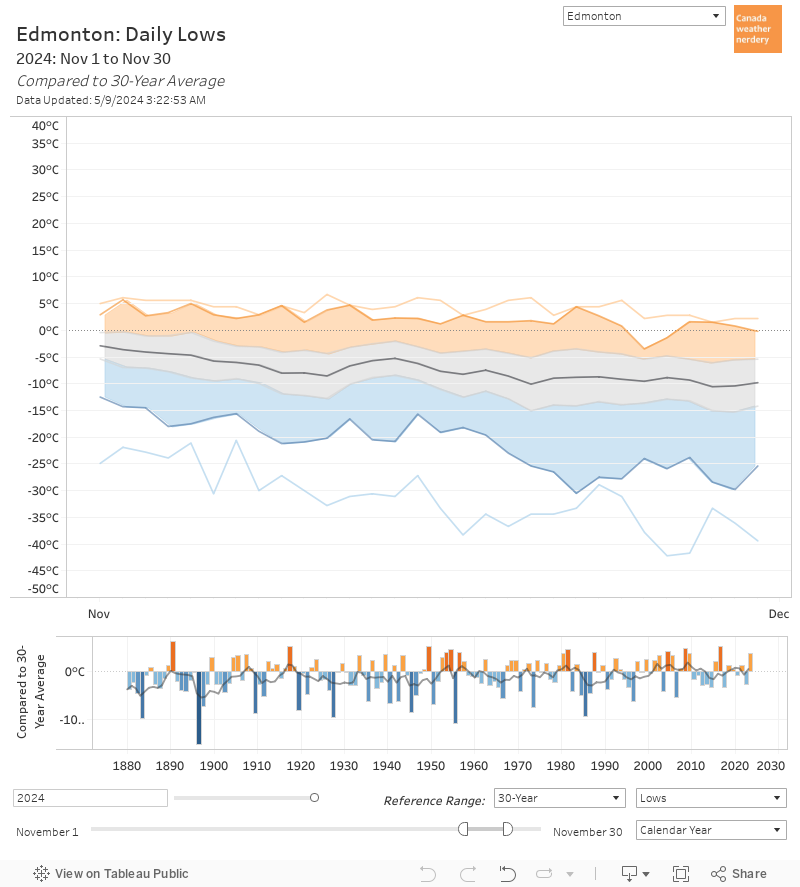
Here we have the average daily temperatures for Edmonton and Calgary. For complicated reasons this chart unfortunately doesn't have a legend, but Edmonton is the darker blue, and Calgary is lighter. The top half shows the High temperatures, and the bottom half has the Lows. The linecharts are the temperatures themselves, and the barcharts are the differences between the two cities. And if you hover over the dashboard it will give the numbers for the various days.
We will talk about this more in detail in a bit, but in general we can see:
- Edmonton's average Highs during the winter are quite a bit cooler than Calgary's - the difference is about 4°C or 5°C for December & January.
- Edmonton's average Lows during the winter are only a bit cooler than Calgary's - the difference in January is about 2°C.
- Edmonton's average Highs for May & June are maybe a degree or two warmer than Calgary's .
- Edmonton's average Lows for May-September are about 2°C warmer than Calgary's.
The biggest differences are during the winter, and so I think it will be easiest if we flip this chart from January-December to a more winter-centric July-June:
Edmonton & Calgary: Winter-centric Version

Here we have the same data that we were just looking at, but this time it runs from July-June so that the winter falls in the middle of the chart.
And for the Highs we can see that Edmonton and Calgary are pretty close for most of the year, but things start to diverge around November and then join back up around April. The big difference in the average Highs peaks in mid-January, with Calgary's average at around 0°C and Edmonton's at -7°C.
For the Lows during the summer Edmonton is usually a few degrees warmer, but then as we move into winter that flips and Calgary is a bit warmer. That also peaks around mid-January, with Calgary at -13°C and Edmonton a few degrees cooler at -16°C, but the difference is much less than with the Highs.

Edmonton & Winnipeg

And as usual, after looking at Calgary here we've moved on to Winnipeg.
For the average Highs during the summer Winnipeg is 3°C or 4°C warmer than Edmonton. But in the winter that flips, and in January & February Edmonton's average Highs are 5°C to 7°C warmer than Winnipeg's. If you switch the dropdown in this dashboard to Calgary, their average Highs in January are 10°C to 12°C warmer than Winnipeg. Calgary's average Highs bottom out at about -4°C, for Edmonton it's -8°C, and for Winnipeg it's -13°C.
For the average Lows Edmonton and Winnipeg are fairly similar during the summer, but then in the winter Edmonton's Lows are 8°C to 10°C warmer, and Calgary's are 10°C to 12°C warmer. Calgary's average Lows bottom out at about -16°C, for Edmonton it's -17°C, and for Winnipeg it's -23°C.

Edmonton & Montréal

These dashboards have the data for 9 Canadian cities, and we won't go through all of them here, but we will do one more example with Montréal. Not surprisingly, on-average Montréal is warmer than Edmonton for most of the year. But what might be surprising is how close the average temperatures are in January-March.
For the Highs the biggest gap is in November & December, with Montréal about 7°C warmer than Edmonton's cool falls. For February, March & April that difference basically disappears though - Edmonton gets colder days than Montréal, but also more warm ones. And in the summer Montréal's average Highs are about 3°C warmer than Edmonton's.
For the Lows things are similar, with Montréal about 7°C warmer than Edmonton in November & December, about the same in January & February, and then about 4°C warmer for most of the year.
Here's a look at Edmonton, Calgary & Winnipeg all compared against Montréal. In January & February Calgary's average winter Highs are actually about 4°C warmer than Montréal's. And Montréal is pretty consistently warmer than Winnipeg, although the summer Highs are similar.

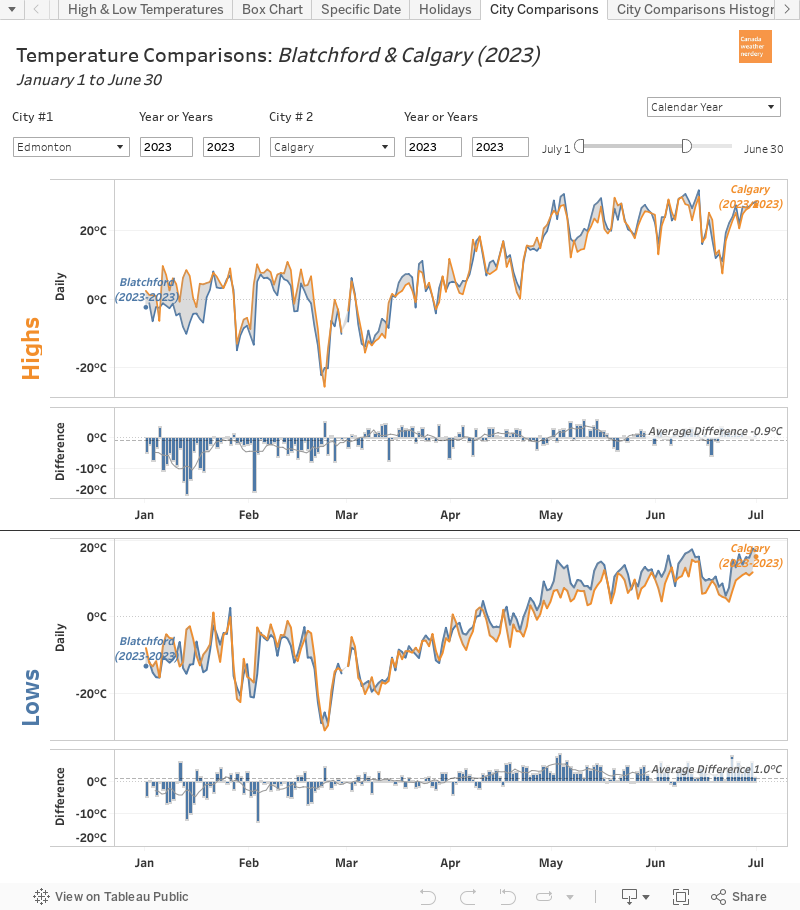
Edmonton & Calgary: 2019
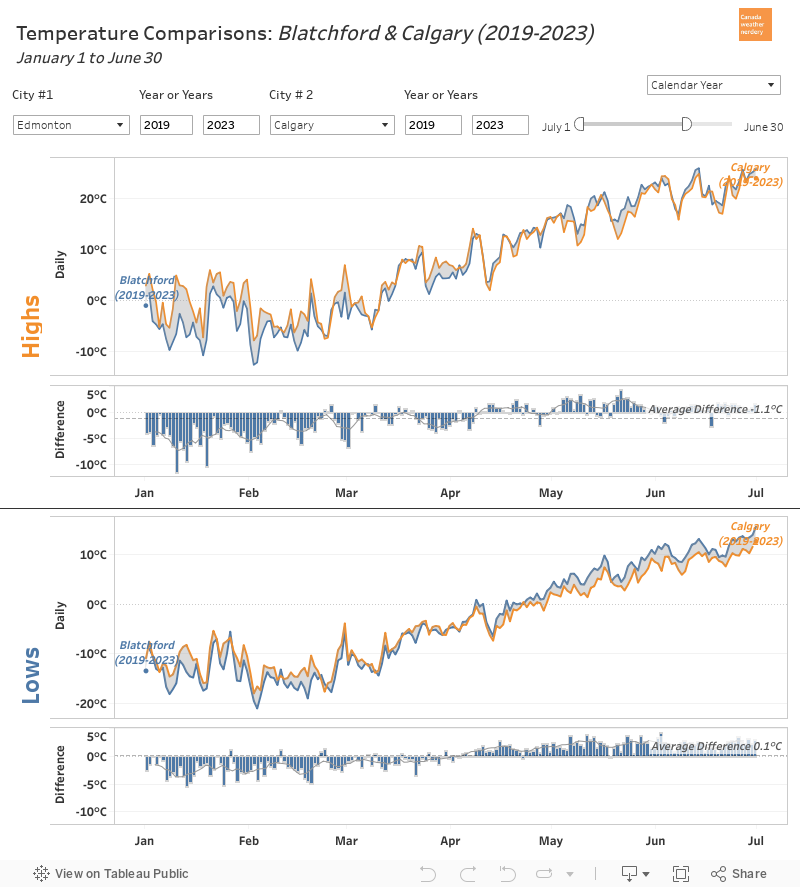
Everything that we have looked at so far today has been 30-year averages, but this dashboard can also be used to compare a single year. Here we have the temperatures for 2019 for Edmonton & Calgary.
The daily temperatures for the two cities follow each other very closely - the extremely cold February 2019 shows up in the Highs & the Lows for both Edmonton & Calgary.
The largest gap 18.7°C on January 10th with Calgary's High up at 9.8°C while Edmonton's was down at -8.9°C. The largest gap for Edmonton was 12°C on May 21st, with Edmonton at 19.6°C and Calgary at 7.6°C, and that was part of an entire cool week for Calgary.
Edmonton History
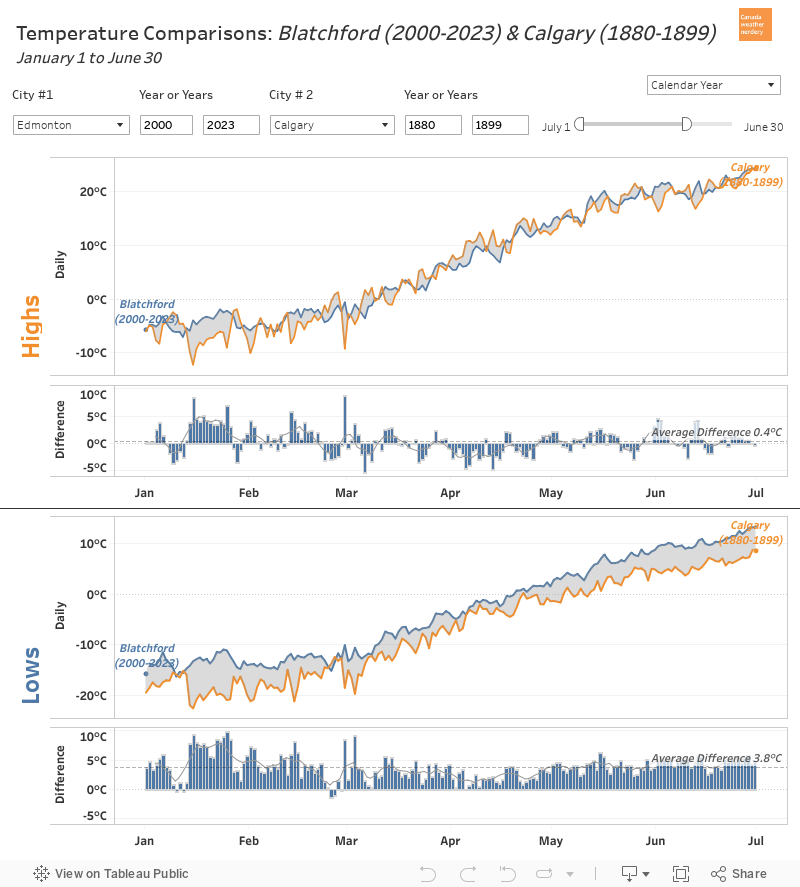
One other thing that we can use this dashboard for is to compare Edmonton's current temperatures to its past. Here we have the 20-year average for 2000-2019 compared to 1880-1899
Unfortunately because of the way this is set up both eras appear in blue, but in the bargraph a value that is above 0 means that 2000-2019 is warmer, and below 0 means 1880-1899 was warmer.
For the Lows we can see that modern temperatures are warmer than they used to be for almost the entire year (with a weird little exception right around December 8th). Typically modern Lows are about 4°C warmer than they used to be, but in January & February that increases to 8°C to 10°C.
For the Highs January & February have also seen the biggest changes, warming by about 6°C. For the rest of the year the Highs are a little more variable. For the summer months of July, August & September the modern average temperatures are a little bit warmer, but generally by less than 1°C.
For some context here we have 2000-2019 vs. 1880-1899 for Edmonton, Calgary, Winnipeg and Montréal. It's easiest to focus on the bargraphs, and the patterns for Edmonton, Calgary & Winnipeg are all quite similar, with lots of warming in the winter, and a year-round increase in Low temperatures. Montréal is a bit different though, also seeing an increase in late-summer High temperatures.

This chart is the same idea, but it cycles through all of the years since 1880 for Edmonton. Watching all of the years roll by the big changes really start to happen in 1980-1999, and then 2000-2019.
Blatchford & The Edmonton International: 2019
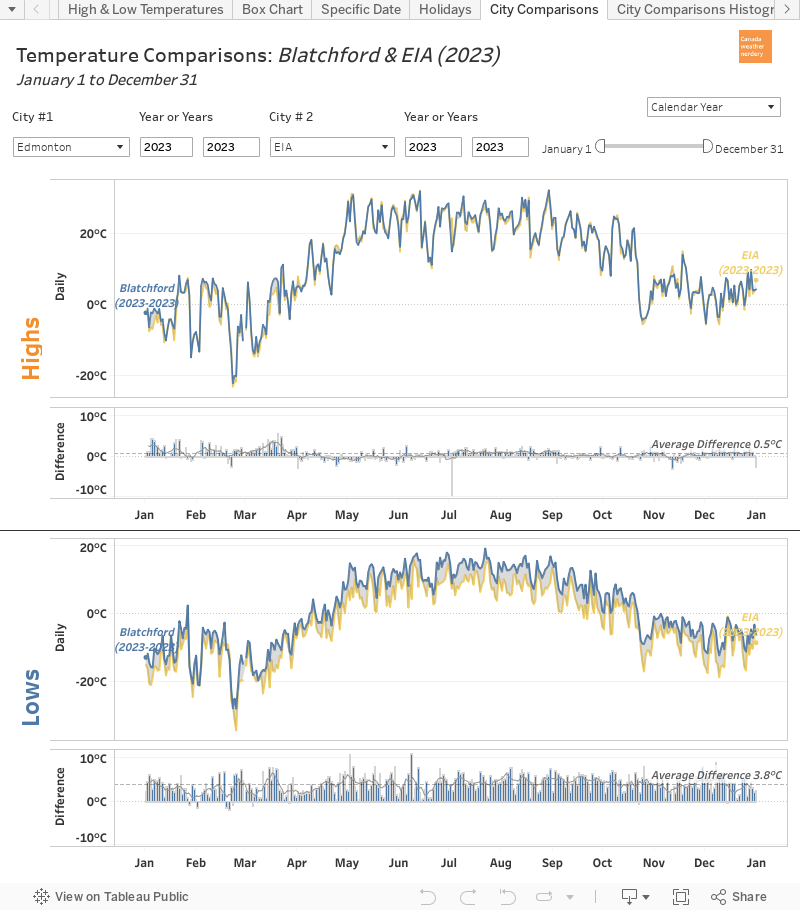
One final thing that we can do with this dashboard is compare the temperatures of downtown Edmonton (Blatchford) to the International Airport.
For the average High temperatures the two stations are fairly close for most of the year, with the biggest gap happening in the spring with Blatchford about 1.5°C warmer than the International. For the average Lows the International is about 3.5°C colder than Blatchford for most of the year.
Those are just the averages though, so let's look at one specific year:

Daily data is a little bumpy, and so here it's easiest to focus on the bargraphs. For the Highs we see a lot of spikes in March with Blatchford 5°C or 8°C warmer than the International.
For the Lows, for some of the very cold days in February there was a 10°C or 12°C difference between the stations: on February 4th Blatchford hit -29.5°C while the International was at -39.5°C; on March 2nd Blatchford was at -28°C with the International at -36.9°C, and on March 6th Blatchford hit -19.1°C with the International at -29.2°C.
You might think that Blatchford is warmer just because it's the big city, but we can compare the airport to a few other outlying stations:

Blatchford tends to be the warmest station in the region, but Stony Plain's winter Lows also average about 4°C warmer than the International. For Namao and Ft. Saskatchewan the differences are not as big, but they're also both consistently warmer than the airport. We have talked about this before, but when the airport gets cold it gets really cold.
And that brings us to the end for today. All of these examples were Edmonton-centric, but the data is also available for Vancouver, Calgary, Winnipeg, Toronto, Ottawa, Montréal & St. John's.