2016/11/30

November Review / December Preview

Daytime Highs

After our little heatwave at the beginning of the month the High temperatures dropped down to right around the 20-year average.


With 9 days above 10°C this November had more than any year going back to 1997. But the average high of 5°C was a little bit lower than November of 2009, which was more consistently warm for the whole month and which didn't have a single High below 0.

Daytime Lows

After the heatwave the Low temperatures had a similar drop, but still stayed about 5°C above the average through the end of the month.


With 9 nights above 0°C, none below -10°C, and an average overnight low of -2°C this November had the warmest lows, going back to 1997.

This was also the first November since 2009 that didn't have any temperatures below -20°C. In the last 6 years those sudden blasts of real-winter have been a fixture of late November.

Precipitation

Overall precipitation for the month was right around the average. The Edmonton International is missing snowfall records for this month, but in the downtown area we didn't get more that a light dusting all month. Downtown did, however, get a few genuine November downpours.

December

For December, looking at the High temperatures about half of the time we can see a fair number of oranges, for temperatures above 0°C or even 5°C. And not surprisingly, we also see some blues for highs below -10°C or even -20°C. But really, there's a lot of orange in there, isn't there?


For the Low temperatures, December nights above 0°C are pretty rare: 2014, 2011, 2004, 2002, 1999 all had some. And lows below -20°C are almost a given, with the only years without them being 2011, 2002, and 1997.

Warmest-Recorded-Year

Finally, with one month left in the race, 2016 is still in the lead for warmest-recorded-year. The heatwave at the beginning of November was enough to undo the coldsnap of early October, and right now things are very tight.

To gets "points" during the next month December doesn't have to be hot - it just has to be above the 20th century average which is about -6°C for the High and -15°C for the Low. Days that are warmer than that will send the line up, and colder days will drop it down.

December of 1981 was warm, but then its final week really dropped off with several days around -30°C. And right now our forecast for next week is calling for some -20°C's. So we might have to wait until New Year's to know exactly where 2016 will end up.

2016/11/28

Does Edmonton Get Chinooks? Part 1

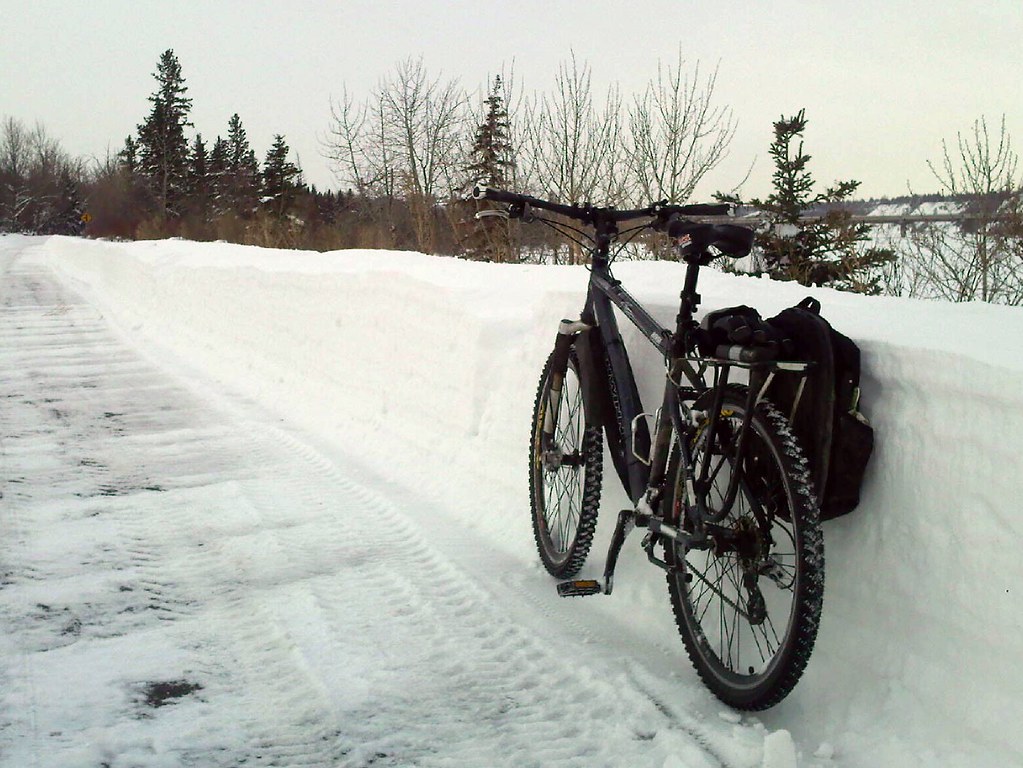
I was all set to talk about blizzards today, but since there's no snow on the ground that doesn't really feel appropriate. So instead we're going to look at chinooks.

I think that most people in Alberta will be familiar with the term "chinook", but I never know how widely known it is elsewhere? I won't copy the entire wikipedia entry, but the name is a reference to the Chinook people from what is now Oregon and Washington, and a chinook is when air from the west coast spills over the Rockies bringing dry, windy and unseasonably warm winter weather.

The sourthern part of Alberta up through Calgary is famous for chinooks, with temperatures swinging from below freezing to above 15°C in a few hours. That leads to folklore like:
A man rode his horse to church, only to find snowdrifts piled so high that only the steeple stuck out of the snow. So he tied his horse to the steeple with the other horses, and used a snow tunnel to get into the church. Upon his return a few hours later all the snow had melted, leaving the unfortunate horses dangling from the church steeple.
That story honestly poses more questions than it answers, but my question is: does Edmonton get chinooks? We don't often see winter temperatures as high as 15°C, but we do certainly see 5°C and even 10°C. Since we're further from the mountains maybe we get baby-chinooks, or chinook-echos?

Just as a caveat, I'm not going to look at the actual mechanism of chinooks, or whether coastal air really does make it's way all the way to Edmonton. I'm just going to look at temperatures to see how often we get changes that could be maybe considered chinook-like.

Today is Part 1 and (spoilers) there won't be any answers. Those will have to wait until Part 2.

To get started, exactly how warm do temperatures have be to qualify as a chinook? Googling around, I can't find an easy answer, so we're going to look at a few approaches.

Warm Days

I found this 50-year-old study online which I'm going to use as a starting point: Richmond W. Longley (1967) The frequency of winter Chinooks in Alberta, Atmosphere, 5:4, 4-16

Richmond W. Longley (1967) The frequency of winter Chinooks in Alberta, Atmosphere

Longley hints at what I'm interested in - we might not get the same warm extremes as the southern part of the province, but we get something. Is it enough to be called a chinook? That paragraph mentions three different temperature ranges:
  1. 50°F (10°C) - the real chinooks of southern Alberta
  2. 40°F (4.4°C) - a compromise, where at least there will be some melting
  3. 30°F to 35°F (-1°C to 1.6°C) - nice enough, but not really something you write folktales about
Because I'm not sure where Edmonton falls, I'm going to look at all three. And to keep things nice and metric the ranges will be rounded to 2°C, 5°C and 10°C.


Here we have the number of days above 2°C, 5°C and 10°C for December-February going back to the 1880s.

For days above 2°C we get between about 15 and 30 days. There have been some low years like 1992-1993 which only had 1, but also years like 2011-2012 with 39, and last winter with 34.

For days above 5°C we get between about 5 and 15 days. And days above 10°C are fairly rare, with many years that don't have any during December-February.

To get a better sense of the trends, here is the same data with the 5-year averages added as dotted lines:


Looking at the averages, during December-February we get about 23 days above 2°C, and about 10 days above 5°C. Those three coldest months of the year have 89 days (90 in leap-years), and so we break 2°C about 25% of the time, and for 5°C it's about 11%.

One thing that stands out here is that the number of days above 10°C has dropped off in the last 100 years - the average used to be 2 or 3 days per year, but now it's down below 1. We actually saw this before, in one of my earliest posts.

Whenever I see strange numbers from a century ago I start to question the data. Edmonton has had a few weather stations over the years (which I talked about here). The first switch happened in 1937, and looking at this chart 1937 is about the point where the frequency of those 10°C days really drops. And when I'd compared the data from the stations, I'd found that the oldest 1880-1937 station was more variable than the newer ones. So it's possible that in the olden-days we really did get more warm days in December-February than we do today, or it's possible that the older data was a little less precise. For now, we'll leave it as a mystery.

If days above 10°C are a little bit hit-or-miss nowadays, then what is the warmest temperature that we do reliably get in December-February?


Here we're looking at the number of warm days each December-February, going back to 1995.

We can see that we get days above 10°C about half of the time, and some years get two or three of them. Days above 8°C or 9°C are a little more reliable - almost every year has had an 8°C day. But days above 7°C are the only ones that we should really count on, because every year since 1995 has had a least one, and in many cases several.

So going back to Richmond Longley's definition of a chinook, for December-February we don't really see many days in the 10°C range, but 5°C and 2°C are pretty reliable.

Day-over-Day Temperature Changes

Looking at warm winter days is all well and good, but it seems to me that chinooks should be sudden. It's not just about the warm temperatures, but also about the rapid shift from cold to warm. So next we are going to look at how the temperature changes from one day to the next.

Last year a blogger from Calgary named Matt Chernos looked at chinooks in this post: Are the number of chinooks increasing (in Calgary)? Matt mentioned the same difficulty of finding a quantitative definition of a chinook, and he ended up using three measures:
  1. daytime high of at least 5°C, with a day-over-day increase of at least 5°C
  2. daytime high of at least 8°C, with a day-over-day increase of at least 5°C
  3. daytime high of at least 2°C, with a day-over-day increase of at least 7°C
If those are good enough for Calgary, then they're good enough for me.

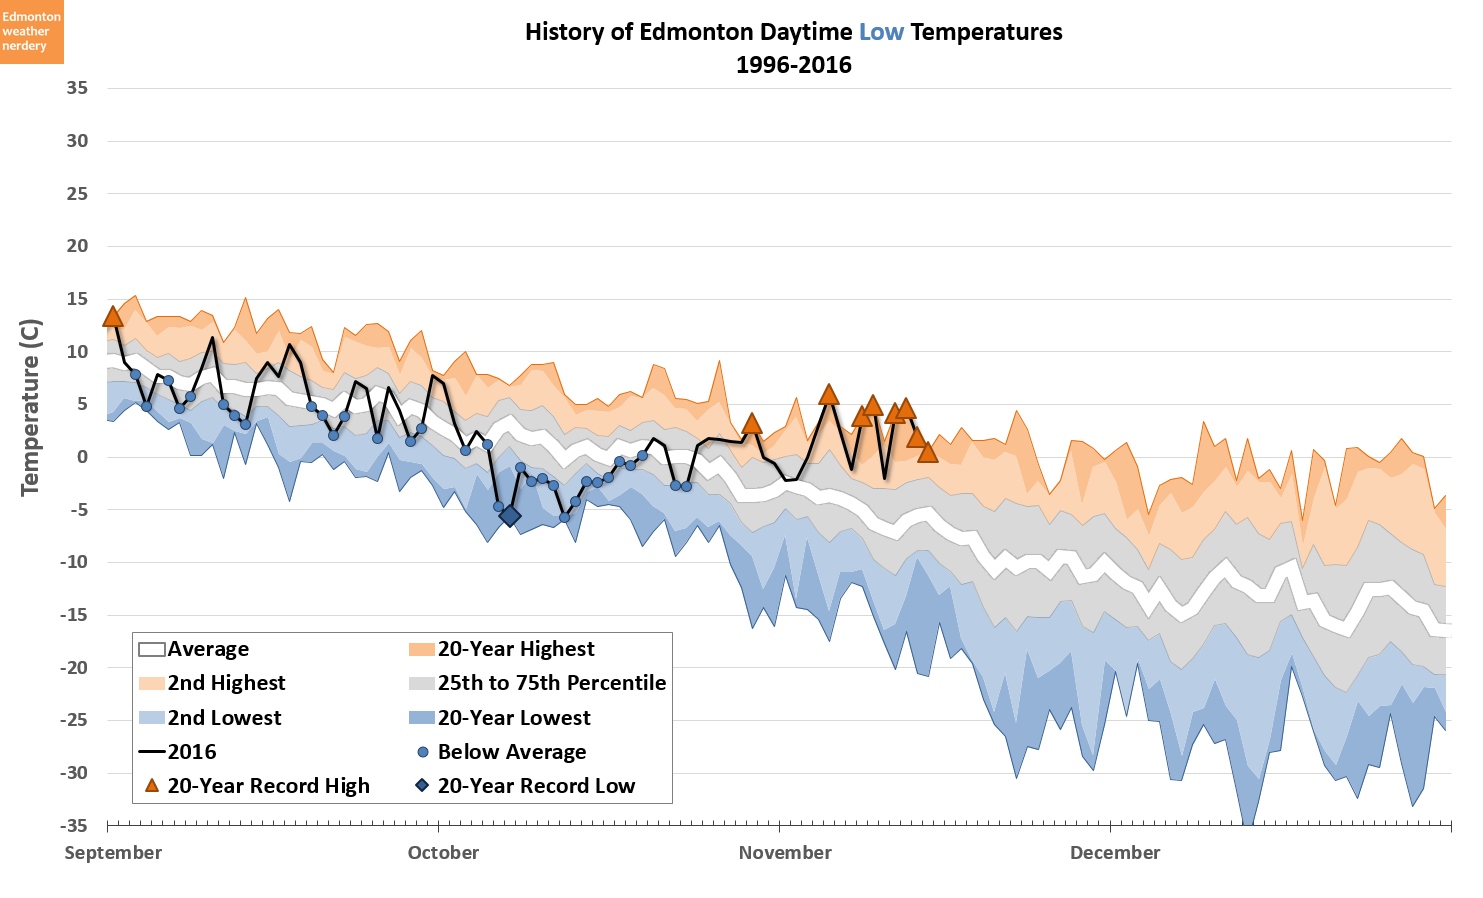
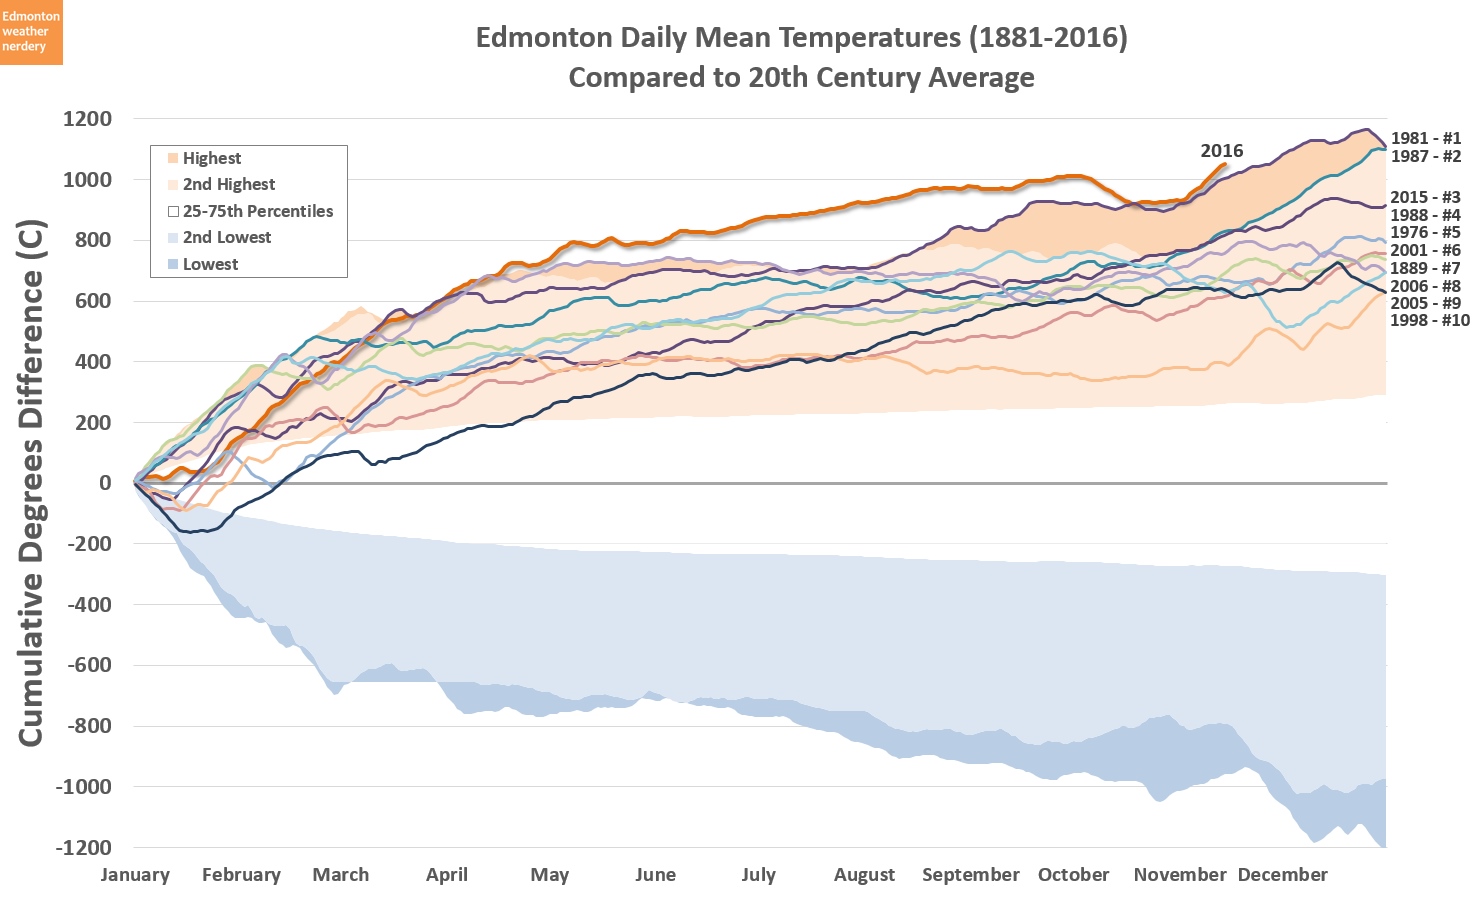
One thing that I do like about the previous warm-days approach was restricting it to December-February. Not that chinooks can't happen in November (we just had a nice, big one this year) but November & March both have plenty of days that are naturally going to be warm, and counting those as chinooks seems like cheating. I want to look for truly unusual temperatures, so I'm going to stick to the real depths of winter.


This chart is a mess, so I'll talk about it really quickly and then move on.

This shows the number of these "chinook" events each year: blue is days with a high of at least 5°C and a day-over-day increase of at least 5°C; green is 8°C with a 5°C increase; and red is 2°C with a 7°C increase.

The data is really noisy though, so lets look at the averages to smooth things out:


And hopefully that's a little clearer. The same mess of data is still shown in the background, but now the 5-year averages have been added on top.

Here we can see that the red and blue lines for temperature jumps up above 2°C and 5°C are fairly close to one another, averaging 3~4 events each year. And the green line for jumps above 8°C is lower, at around 1 per year.

One thing to remember is that here we're looking at chinook "events" - how many times the temperatures jumps up - while in the first chart today it was the total number of warm days. So here we see that in a typical December-January the temperature will jump above 5°C three times, while the earlier charts showed that we would spend a total of 10 days above 5°C.

If a change in high temperatures from -5°C to 2°C or from 0°C to 5°C doesn't sound too remarkable, those are just the minimum ranges. Buried in there are a few really impressive days:


This is the breakdown of the highs above 5°C, and how much the temperature had increased over the previous day. In a lot of cases we can see that the temperature jump was at the 5°C cut-off or less, but there are some days with swings of 10°C, and even a few of 20°C or more.

Getting back to the idea of folklore, the 5 largest temperature swings are shown here. I've broken this list into the Top-5 of all-time going back to the 1880s, as well as the modern ones going back to 1995. We can see the 20°C+ swings in high temperatures, and several of the corresponding night-to-day temperature swings are more than 30°C. That's impressive enough that you might tell stories about it for a few years. (although I have to admit that I have no particular recollection of either February 2nd, 2011 or December 9, 2014).

Scorecard

Here is Edmonton's chinook scorecard for December-February based on just the last 10 years.

So...does Edmonton get chinooks?

If we're only talking about the summer-in-January days above 10°C, then there are some years with one or two, and others with none. But surely all of the days that we get above 2°C and 5°C must count for something?

For today, I'll leave the question open. But next week in Part 2 we'll look at things from a different angle, and will hopefully come up with an answer.

2016/11/20

Edmonton's Snowy Months

We got a little bit of snow this weekend. In my part of town it was just a light dusting and it wasn't enough to bury the grass or leaves, so I'm not sure if this will end up as "lasting" snow or not?

But today we are going to look at when during the winter we usually get snow. This is Part 4 of the recent look at Edmonton snowfall:

We'll start off with how likely we are to get snow in each of the months of the year:

Chances of Snow

This shows the chances of each month getting at least one day with some snow, based on recent history. So this isn't saying that November through March are 100% all-snow-all-the-time, but just that in every year since 1995 there has been some snow in those months. This includes anything greater than 0.1cm, so in some cases this could have been a dusting that was barely noticeable.

The numbers for November through March aren't very surprising, so here I'm more interested in the shoulder-season months. September snow is pretty rare, but then an October that is snowfree is pretty unlikely. And skipping forward to the spring, a snowfree April is extremely unlikely, while May will get snow a bit more than half of the time.

So in a typical year our snow-season will last from roughly October through April, and maybe into May. 

Next we'll look at the number of days each month when the sidewalks might need to be shoveled:

Number of Snowdays

This chart shows the number of days each month with snowfall. It follows my favourite format: a line for the average is in the middle; which is surrounded by the 25th to 75th percentiles; then the second highest and second lowest; and then the highest and lowest recorded since 1995. And again this is counting any day with more than 0.1cm of snow.

The "real" winter months - November through March - have a pretty consistent average around the 8 or 9 day mark. But some years there is a lot more shoveling, with the maximum for each of those months in the 15 to 20 day range. And as we saw in the previous chart, since 1995 there's been at least one day of snow in every month from November through March.

The shoulder-season months are on average a lot lower, with October, April and May at around 2 to 4 snowfalls. But those months can be snowy too, reaching 8 or 9 days in some years.

That is how often we get snowfall, and next we'll look at how much snow we actually get:

Monthly Totals

Here we have the monthly distribution of snowfall amounts.

In terms of average snowfall we can see that November, December, January and March are all pretty similar at around 20cm per month. February is on the low side for the winter at around 15mm, which is about the same as April. And then October and May both average below 10cm.

In October 2016 we received 22cm, which is well above the average for October. This year was the second snowiest October since 1995, coming in below the 30cm that fell in October of 2004.

The 20cm average for most the winter months isn't very much when it's spread across a whole month with 8 or 9 snowfalls. But looking at the maxes, we have had some extremes like 74cm in November 1996, and 64cm in January 2011.

I've mentioned January 2011 before, because it was my second winter cycling to work, and the only time I've seen anything even close to this:


I rode that whole month, and things worked okay, but I'm glad we don't see that very often.

For a little bit more context, lets see how Edmonton's snow compares to some other cities.

Here is Calgary, in red:

Calgary

Through January, the winters in Edmonton and Calgary are pretty similar at around 20cm per month. But then in March, April and May Calgary's averages jump up to 5cm or 10cm more than Edmonton.

In terms of the snowiest months since 1995, Calgary's highest have been below Edmonton's in the early part of the winter. But then Calgary has had a snowier February, March and April. And those very snowy months are part of the reason why Calgary's March-May averages are higher than Edmonton's.

For another comparison, here is Winnipeg in green:

Winnipeg

This Winnipeg data is a bit problematic, because after 2007 they stopped recording snowfall (which is the same time that Blatchford's precipitation data became unreliable). So this is a comparison of 13 years of data from the Winnipeg International against 21 years from the Edmonton International. That is not ideal, but it's what I've got.

With this somewhat flawed comparison, Winnipeg looks pretty similar to Edmonton. The averages for November, February, March, April and May are almost a perfect match for the two cities. But December and January are on average a bit higher in Winnipeg.

In terms of the snowiest months recorded since 1995, Edmonton's are mostly higher than Winnipeg's. But since Winnipeg is only pulling from a pool of 13 winters, there is certainly room for error there.

Finally, here is Montreal in purple:

Montreal

Montreal's data is also a little flawed because the snowfall records for the Pierre Elliot Trudeau airport stopped after 2012. So in this case we have 18 years of Montreal data versus 21 for Edmonton.

With this graph the scale has had to change, because Montreal is in a different league from Edmonton, Calgary and Winnipeg. So here the Edmonton data is squished down a little bit.

For most of the winter Edmonton averages around 20cm per month, but Montreal is in the 40cm to 60cm range. That places Montreal's average fairly close to Edmonton's very snowiest months. And looking at Montreal's snowiest months, in several cases they are about double Edmonton's.

Bringing it all together, here are the averages for all of the cities combined:


This chart is a little busy, but we can see that the three prairie cities are quite similar to one another, especially compared to Montreal.

While Montreal's snowy months are very snowy, its season is much shorter. In Edmonton and Calgary the snow starts in about October and lasts through May, but in Montreal it really only stretches from November through April.

When all of those months are added up for yearly totals, Edmonton averages about 130cm, Calgary about 150cm, Winnipeg about 130cm, and Montreal about 210cm.

So today we've seen when during the year the snow actually falls. And in previous posts we've looked at when the snow starts, and at how much snow we get in a year. There's still one more chapter in this story, and next time we'll take a closer look at snowfall events, and at how often Edmonton gets giant snowstorms versus gentle dustings.

2016/11/15

November Heatwave Recap

It looks like our little heatwave is over, so lets take a look back at the last week or two.

For some reason Environment Canada is actually missing data for most of this month:


Thankfully, they do still have the Hourly recordings, so I can use those instead of the Daily data. The Hourly data doesn't always match the daytime highs & lows though, which is kindof annoying. Since we're going to be looking at records I'd really prefer to be more exact, but we'll work with what we've got...

Daytime Highs

Here are the daytime highs. From November 3rd through the 14th we set 5 recent records, and for the days that weren't actually the highest, many were the second highest since 1995.

What's really interesting is comparing the beginning of November to all of October, with November being 15°C-20°C warmer in some cases.

Daytime Lows

The story for the Lows is similar, with 7 recent records over those 12 days. And most of the Lows were well above what we saw in October.

Here are the tables with the actual numbers:


The main thing to take from these tables is the colours.

The orange highs that we see during the last two weeks are pretty unusual. We haven't had anything comparable recently, but back in 2005 there was a string of 9 days between 9°C and 15°C, and that one started really late on the 17th of November, and it lasted until the 25th. 2001 also had a 9 day streak, from the 8th through the 16th.

So far this month we had 9 days above 10°C, and 10 nights that stayed above 0°C, and both of those numbers are higher than any year going back to 1997.

Records

Right before this heatwave started I had looked at the 50 warmest days recorded for this time of year. Those charts have been reshaped quite a bit in the last week:


Looking at the 50 warmest days going back to 1985, the large grey block on the right side of this chart is 2016. The last 12 days now hold 11 of the top spots, including 1st through 3rd.


Looking back at all of recorded history, this heatwave had 3 days in the top 50, including all-time records on the 4th and 8th (although again with the caveat that I've had to use the Hourly data, rather than the Daily data that I normally would).

The Race for Warmest Year

This heatwave did a nice job of keeping 2016 in the race for warmest-recorded-year. The beginning of November basically undid the giant dip that we had at the beginning of October. With a month-and-a-half to go we'll have to see where 2016 ends up.

2016/11/13

Remembrance Day

Unfortunately a few days late, but here is the history of Edmonton weather for Remembrance day, November 11.

Temperatures
This history of Remembrance Day weather goes back almost 40 years before Remembrance Day was created. The warmest November 11th in Edmonton was in 1900, with a high of 19°C. The coldest was 1940, with a low of -33°C.

The averages for the last 30 years are a high of -1°C and a low of -8°C, although things bounce around quite a bit. 2015 was quite warm at 5°C, but 2012-2014 were all well below the average, and were the coldest Remembrance Days since the mid-1980s.

Precipitation

In terms of precipitation, the last significant snowfall on Remembrance Day was in 2002, with 6cm at the International and 2cm downtown. Rain isn't very common at this time of year, with only 2 rainy days ever recorded, the most recent of which was in 1933.

Snow of the Ground

Here we have the measured amount of snow on the ground. 

Similar to what we saw when I looked at Edmonton's first lasting snowfall, we can see that Remembrance Day has snow about half of the time. Just recently, 2012-2014 had significant snow, but the years just before that from 2007-2011 had none.

2016/11/07

The First Lasting Snowfall of the Winter

Today we're going to look at when Edmonton typically gets its first lasting snowfall of the winter.

I wasn't sure when to post this - do I wait until we actually have "permanent" snow on the ground? Or do I post it early, and then inevitably it will snow the next day? But with the very warm forecast I don't think we have to worry about snow this week, so now is the perfect time.

Today is also the one-month anniversary of the first snow that we got this winter, back on October 7th. When that happened we'd looked at winter's first snowfall: it's typically in October or November, but there are a few late years that stretch into December, and a few early ones in September (and in recorded history there have even been two in August). But that first snowfall will often melt long before winter really begins, so today we're going to look at when the snow actually sticks around.

This is Part 3 of the ongoing saga of Edmonton snow:

Environment Canada measures the depth of the snow on the ground throughout the year, and today I'm going to be using the data from the International Airport, since it is more complete than Blatchford.

To start with, here are the recorded snow depths during the autumn for the last two decades:

Snow Depth

This shows 1995 through 2016, and how the snowdepth changes for October through December. I haven't included September snowfalls here, because in the past they have always melted-off before the winter starts.

I don't expect the data today to be perfect, for a few reasons. Snowdepth is obviously going to be a tricky thing to measure, and it will depend on the type of snow - fluffy, heavy, that sugary stuff, etc. - and how long it has had to settle. And when Environment Canada measures snowdepth they are doing that in an untouched area, but when snow gets shoveled and piled into windrows it takes a lot longer to melt. There are many times when the Environment Canada data shows 0cm snow, but in the real world there might still be snow piled up along driveways and on boulevards.

Environment Canada also has something that they call "trace" amounts of snow, which means that there is snow, but there is not enough to measure. And the data also has some holes in it - missed readings, or suspicious 0s. It's a little tough to distinguish truly snowfree days from the trace amounts and from the errors. So for the data today I've had to do a little more cleanup and massaging than I normally do.

But even with that, there are some stories here:
  • October snow is pretty common - there's been at least a little bit in 15 of the last 21 years. But October snow doesn't usually stick around - the years with lasting snow were 2001, 2003, 2004 & 2006. 

  • If you zoom way in on this chart, you can see that in years like 2001 and 2004 the late-October snow melted down to the "trace" amounts that I was talking about. And those trace amounts lasted several weeks before the next snow.

  • The big blip of snow that we got in early-October 2016 was unusually large for that time of year, but it disappeared within about a week.

In terms of the first lasting snow, it usually seems to happen in the first or second week of November. And then around the end of November we'll get some big snowfalls that push the snowdepth up above 10 or 20cm.

First Lasting Snow

Here are my best approximations of the dates for the first lasting snow for each year, going back to 1961 when the recordings at the Edmonton International began.

On this chart I've included a line for October 14, which is when we got the second big snowfall for 2016. Early October this year was very cold, and with 9.5cm of snow it seemed like maybe winter had officially started. If that snow had stayed it would have been the earliest lasting snow ever recorded - just beating 2004 and 1984. And in fact, on October 14 there was still snow from our first snowfall on October 7th, so 2016 would have been really, really early. But in the end it did all melt off within about a week.

In this chart there are years like 2001 and 2004 which had October snowfalls that melted down to trace amounts, and which then stayed like that for a several weeks. For those years I'm counting the trace amounts as lasting snow, because it probably looked and felt like winter at the time.

There are also a few years here - 1997, 1999, 2005 - which had 0cm snowdepth recorded at the end of December. So if it all disappeared by New Year's, was there really any "lasting" snow? I'm going to say that yes there was. Those years all had earlier snowfalls that hung around for a few weeks, so in those cases I've used the early dates.

Here is a closer look at a few of those tricky years:


1997, 1999 and 2005 all have zero snowdepth listed on New Year's Day. So for 1997 I'm using the December blip as its lasting snow. For 1999 I'm taking the mid-November snowfall, and for 2005 the early December one. And with 2004 you can see the 3-week stretch that had trace amounts of snow, but right before that there had been a month of snow, so there I've counted the big mid-October snowfall as the lasting snow.

For these years I think it's fair to take the early dates, because there was probably some snow hanging around in windrows or in shaded areas.

Breakdown by Week

Here is a weekly breakdown of when lasting snow actually does show up. The data for all years going back to 1961 is in blue, and the orange bars are for just the last 10 years.

Historically the first week of November was the most likely time for the first lasting snow, happening in 17 years or 31% of the time. The rest of the weeks of November are all at 15%, and then things drop off for both October and December.

In the last 10 years its been a bit different, with the third week of November being the most frequent at 30%. 10 years is a small sample size though, so 30% is just 3 years. But this at least refreshes my memory of recent history.

As I've said, these numbers aren't going to be perfect and there is some room for interpretation, but it gives an idea of what's typical.

First Snow versus First Lasting Snow

Finally, here is a comparison of the first snowfall (>1cm) and the first lasting snow.

The biggest gap between the two is 1992. Its first snow was on August 21, but then the first snow that stuck around wasn't until more than 3 months later on December 3 (in between there were a few snowfalls, but they all disappeared).

Looking at all of the years the average gap - mean and median - is a little under a month at around 26 days. Speaking as a winter cyclist, I know that the first snowfall every year scares me into putting the studded tires on my bike. And then I'm frequently disappointed for the next few weeks because there's nothing but bare pavement.

2016/11/03

November Heatwave

Not to jinx things, but it sounds like we're in for a few days of warm weather, with the forecast calling for about a week of highs above 10°C, and some days of 15°C or more.

How unusual is that for November?


Here are the November daytime highs going back to 1997. The circled areas show either really warm days above 15°C, or strings of fairly-warm days above 10°C. So these mini-heatwaves aren't unprecedented, but they are pretty unusual.


Here are the 50 warmest days for this week of the year - November 3rd through 9th - going back to 1985.

Days above 10°C are pretty rare, with only 15 of them since 1985. And days above 15°C are even rarer, with only 2 of them. The longest recent hot-streaks were 1997 and 2010 which both only managed 3 days above 10°C.

That's just recent history, but what about going further back?


Here are the 50 warmest days for this week, going all the way back to the 1880s (there are actually 59 days here, since there is a 10-way tie for 50th place at 13.3°C).

So far the 2010s don't have any days in the top 50 for this week of the year, and the 1990s and 2000s together only have 3. That's in comparison to the 1940s which have 9, and even the 1880s have 7.

If 2016 is going to break any records this week, the low-hanging fruit are November 7th and 9th which both have record highs of 15°C. For the other days of the week the records are up in the 17-20°C range, and most of them were set during one particularly warm week in 1949.

Wherever we do end up, this should still be a nice change from the very cool October that we just had. In all of October there wasn't a single day above 15°C (the maximum was 14.7°C on the 3rd) and there were only 7 days above 10°C. By this time next week November might outdo that.