
What did we all think of August 2020? And how did the summer of 2020 compare? Let's find out.
High Temperatures


Overall 26 days had highs which hit 20°C, when August's average is 23 days. That included 8 days at 25°C, compared to an August average of 9 days, and we had 2 days hit 30°C.
The end of the month felt a little chilly, and it was a little below average, but our coldest High was 16.6°C on the 30th. About half of the time August will have even colder Highs below 15°C, and 2002, 2004 & 2005 all had Highs below 10°C.
Hot Days

For the summer so far we have had 22 days hit 25°C. That's 2 more than the 20 which we had in 2019, but it is way down from the 34-54 which we had in the 4 warm summers from 2014-2018. The average is about 30 Highs at 25°C each summer, and so we were below that, and ranked as 107th out of 140 years.
We had 10 days hit 28°C, which is about average. That included 2 Highs at 30°C, which is below the average of 4 days. And for slightly milder days we have had 83 highs hit 20°C, which is basically right on the average.
Low Temperatures


Warm & Cold Months

August 2020's average High was 23.3°C, which was just above the recent average of 22.9°C and ranked as the 39th warmest overall. Over the years August's average High has stayed fairly close to 22°C.
If you flip the chart to show the Lows, August 2020's Low of 11.8°C ranked as 20th warmest. It was right on the recent average, but well above where things were a century ago when the average was around 8°C.

This chart shows the average High temperatures for each month going back to 2000. The bubbles represent how much warmer or colder each month was compared to the 20th century average, with big orange bubbles being much warmer, and blue bubbles being cooler.
August 2020's average High was 1.2°C warmer than the 20th century average for August, so it appears as a medium-sized orange bubble. That is the first notably orange bubble that we have seen since back in February, with March & April both notable cold, and May-July all right around the average. It also makes a difference from 2019, where the string of cool~ish months ran from May through October.

For the whole "summer" from May through August this ranked as Edmonton's 58th warmest, with an almost equal split between above-average and below-average Highs. In comparison 2019 was the 110th warmest, 2018 was 2nd warmest (after 1898 for some reason) and 2017 was 7th warmest.
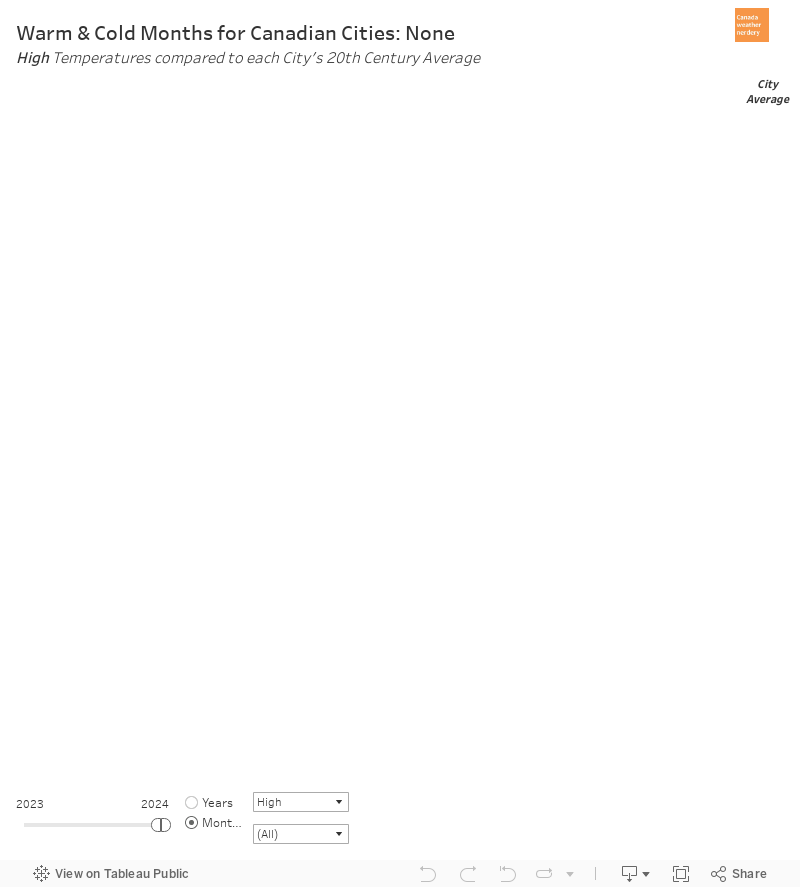
Looking across the country the Highs for August 2020 ranged from right on the average in Ottawa and Vancouver, up to 2.6°C warmer than average in Calgary and 3.3°C warmer in Regina.
Monthly Precipitation

August's precipitation was above average at both Blatchford with 83mm and the International with 66mm. That is compared to an August average of 52.8mm, and it means that following an extremely dry April all of the summer months were above average.

For precipitation for the year so far the two Edmonton stations are very close, with Blatchford at 457mm and the International at 449mm. That is about 100mm above the for the end of August, which is 351mm.

A lot of Blachford's August rain came from one 33mm storm on August 3rd, which was the second largest of the year after 36mm on May 21st.
September Temperatures


For September Highs we still average 10 days at 20°C, including 3 at 25°C. Highs below 10°C only happen about half of the time, and in the last 20 years only 6 Septembers had a High below 5°C. But 2 of those years happened to be 2018 and 2019.
For September Lows, about half of the time September is frost-free, but we can see the below-freezing days creeping in as blue squares. September 2019 had 3 night with frosts, and 2018 had a ridiculous 8 of them.