Showing posts with label Winnipeg. Show all posts

2021/01/01

2020 in Review - Part 2 - Temperatures Across Canada

In Part 1 of our 2020 review we took a detailed look at temperatures in Edmonton. In Part 2 we will be expanding that out to 8 other major cities across the country. Part 3 will be about 2020's Precipitation, and Part 4 will be Snow.


2020 Across Canada

In this chart each year since 2000 appears as a bubble. Orange bubbles were warmer than the 20th century average for the city, and blue bubbles were colder. The size of the bubble represents how warm or cold it was, and if you hover over them you will get a bit more information. These are calculated using the Mean temperatures (the average of the daily Highs and Lows), but with the dropdown on the lower right you can switch to look at the Highs or the Lows.

In 2020 all of the cities that we look at were warmer than their 20th century averages, with Edmonton at the cooler end of things:

  • Vancouver 0.7°C warmer than the 20th century average
  • Edmonton 1°C, Calgary 1.2°C, Regina 1.2°C, Winnipeg 1.1°C
  • Toronto 1.1°C, Ottawa 1.4°C, Montréal 1.9°C
  • St. John's 0.9°C

Something to notice here is that almost all of the bubbles in this chart are orange. This covers 21 years and 9 cities, and so there are a total of 189 bubbles here, and only 24 of them are blue. Since 2000 Winnipeg & Regina have each recorded 6 below-average years, Ottawa & St. John's have had 3, Toronto & Calgary 2, Montréal & Vancouver 1, and Edmonton none.

That is quite a change from how things used to be:

This chart has the yearly temperature bubbles for 20-year time periods, from 1880-1899 through 2000-2020.

2000-2020's 21 years had 24 blue bubbles across the country. 1980-1999 had 52, and 1960-1979 had 100. Way back in 1880-1899 there were 114 below-average years versus 29 above-average (some of the cities are missing data for those years, so the total number of bubbles is lower).

There have always been some years which were warm and others which were cold, but in the past 20~40 years the cold years have mostly disappeared for Canada's cities.


1841+

Here are all of the years of records together in context. 2020 was not a particularly warm year in Edmonton, with temperatures "only" 1°C warmer than the 20th century average. 

Vancouver was below that at 0.7°C, however Vancouver has a much more moderate (or less extreme) climate than Edmonton because of the ocean. So 0.7°C warmer than the 20th Century average in Vancouver ranks as #26 warmest, while 1°C warmer in Edmonton is #28.

So across the country 2020 ranged from #28 warmest in Edmonton, all the way up to #5 warmest for Montréal. So for all of the cities here 2020 was at least a top-30 year, and for Ottawa, St. John's, Toronto and Calgary it was a top-20.

The last time that all 9 of these cities had a top-30 year together was 2016, which was very warm: #3 warmest for Edmonton, Calgary & Regina, #4 for Winnipeg, #7 for Vancouver, #9 for Montréal...


Canadian Climate Stripes

This is another way of looking at that history all in one place, with the climate stripes for all of the cities. The prairie cities have been mostly in the reds since about 1980, while for the rest of the country it happened a little later around 2000.


2020 in Montréal

2020 was a top-5 warmest year in Montréal, and so we are going to take a closer look at what that means and where the number comes from.

This chart tracks how much warmer or colder each day of 2020 was compared to the 20th century average. Warm days get points and push the red line upward, and cold days drop the line down. It is split into Highs, and Lows because the Lows tend to have warmed up more than the Highs have. And then the average of Highs and Lows gives us the Mean, and the overall ranking of...

In Edmonton most of our warming comes from the Low temperatures. In 2020 Edmonton's Mean temperatures was 1°C warmer than the 20th Century average, but that comes from the Lows which were 1.42°C warmer and the Highs which were only 0.49°C warmer. And that pattern is typical, going back years.

Montréal is the opposite, with more of its warming coming from the Highs. In 2020 the Highs were 2.08°C above the 20th century average, while the Lows were only 1.79°C, which gives the 1.9°C total. And warming Highs are pretty typical for Montréal, happening in 2020, 2019, 2018, 2016, 2015...with 2017 as a rare year where the Lows had warmed more than the Highs.

Getting back to 2020, if we follow the red line along we can see that it climbs from January through April, and then takes a little bit of a dip. It then climbs again through September, and takes another little dip. And then it climbs through the end of the year.


Montréal's 2020 Highs

Here are what Montréal's daily High temperatures actually looked like. (just a note that the average line in this chart is the 30-year average, while the other charts today use that 20th century average as their baseline. Sorry about any confusion. This chart is more about the current picture rather than long-term trends)

This chart is a little cramped in this format, but in January-April we see a lot of red, with the temperatures only rarely dipping below 30-year average into the blues. April & May were cold, but then in late-May through July there were a bunch of new records. August, September & October all had a mix of above & below average days. And then there were a few more new records in November and December.

Montréal finished 2020 with 215 Highs above the 30-year average, and 151 below. That included 8 new records for warmest-High, and 1 for coldest-High. So even in a top-10 warmest year there are going to be some cold days.


Warm & Cold Months Across Canada

Here we have the monthly bubbles for all of the cities. Sticking with Montréal we see that January-March were warm, April-May were cool~ish, June-August were warm, September & October were cool, and November & December were warm.

On a month-by-month basis:

  • January was above-average across the country, but it was least-above average in Edmonton & Calgary.
  • Things flipped for February, with Edmonton, Calgary and Regina well above average, while the rest of the country was just a bit above average.
  • Edmonton & Calgary got an extra-cool March, while on the coasts Vancouver and St. John's were a little cool, and the rest of warm.
  • April was cool from coast-to-coast, and especially in Edmonton & Regina.
  • May was pretty middling, with Vancouver a little warm and Toronto a little cold.
  • June was pretty warm from Winnipeg through St. John's.
  • July was really warm in Ontario & Quebec, meh in the west, and cold in St. John's.
  • In August things flipped, with Edmonton, Calgary & St. John's the most above average.
  • That continued into September, with Edmonton, Calgary, St. John's & Vancouver warm, and Winnipeg through Montréal cool.
  • October was really cold on the prairies, meh in central Canada, and warm in St. John.s
  • November was pretty warm everywhere except Edmonton.
  • And finally, December was warm across the country, and especially across the prairies.
With all of that, that is how each of these Canadian cities ended up with a 2020 that was warmer than their 20th century average temperatures. 


And that brings us to the end of Part 2 of our look back at 2020. In Part 1 we looked at Edmonton's Temperatures. Part 3 will be about Precipitation, and Part 4 will be Snow.


2020/06/08

Wind in Edmonton Part 9: Versus Round

Today we reach the end of our epic look at Wind in Edmonton. A 9-part series is obviously excessive, but each question led to another question which led to another dashboard, and that's how we ended here. 

Something that we saw in the earlier parts of our look at wind was that Edmonton is not as windy as it used to be. And we saw that the 1960s in particular were windy across the board: average windspeeds, peak windspeeds, number of wind days, wind gusts, etc. And that raises the question of why?

We couldn't end this series without at least trying to dig into the mystery of the windy 1960s, and so today we are going to compare Edmonton to Calgary & Winnipeg. Often at Edmonton Weather Nerdery we also have the data for Vancouver, Montréal, Toronoto, etc. but for the wind data we are going to limit it to just Edmonton, Calgary, & Winnipeg. The wind uses hourly data, so there is 24x more of it than the daily temperatures and precipitation which we normally do.

So today we will run through many of the charts which we have already seen, but with Calgary & Winnipeg included as well. And we will start at the beginning:

Is it windier than it used to be?
And again, the answer is: nope.

Here we have the strongest gusts, the windiest hour, and the average windspeed for each year, and for all three cities the numbers are lower than they used to be. For Calgary it has been a gradual decline, whereas for Winnipeg it was more of a big step down in the early 1970s, and mostly flat after that.


Windy Months
In the top part of this chart each of the coloured blobs represents a month which was windier than average for the city.
  • For Edmonton we saw that at both Blatchford and the International our windiest months were really clustered in the late-1960s and early-1970s.
  • Calgary is a little bit different. Most of its windiest months are between 1960-1975, and things really taper-off after about 1990.
  • And Winnipeg is also a bit different, with most of its windiest months spread from 1953-1970. Then from 1970-today there is a fairly consistent sprinkling of wind~ish months. And I don't know what happened in 1991, but September-December had four top-20 months in a row.
So all three cities have fewer windy months than they used, but that the pattern of those windy months is different.

It's also interesting that Calgary & Winnipeg have had a lot of windy months in the winter, whereas for Edmonton that never really happened outside of the very tight window of 1967-1971.


How many windy days do we get each year?
Here we have the number of days each year which recorded a windspeed of 60km/h or more. 60km/h was chosen here as an example, but you can use the slider to look at 30km/h or 50km/h too.

All of the windspeeds look something like this though, with a lot of windy days in the 1953-1975 range, and a lot few windy days since then.

It is also interesting to see how many fewer windy days Edmonton gets compared to Calgary or Winnipeg, and that that was also the case 60 years ago. In the windy 60s Edmonton averaged two 60km/h days each year, while Calgary had 10 and Winnipeg had 6. 

For 40km/h days Edmonton used to average 60, compared to 110 in Calgary and 100 in Winnipeg. In recent years Edmonton has averaged 30 days which hit 40km/h, compared to about 60 in Calgary and 50 in Winnipeg.


Gusty Days
Here we have all of the days with wind gusts of 100km/h or more, and for all three cities the bubbles are a lot less common than they used to be. Winnipeg has not had a day with 100km/h wind gusts since June 21, 2004. (although Winnipeg is missing gust data for 1997-2004, while Blatchford is missing 1995-2005)

So by all accounts Edmonton, Calgary & Winnipeg are all less windy than they used to be. But how do they compare to one another?


City Comparisons - Average Windspeed
Here we have a comparisons of the average windspeed throughout the year for the 3 cities. This uses all the data for 1953-today. Up top we see each of the cities individually, but at the bottom we can see how they compare to one another.

All 3 of the cities have their highest average windspeeds in May, and are lowest at the end of August. 

Surprisingly (to me, anyway) Winnipeg's average windspeed is about 5km/h (or 30%) higher than Edmonton's, although that depends a bit on the station. Winnipeg is on-average about 5km/h windier than the Edmonton International for most of the year, although the gap closes to 3km/h for June & July. For Blatchford the difference is 7-8km/h for most of the year, although it again narrows to 3km/h for June & July.

Calgary is also windier than Edmonton. Blatchford's average windspeed is about 4km/h less than Calgary's for most of the year, although that decreases to 1-2km/h for the summer. For the Edmonton International the difference is about 2-3km/h for the whole year.

And for Calgary vs Winnipeg, Winnipeg's average windspeed is about 3km/h higher than Calgary's for most of the year, except during July & August when they are a very close match.


City Comparisons - Windiest Hour Each Day
We can also use this chart to look at the average of the windiest hour for each day of the year. "Average Windiest Hour" is maybe slightly unclear, but the windspeed varies during the year as well as during the day. This is looking at the windiest of each day - January 1st, May 17th, August 23rd... - and finding the average for each city.

Winnipeg and Calgary are both at about 30km/h for most of the year: things increase a bit to 33km/h in May and fall to 27km/h in August. The two Edmonton stations are closer to 23km/h for most of the year, with a peak of 28km/h in May and a bottom of 20km/h in August.


And for our final chart of the day, here is how the windspeed varies throughout the day.

We are looking at 60+ years of data here, but on-average all three cities are windiest during the afternoon. For Edmonton and Winnipeg the peak is 1-2PM, while for Calgary its 3-4PM. We can also see the gaps in average windspeed, with Winnipeg's line generally about 5km/h higher than Edmonton's, and with Calgary fitting in the middle.


The End

And so at long last that brings us to the end of our look at Wind in Edmonton.

In previous posts we saw that Edmonton is not as windy as it used to be, and today we saw that something similar is true for Calgary and Winnipeg. The patterns are not identical: Edmonton's peak was firmly in 1965~1973, Winnipeg's was 1953~1975, and Calgary's 1960-1975 was with another big drop after 1990.

When wind recordings started 60 years ago these airports were all new, and in the decade to follow all of the would have undergone construction and expansion. So maybe that the wind patterns were changed as the airports were first developed? Or maybe the wind itself actually has changed? I do not know the answer to that question, and will probably never know the answer.

2020/04/26

2019-2020 Winter-in-Review - Part 2 - Snow

Today we are going to take a look back at Edmonton's snow during the winter of 2019-2020.

If you are interested in the temperatures from the winter we took a detailed look at them: 2019-2020 Winter-in-Review - Temperatures.


Caveat: Winter is not (necessarily) over yet
Sometimes, Edmonton gets snow in May (and even very occasionally in June). In this chart every bubble represents a May or June snowfall at either Blatchford or the International. Late snow doesn't happen every year, but it actually averages out to about 1/2 the time.

In recent years 2016, 2017 & 2018 had snowless late-springs, but then in May 2019 the International recorded 4 snow days. And sometimes we're talking a lot more than just a few flakes: those big bubbles are for 11cm of May 6th 2015, 16.8cm on May 4th 2010, 17 cm on both May 5th & 6th 2003, and so on.

So fingers crossed, but who knows?

The reason that we will do the winter snow wrap-up now is because of this:


Snowdepth
The snow at the International finally melted on April 22nd. Environment Canada doesn't report 0cm of snow anymore, but the final snowdepth recordings were 1cm on April 15th at Blatchford, and 2cm on April 21st at the International.

The little bargraph at the bottom of this chart shows years which had snow on April 22nd, at it is a short list.

Looking back over the winter as a whole:

  • a storm on November 10th pushed the International up to 19cm, and Blatchford up to 10cm.
  • Blatchford melted back down to 0cm for about a week, while the snow at the International hung around. 
  • From the beginning of the December the snowdepth at both stations climbed fairly steadily.
  • For Blatchford the snowdepth peaked on February 18th with 32cm, but at the International the peak wasn't until March 8th with 41cm.
  • Snowdepth had a few dips in March, but the big melt didn't really start until April 6th at Blatchford and April 7th at the International.

Snowdepth Each Year
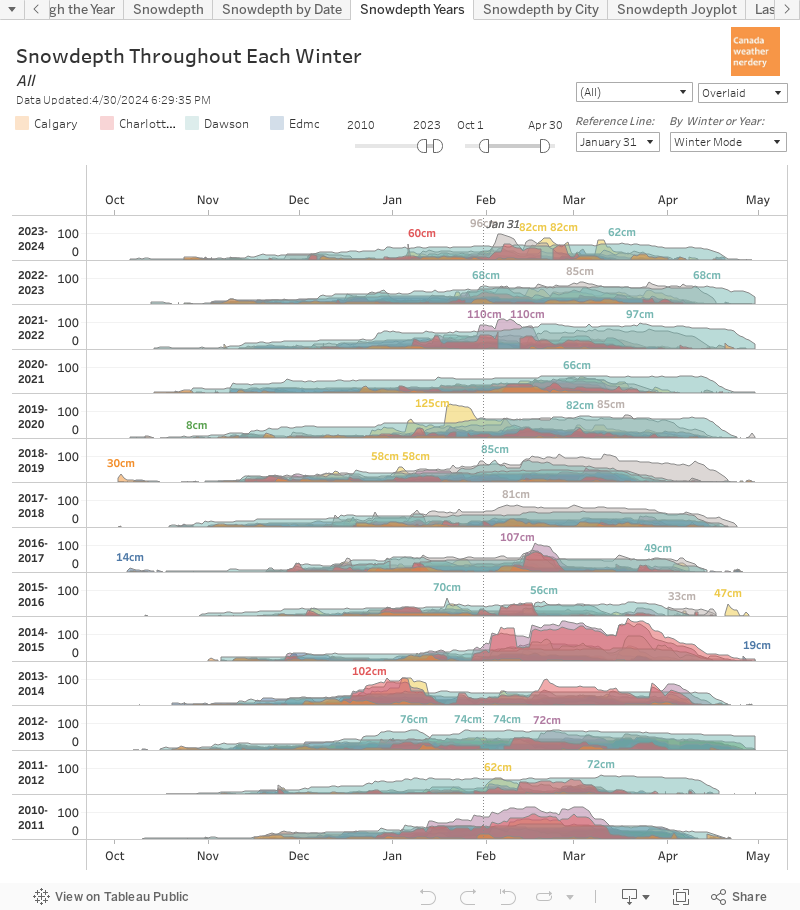
Here we have the snowdepth throughout the year compared to other recent years. Only about 8 winters fit onscreen at a time, but the data going back to 1955 is all here if you scroll down a bit. (Blatchford data was missing from 2012-2015, if you're wondering)

This winter's peak of 41cm at the International was below 2018-2019's peak of 45cm, but was higher than the four winters from 2014-2015 through 2017-2018. The last time that we saw a peak above 50cm was 1996-1997 with 53cm, and 1973-1974 was a really big year reaching 84cm in late March.

It is fairly common for the snow at both stations to melt by about the beginning of April, but there are some winters - 2019-2020, 2017-2018, 2012-2013, etc - which drag things out for a few extra weeks.

The International's final day with snow was April 21st, and here we have the only recorded years with snow the day after that on April 22nd. And since records began in 1955 there were only 7 years with snow that late:
  • 2008, 1985 & 1972 don't really count because they were all on their second round of snow.
  • 2013 lasted until April 25th
  • 1974 lasted until to April 22nd
  • 1967 lasted until April 24th
  • 1965 lasted until April 23rd

So the melt of 2019-2020 was almost as late as it gets.

For some context this chart has a comparison of the snowdepth through they year for various Canadian cities. It's currently set for Edmonton (Blatchford data only), Calgary & Montréal, but Vancouver, Winnipeg, Toronto, Ottawa & St. John's are in there too.

All the other cities had melted long before Edmonton...except for St. John's where the snowdepth peaked at 125cm(!) in January, and lasted until April 14th.


Lasting Snow
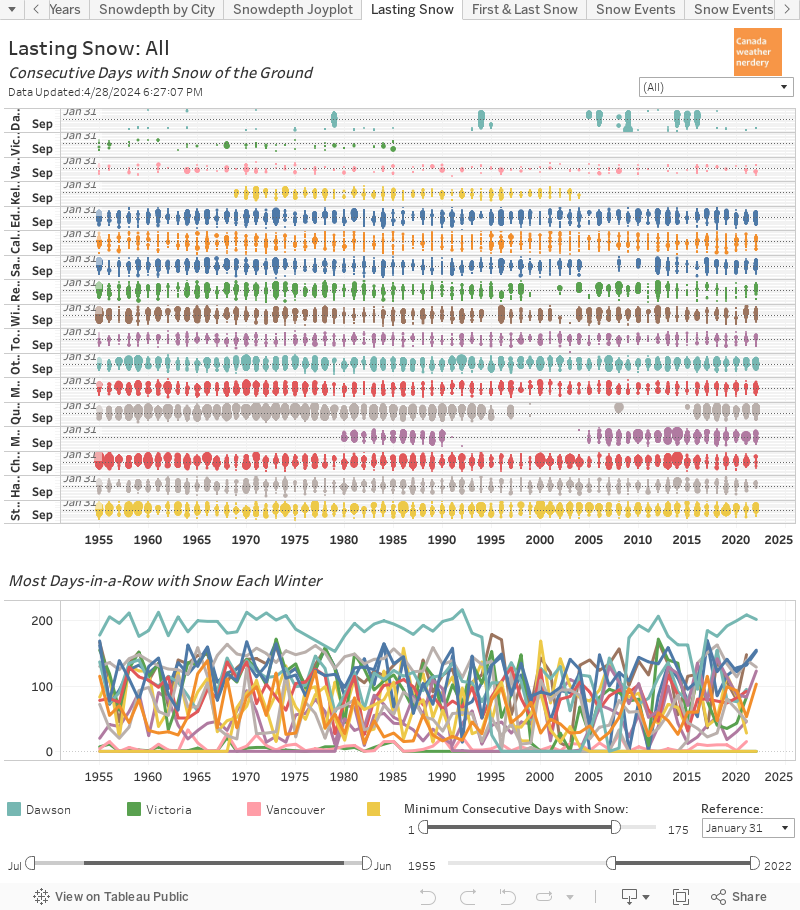
Back to Edmonton, the International finished off the winter of 2019-2020 with 169 days in-a-row with snow on the ground, from November 5th to April 21st. In 2017-2018 the International went 172 days, with an earlier start on October 31st, and the final melt on April 20th.

For 2019-2020 Blatchford went 141 days from November 27th to April 15th.


And here we have a look at other cities again:

  • For Edmonton (Blatchford) and Winnipeg it's fairly typical to go 120 or more days with snow on the ground.
  • Calgary often only goes about 50 days in-a-row with snow, but in 2019-2020 they went 99.
  • Montreal goes about 75 days in-a-row, which Ottawa is closer to 100.
  • And of course Vancouver rarely has snow on the ground for more than 10 days in-a-row.


First & Last Snow
It's always possible that we will get more snow, but right now it looks like the final snowfall of 2019-2020 at the International was April 15th, which is earlier than the recent average of April 24th.

And back in the fall the first snow was October 7th, which is about average over the long run, but is late compared to some recent years: 2018 was September 12th, 2017 was September 19th, 2016 was actually August 27th, and 2014 was September 8th.

So from first snowfall to final snowfall was 191 days, or a bit over 6 months.


Monthly Snow
Broken down by months this is how things went:
  • October through January were all in the normal range.
  • February & March were a little high, but nothing extreme.
  • April's 5.5cm was the most below-average month.

And here we have Calgary & Montréal for comparison again, with data for all of the other cities accessible as well:

  • Calgary has 114cm of snow in September through November, which was its snowiest early-winter since 1945. Then December and February through April were all fairly average. January was very low with only 3.9cm.
  • Montréal's February was high with 67cm, and its March & April were both below 10cm and very low.
  • Winnipeg had its snowiest October since 1919. St. John's had a massive January, and Vancouver's was above their average too. Toronto's February was above average, 


Total Snow
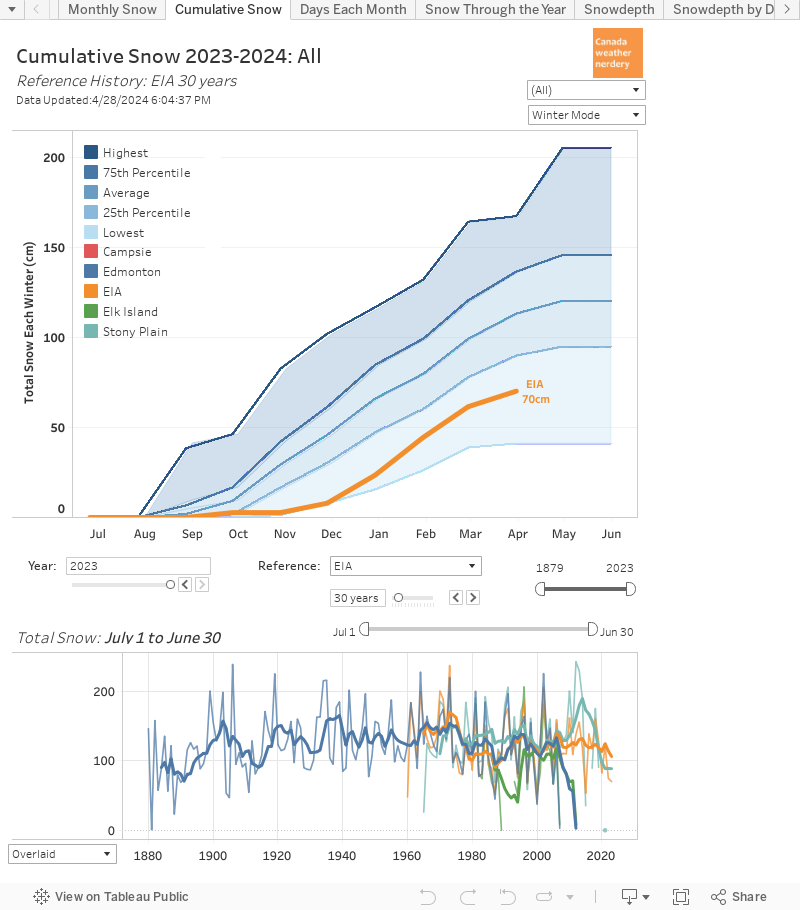
The International's total snow for the winter of 2019-2020 (so far) ends up at 125.6cm, which is basically right on our average.


And this messy chart has the snow totals for all of the cities for 2019-2020:
  • Halifax was way up at 412cm
  • Calgary, Montréal & Ottawa were all around 190-200cm.
  • Toronto 139cm was above Edmonton's 125cm and Winnipeg's 102cm.
  • And Vancouver was way up at 45cm, (their average is 35cm)


Large Storms
During the winter of 2019-2020 the International only recorded 2 days with 10cm of snow: November 9th with 11.4cm, and January 22nd with 10.5cm. On average we get one or two 10cm snowdays each year, so that was fairly typical. We only had 4 5cm snowdays, and that was a bit below the average of 7 each winter.


And finally, one more messy chart which shows the 20cm snowdays this winter for the various cities:

  • Calgary had 24.6cm on September 29th.
  • Winnipeg had 21cm on October 10th.
  • Montréal had 27.4cm on February 7th.
  • And St. John's had 23cm on December 24th, 30.2cm on January 5th, and then approximately 76cm on January 17th (the official data is missing for that day).


Summary

Generally the snow for the winter of 2019-2020 in Edmonton was fairly average...with one notable exception:

  • the one unusual thing was that the final melt was very late. It was similar to 2018 & 2013, but was almost a month later that 2016, 2015, 2014...
  • The total snow of 125.6cm was basically right on our yearly average.
  • The snowfall for all of the months was fairly typical: February's 23.6cm was a little high, and April's 5.5 cm was quite low. 
  • The first snow on October 7th was average, and the final snow (so far) on April 15th was a bit earlier.
  • We had two 10cm snowdays which is the average for each winter, but we also typically get about seven 5cm snowdays and 2019-2020 only had four.
  • We couldn't possible cover all of the the other Canadian cities in detail, but Calgary & Winnipeg both had very snowy autumns, and St. John's & Vancouver (of all places) had snowy January's.

2019/12/16

City Temperature Comparison - Dashboard

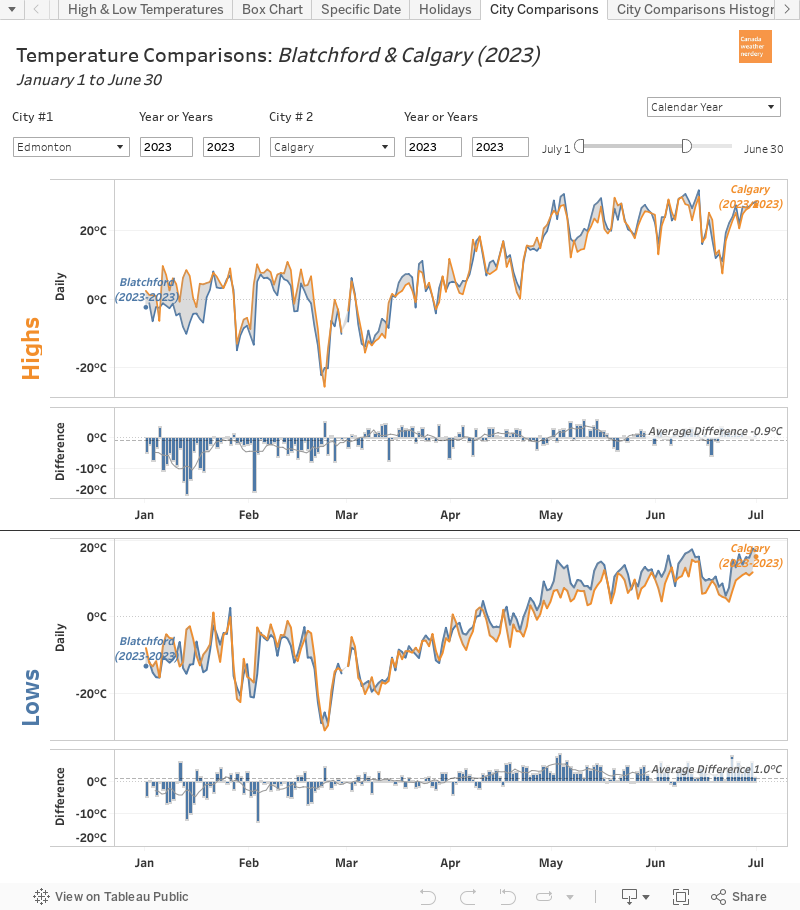
Today we are going to take a look at a dashboard that lets us compare the temperatures from different weather stations in a bunch of different ways.

We will begin, as always, with Edmonton vs. Calgary.

Edmonton & Calgary: 30-Year Average Temperatures


Here we have the average daily temperatures for Edmonton and Calgary. For complicated reasons this chart unfortunately doesn't have a legend, but Edmonton is the darker blue, and Calgary is lighter. The top half shows the High temperatures, and the bottom half has the Lows. The linecharts are the temperatures themselves, and the barcharts are the differences between the two cities. And if you hover over the dashboard it will give the numbers for the various days.

We will talk about this more in detail in a bit, but in general we can see:

  • Edmonton's average Highs during the winter are quite a bit cooler than Calgary's - the difference is about 4°C or 5°C for December & January.
  • Edmonton's average Lows during the winter are only a bit cooler than Calgary's - the difference in January is about 2°C.
  • Edmonton's average Highs for May & June are maybe a degree or two warmer than Calgary's .
  • Edmonton's average Lows for May-September are about 2°C warmer than Calgary's.

The biggest differences are during the winter, and so I think it will be easiest if we flip this chart from January-December to a more winter-centric July-June:


Edmonton & Calgary: Winter-centric Version


Here we have the same data that we were just looking at, but this time it runs from July-June so that the winter falls in the middle of the chart.

And for the Highs we can see that Edmonton and Calgary are pretty close for most of the year, but things start to diverge around November and then join back up around April. The big difference in the average Highs peaks in mid-January, with Calgary's average at around 0°C and Edmonton's at -7°C.

For the Lows during the summer Edmonton is usually a few degrees warmer, but then as we move into winter that flips and Calgary is a bit warmer. That also peaks around mid-January, with Calgary at -13°C and Edmonton a few degrees cooler at -16°C, but the difference is much less than with the Highs.


Edmonton & Winnipeg


And as usual, after looking at Calgary here we've moved on to Winnipeg.

For the average Highs during the summer Winnipeg is 3°C or 4°C warmer than Edmonton. But in the winter that flips, and in January & February Edmonton's average Highs are 5°C to 7°C warmer than Winnipeg's. If you switch the dropdown in this dashboard to Calgary, their average Highs in January are 10°C to 12°C warmer than Winnipeg. Calgary's average Highs bottom out at about -4°C, for Edmonton it's -8°C, and for Winnipeg it's -13°C.

For the average Lows Edmonton and Winnipeg are fairly similar during the summer, but then in the winter Edmonton's Lows are 8°C to 10°C warmer, and Calgary's are 10°C to 12°C warmer. Calgary's average Lows bottom out at about -16°C, for Edmonton it's -17°C, and for Winnipeg it's -23°C.


Edmonton & Montréal


These dashboards have the data for 9 Canadian cities, and we won't go through all of them here, but we will do one more example with Montréal. Not surprisingly, on-average Montréal is warmer than Edmonton for most of the year. But what might be surprising is how close the average temperatures are in January-March.

For the Highs the biggest gap is in November & December, with Montréal about 7°C warmer than Edmonton's cool falls. For February, March & April that difference basically disappears though - Edmonton gets colder days than Montréal, but also more warm ones. And in the summer Montréal's average Highs are about 3°C warmer than Edmonton's.

For the Lows things are similar, with Montréal about 7°C warmer than Edmonton in November & December, about the same in January & February, and then about 4°C warmer for most of the year.

Here's a look at Edmonton, Calgary & Winnipeg all compared against Montréal. In January & February Calgary's average winter Highs are actually about 4°C warmer than Montréal's. And Montréal is pretty consistently warmer than Winnipeg, although the summer Highs are similar.


Edmonton & Calgary: 2019


Everything that we have looked at so far today has been 30-year averages, but this dashboard can also be used to compare a single year. Here we have the temperatures for 2019 for Edmonton & Calgary.

The daily temperatures for the two cities follow each other very closely - the extremely cold February 2019 shows up in the Highs & the Lows for both Edmonton & Calgary.

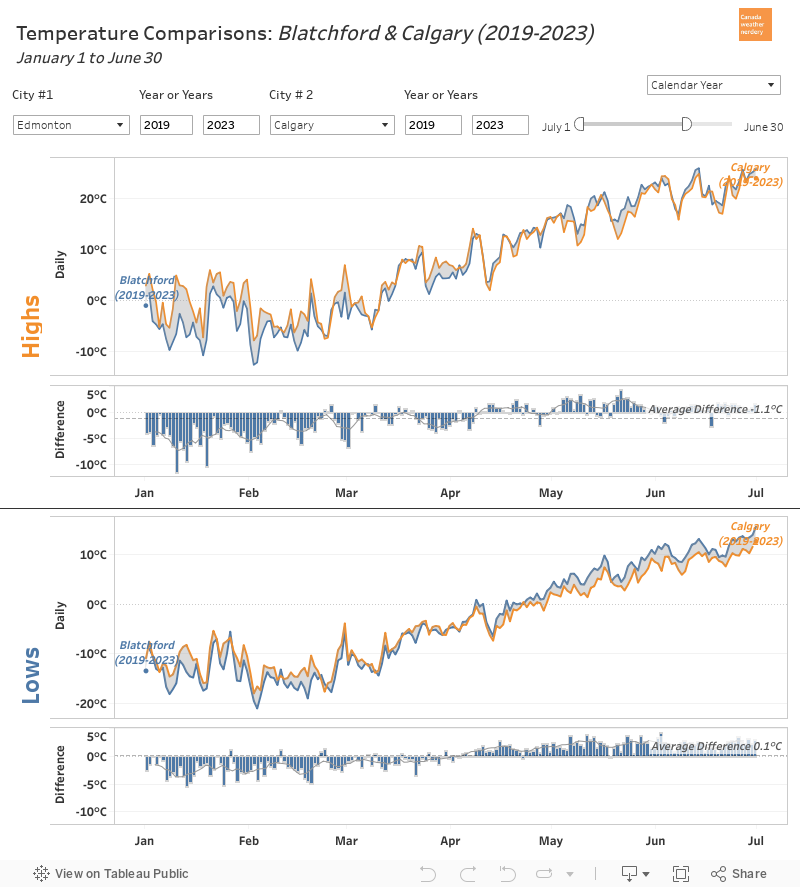
The largest gap 18.7°C on January 10th with Calgary's High up at 9.8°C while Edmonton's was down at -8.9°C. The largest gap for Edmonton was 12°C on May 21st, with Edmonton at 19.6°C and Calgary at 7.6°C, and that was part of an entire cool week for Calgary.


Edmonton History


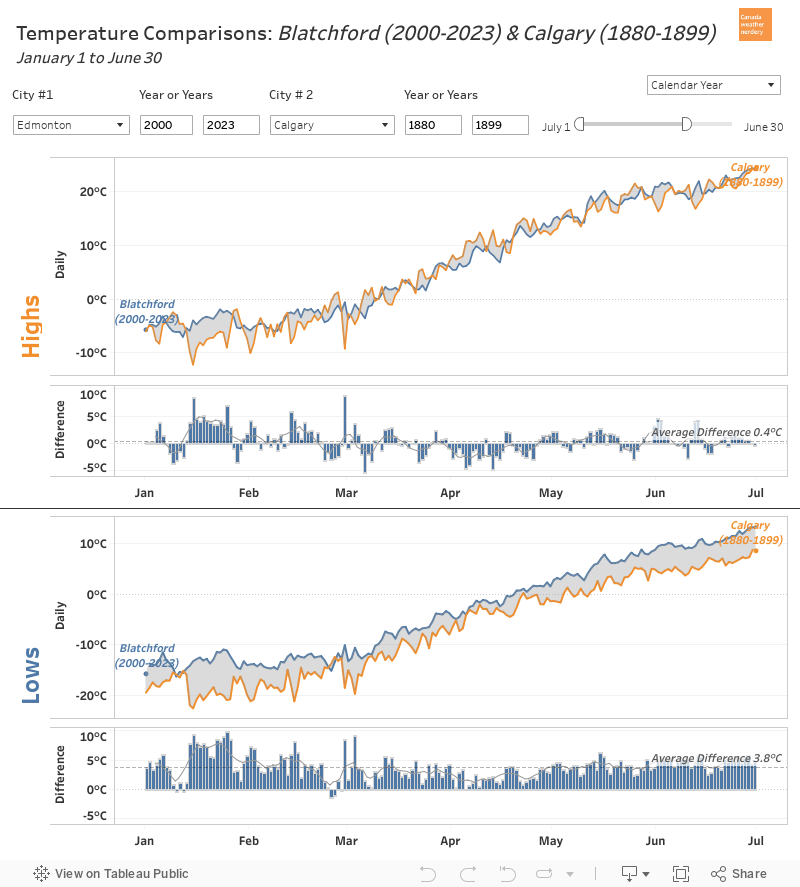
One other thing that we can use this dashboard for is to compare Edmonton's current temperatures to its past. Here we have the 20-year average for 2000-2019 compared to 1880-1899

Unfortunately because of the way this is set up both eras appear in blue, but in the bargraph a value that is above 0 means that 2000-2019 is warmer, and below 0 means 1880-1899 was warmer.

For the Lows we can see that modern temperatures are warmer than they used to be for almost the entire year (with a weird little exception right around December 8th). Typically modern Lows are about 4°C warmer than they used to be, but in January & February that increases to 8°C to 10°C.

For the Highs January & February have also seen the biggest changes, warming by about 6°C. For the rest of the year the Highs are a little more variable. For the summer months of July, August & September the modern average temperatures are a little bit warmer, but generally by less than 1°C.


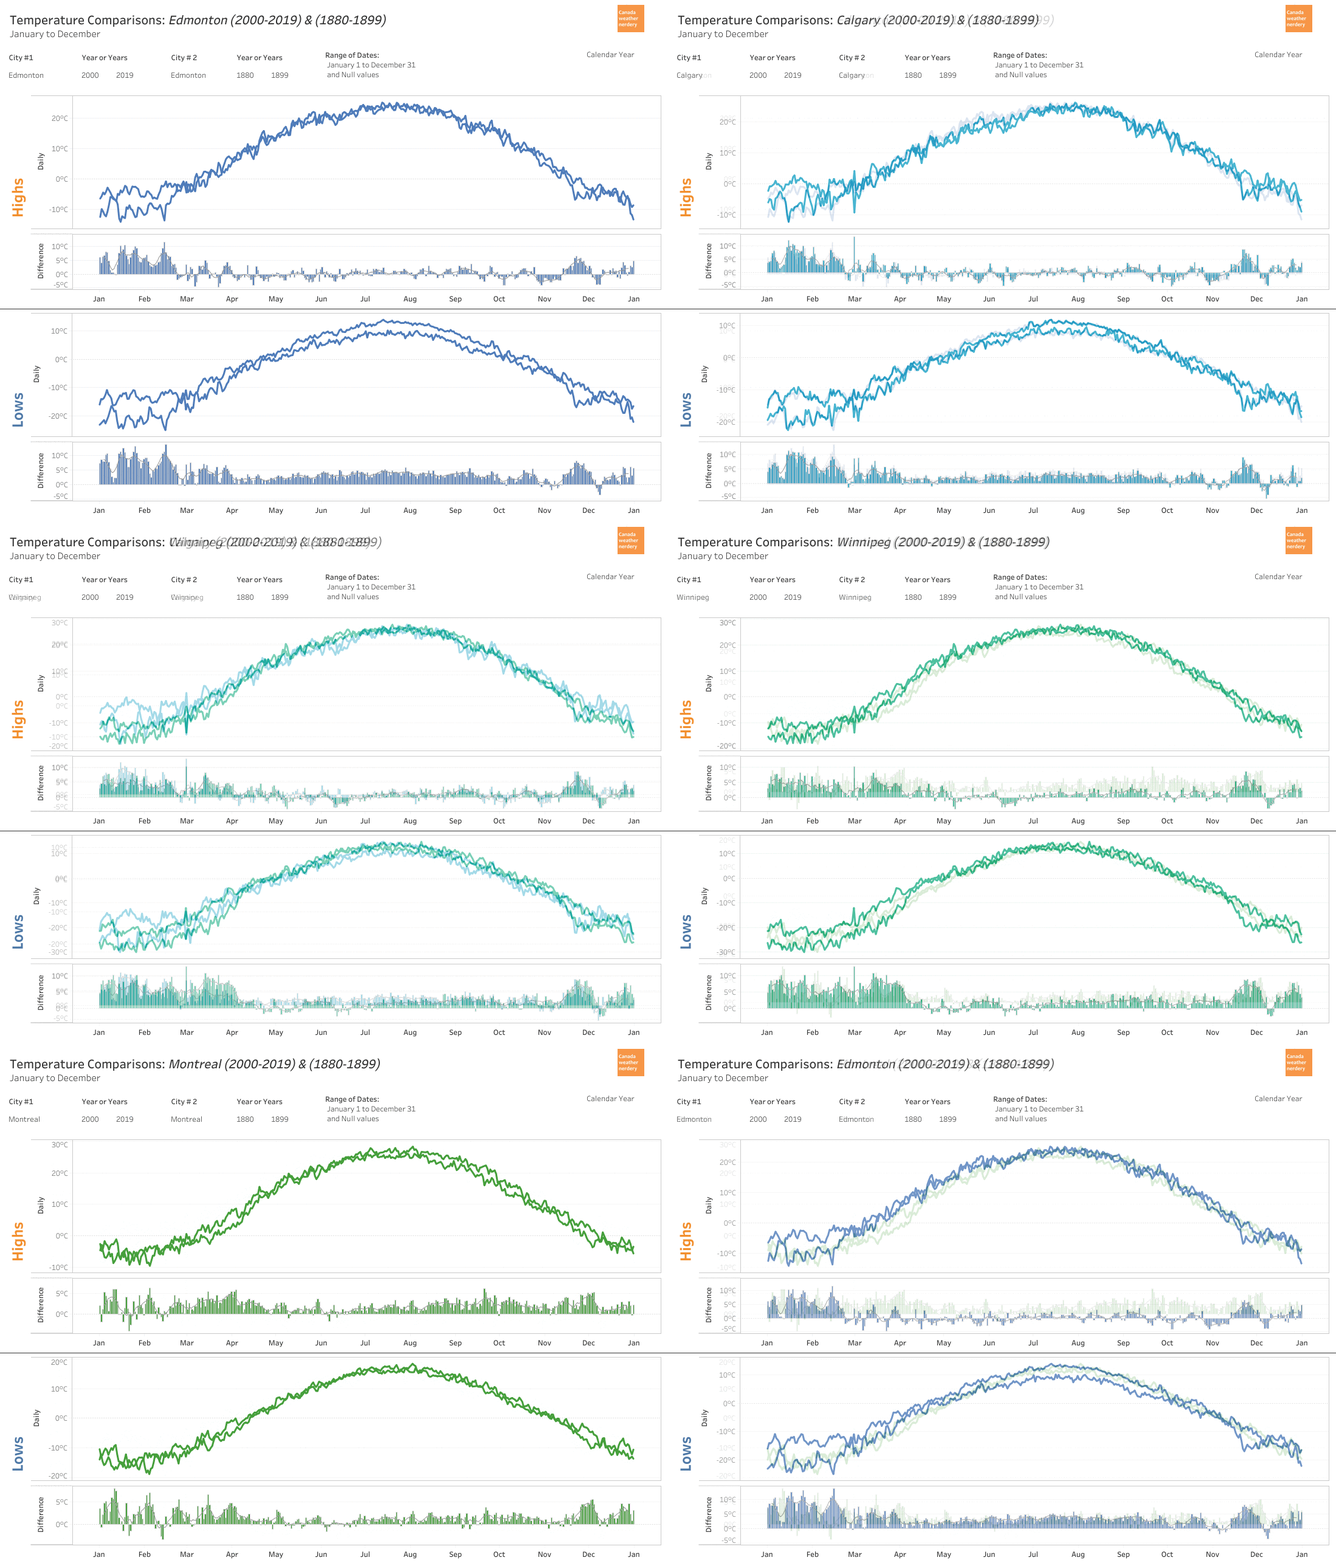
For some context here we have 2000-2019 vs. 1880-1899 for Edmonton, Calgary, Winnipeg and Montréal. It's easiest to focus on the bargraphs, and the patterns for Edmonton, Calgary & Winnipeg are all quite similar, with lots of warming in the winter, and a year-round increase in Low temperatures. Montréal is a bit different though, also seeing an increase in late-summer High temperatures.


This chart is the same idea, but it cycles through all of the years since 1880 for Edmonton. Watching all of the years roll by the big changes really start to happen in 1980-1999, and then 2000-2019.


Blatchford & The Edmonton International: 2019


One final thing that we can do with this dashboard is compare the temperatures of downtown Edmonton (Blatchford) to the International Airport.

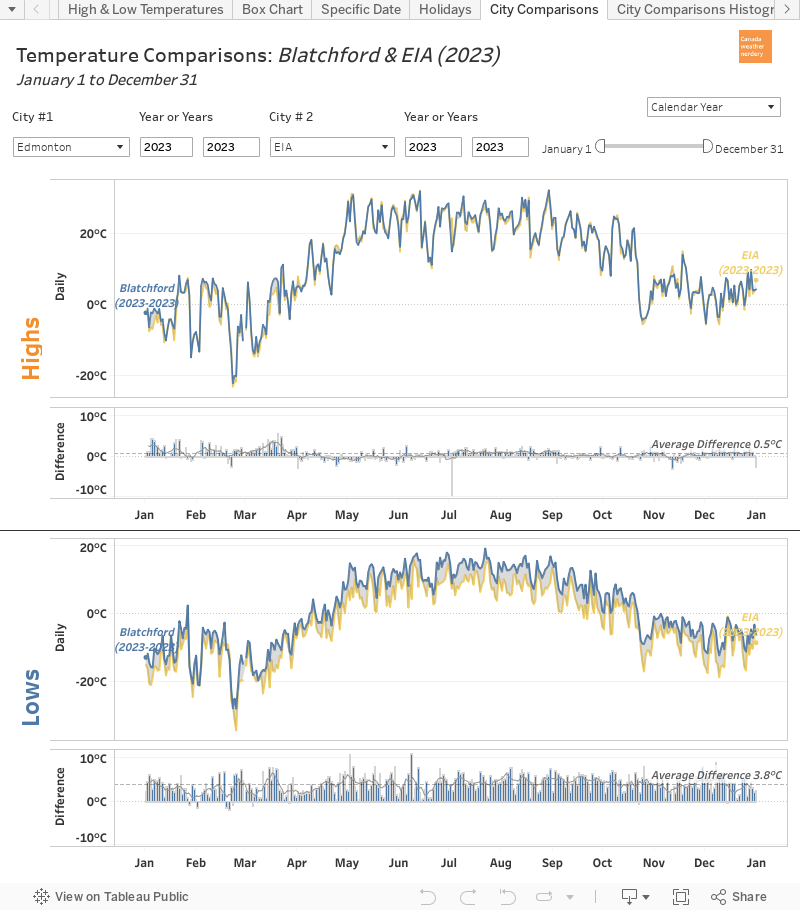
For the average High temperatures the two stations are fairly close for most of the year, with the biggest gap happening in the spring with Blatchford about 1.5°C warmer than the International. For the average Lows the International is about 3.5°C colder than Blatchford for most of the year.

Those are just the averages though, so let's look at one specific year:


Daily data is a little bumpy, and so here it's easiest to focus on the bargraphs. For the Highs we see a lot of spikes in March with Blatchford 5°C or 8°C warmer than the International.

For the Lows, for some of the very cold days in February there was a 10°C or 12°C difference between the stations: on February 4th Blatchford hit -29.5°C while the International was at -39.5°C; on March 2nd Blatchford was at -28°C with the International at -36.9°C, and on March 6th Blatchford hit -19.1°C with the International at -29.2°C.

You might think that Blatchford is warmer just because it's the big city, but we can compare the airport to a few other outlying stations:


Blatchford tends to be the warmest station in the region, but Stony Plain's winter Lows also average about 4°C warmer than the International. For Namao and Ft. Saskatchewan the differences are not as big, but they're also both consistently warmer than the airport. We have talked about this before, but when the airport gets cold it gets really cold.

And that brings us to the end for today. All of these examples were Edmonton-centric, but the data is also available for Vancouver, Calgary, Winnipeg, Toronto, Ottawa, Montréal & St. John's.

2019/03/22

Freeze/Thaw Cycles: Part 2 - Versus Round

Last week in Free/Thaw Cycles: Part 1 we looked at how the number of freeze/thaw cycles in Edmonton each year has changed over time. Today we are going to expand that to look at a few of Canada's other winter cities.

The weather stations which we will be comparing today are:
    • Edmonton Blatchford (2km from downtown)
    • Edmonton International Airport (25km from downtown)
    • Calgary International Airport (9km from downtown)
    • Winnipeg International Airport (6km from downtown)
    • Montreal Airport (13km from downtown)

Each time that we look at the data from these other cities it is with the caveat that the data is not necessarily 100% equivalent because of where the stations are located. But these stations are the ones with a long history of data, and so they might not be perfect but they are what we have available.

Also, counting freeze/thaw cycles is a little bit complicated, and the methodology which we used was explained in Freeze/Thaw Cycles: Appendix.


And now, let's go:

Freeze/Thaw Cycles Each Year

Here we have the freeze/thaw cycles each year for each of the stations. The 5-year averages are included as dotted lines to get rid of some of the noise from the yearly numbers.
  • Blatchford averages about 90 freeze/thaw cycles, which has been consistent since about the 1930s. Before that it was up around 110.
  • The Edmonton International in recent years has had around 120~125 freeze/thaw cycles each year, which is up from the 110 which it used to get in the 1960s.
  • Calgary has averaged about 125 freeze/thaw cycles going back to around the 1940s. Before that it was up at around 140.
  • Winnipeg has hovered around 75 freeze/thaw cycles for the last century. Sometimes it is a bit below, and right now it is a bit above.
  • Montreal used to be at around 60 freeze/thaw cycles but right now is at around 70.

It is not surprising to see that Calgary has more freeze/thaw cycles than Edmonton, but so does the Edmonton International? And for the last 10 years the Edmonton International has almost been tied with Calgary? And obviously Winnipeg has fewer freeze/thaw cycles than Calgary or Edmonton, but Montreal is down there too for some reason? What's going on?


Freeze/Thaw Cycles Each Month

Here we have the average number of freeze/thaw cycles each month for these stations, for 2000-2018.
  • Blatchford is middle-of-the-pack for most of the year. But in the shoulder-season months - April, May, October - it's the 2nd lowest, above only Montreal. 
  • The Edmonton International is middle-of-the-pack during the winter - December, January & February. But for the rest of the year it's very high, especially in April, September & October.
  • Calgary is highest in the deep-winter months of November through March. It is middle-of-the-pack during the shoulder-season months.
  • Winnipeg is the lowest by far during December-March. It's fairly high for April-June.
  • Montreal is the lowest by far during the shoulder-season months of April, May, September & October. For December it is a little above Edmonton, and for January & February it is below.
For the yearly counts of freeze/thaw cycles we saw that Calgary and the Edmonton International had similar totals. Here can see that even though the yearly numbers are similar, they are coming from very different places. Calgary's "extra" freeze/thaw cycles are in the deep-winter, while the Edmonton International's are in the late-spring and early-autumn.

We also saw that the yearly totals for Winnipeg and Montreal were both quite low. Compared to the other cities Winnipeg is "missing" freeze/thaw cycles during the deep-winter, while for Montreal it is the spring & autumn which are very low.


Thawing Days & Freezing Nights Each Month

Here were are comparing the freeze/thaw cycles for the stations again, but this time we have added the number of Highs Above Freezing in red, and the Lows Below Freezing in blue.

In Part 1 we saw that there are different drivers for freeze/thaw cycles depending on where we are in the year. In the winter warm days are relatively rare, and so a freeze/thaw doesn't happen unless there is a warm day. On the other hand, in the spring & autumn most days are above freezing, and so a freeze/thaw doesn't happen without a cold night.

In the animated version of this chart there is a lot of stuff going on, so let's take a look at each station individually.

Blatchford

Blatchford is pretty middle-of-the-pack across the board. Its Highs Above Freezing are pretty high in January & February, but they are still below Calgary. And its Lows Below Freezing are pretty low in April, May & October, but they are still above Montreal.


Edmonton International Airport

For the Edmonton International the story is that it gets a lot of Lows Below Freezing in April, May, September & October. Its Highs Above Freezing are middle-of-the pack and a close match to Blatchford, but all of the freezing nights during the shoulder-season months are what sets it apart.


Calgary International


For Calgary it is not a surprise that there are a lot of mid-winter Highs Above Freezing. For December-February it averages about 5-7 per month more than Edmonton, 7-10 more than Montreal, and 12-15 more than Winnipeg. It's Lows Below Freezing are in the middle-of-the-pack for most of the year.


Winnipeg International

For Winnipeg the story is the lack of Highs Above Freezing during the winter, with 5~10 fewer each month for December-March than the other cities. Its Lows Below Freezing are also high from January-May, but are middle-of-the-pack for September-December.


Montreal

For Montreal the number of Lows Below Freezing is the lowest of all of the stations for almost the entire year. And its Highs above Freezing are the highest for March-November, while being a little low for December-February.


Freeze/Thaw Cycles Each Year, Again

And so here we are back where we started, with the number of freeze/thaw cycles each year for each of the stations. But this time we have also added the number of Highs above freezing in red, and the Lows below freezing in blue.

The animated version of this chart is also pretty busy, so we will break the stations out separately again.


Blatchford

For Blatchford:

  • the yearly Highs above Freezing are in the middle of the pack
  • the Lows below Freezing have fallen to the bottom of the prairie stations, but with about 175 per year they are still well above Montreal's 145ish.
  • as we saw at the start today, the freeze/thaw cycles are in the middle.


 Edmonton International Airport

For the Edmonton International:
  • the Highs above Freezing are in the middle of the pack
  • the Lows below Freezing are the highest for all of these stations.

 Calgary International

For Calgary:
  • the Highs above Freezing are the highest for all of the stations, and have stayed fairly constant at around 300 over the past century.
  • the Lows below Freezing are in the middle of the pack, and have fallen from an average of about 200 a century ago to around 175 today.
  • as we saw at the start today, the freeze/thaw cycles have decreased from about 140 to around 125 today.

Winnipeg International

For Winnipeg:
  • the Highs above Freezing are the the lowest for all of the stations, and have stayed fairly constant at around 250 over the past century.
  • the Lows below Freezing are in the middle of the pack, and have stayed at around 185 for the past century.
  • the freeze/thaw cycles have stayed constant at around 75.

Montreal

For finally, for Montreal:
  • the Highs above Freezing are above Edmonton but below Calgary, and have increased from about 275 a century ago to just under 300 today.
  • the Lows below Freezing are the very bottom, and well below these other stations. Montreal has about 150, compared to 175-200 for the others.
  • and with that the freeze/thaw cycles have increased from an average of about 60 a century ago to about 70 today.

Summary

As we saw last week in Part 1, freeze/thaw cycles have always been a part of Canadian winters. And to have a freeze/thaw cycle you need both a freeze and a thaw.

  • Calgary gets a lot of freeze/thaw cycles because it has a lot of mid-winter thaws.
  • The Edmonton International also has a lot of freeze/thaw cycles, but that's because of its many shoulder-season freezes (and it also has a reasonably high number of mid-winter melts).
  • Winnipeg's freeze/thaw cycles are low because it has very few mid-winter melts - 1/4 as many as Calgary, or 1/3 as many as Edmonton.
  • Montreal's freeze/thaw cycles are low because it doesn't have many shoulder-season freezes.