The Shape of Winter

Here we have the range of Calgary's daily High temperatures for November through the end of March.
- The line in the middle is the 30-year average
- The grey section is the 25th-75th percentiles, where temperatures will fall about half of the time.
- The top of the orange section is the warmest temperature recorded in the past 30 years, and the thin orange line above that is the warmest recorded temperature going back to 1885.
- The bottom of the blue section is the coldest temperature recorded in the past 30 years, and the thin blue line below that is the coldest recorded temperature going back to 1885.
- The weird spike at the end of February is February 29th. Since it only has one quarter as much data as the other days its numbers are more easily skewed.
In the winter Calgary's High temperatures drop until about Christmas, which is where the big green arrow is. The average climbs a little bit after that, but it spends most of January & February hanging out between about 0°C and -2°C. Then at the beginning of March it finally starts to warm up again towards spring.
What we see here is just the average and the overall range though, and in a little bit we will talk about specific years. But to get a sense of how warm or cold the various winters were the bar graph at the bottom of this chart compares the Highs each November-March to the 30-year average.
- The 3 bars furthest to the right are all blue because they were colder than the 30-year average: 2018-2019 & 2016-2017 at -0.7°C colder, and 2017-2018 at -2.3°C colder.
- 2015-2016 was an El Niño winter and it was 3°C warmer, and 2014-2015 was also 1.9°C warmer.

And here we are looking at Calgary's daily Low temperatures.
Similar to the High temperatures the average Low bottoms-out around Christmas, and then it hangs around there until the beginning of March before really warming up. The average Low for January & February is between -12°C and -15°C.
Looking at the bargraph at the bottom again, the average Low (the thin black line) is about as high as its ever been, and back in the 1890s and the 1970s the average Low was 3°C about colder than now.
3°C colder doesn't sound all that cold, but if we compare the record-coldest days (the thin blue line) to the coldest days in the past 30 years (the blue range) the gap is sometimes as much as 15°C. On the other hand the gap between the record-warmest and the 30-year-warmest is much smaller, and is typically less that 3°C.

If you want to play around with the data it is all accessible in this dashboard. At the top-right you can choose different cities to see how they compare.
- Calgary's average deep-winter High of ~0°C is below Vancouver's 6°C, about the same as Toronto, above Edmonton & Montréal at about -4°C, and way above Winnipeg's -10°C.
- Calgary's average deep-winter Low of about -12°C is below Vancouver at 1°C or Toronto at -7°C, about the same as Edmonton and Montréal at -13°C, and everyone is way above Winnipeg at -21°C
The averages for Calgary and Edmonton might seem surprisingly similar to the central cities, but the 30-year-coldest temperatures for the prairie cities are much colder. And the deep-winter in Calgary and Edmonton lasts much longer - basically all of January & February - where Montréal's temperatures bottom-out in late-January and start warming again in mid-February.
Winter 2018-2019

Here's a look at Calgary's Low temperatures from 2018-2019. It's always tough to remember how a winter went, but for November, December & January it was a pretty warm winter with Lows mostly well above the average, and none hitting -20°C.
And then February 2019 happened. For about a month the temperatures hung out close to the bottom of the 30-year range, which included one Low at -31°C and 11 others below -25°C.
The bargraph at the bottom shows shows that even with the very cold February the the Lows during the winter of 2018-2019 were just -0.2°C colder than the 30-year average.
Winter 2017-2018

Continuing the theme, here we gone back one year further to 2017-2018. It had an average Low of -12.4°C which was -1.9°C colder than the 30-year.
It did not have any hugely cold months like February 2019, but it had coldsnaps in November, and December & February. And it didn't have all that many days above average.
The El Niño Winter of 2015-2016

And here we have jumped back two more years to the winter of 2015-2016, which was a big El Niño year. Its average Low was -7.2°C, which was 3.4°C warmer than the 30-year average, and which made it Calgary's 3rd warmest winter after 1925-1926 and 1930-1931. You might think "Wow, the 1920s and 1930s were really warm!" but those two winters were both unusual compared to their neighbours. In recent years the frequency of warm winters is higher.
The El Niño winter of 2015-2016 was well above average for a large portion of the time, with just two short coldsnaps right around Christmas and then in mid-January.
So those are just some examples of how variable different winters can be. We won't look at all of the winters here, but all of the data can be accessed through the dashboard.
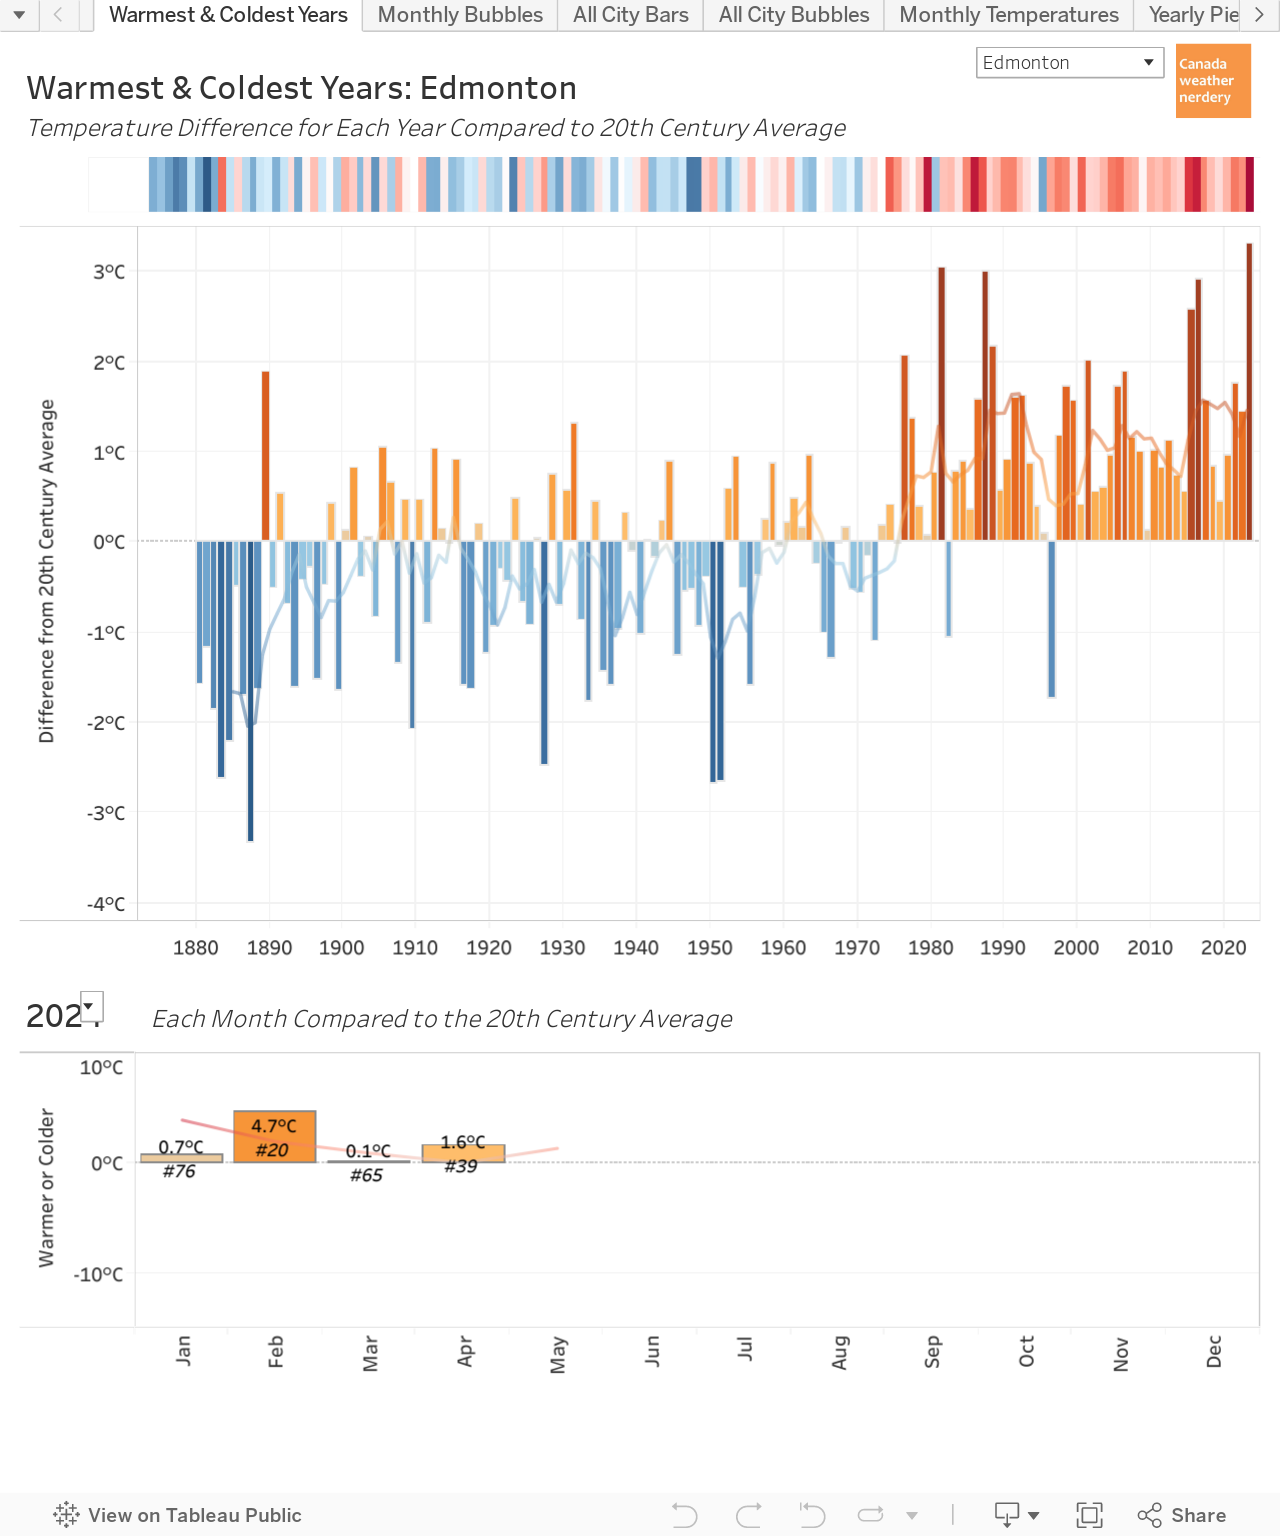
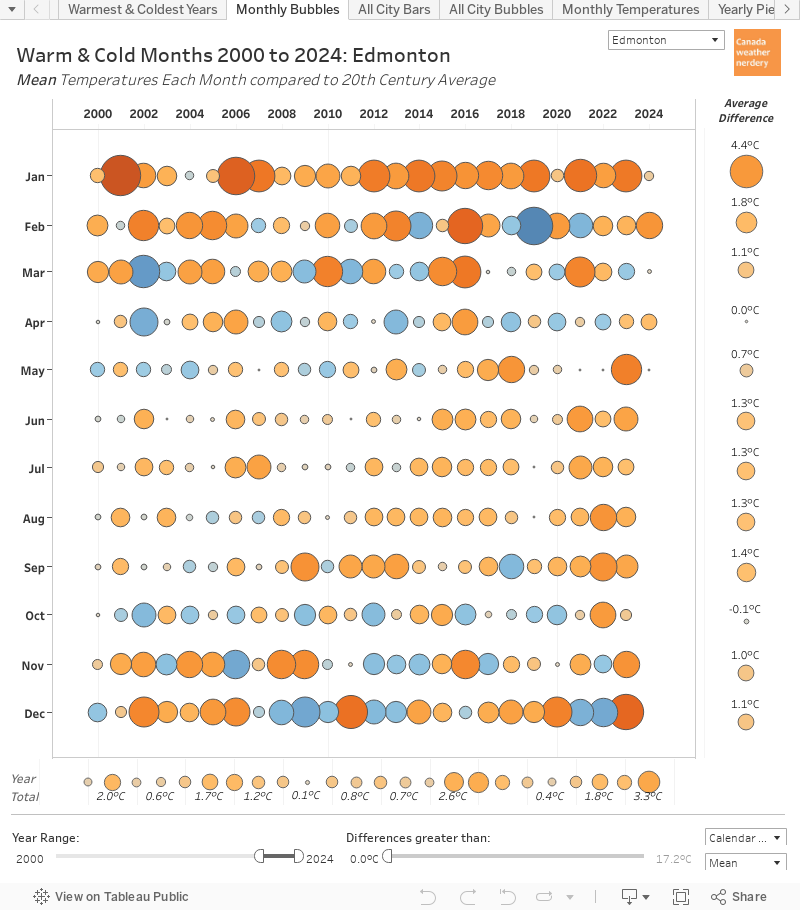
Warm & Cold Months

Here we have the recent history of warm & cold months in Calgary summed up as bubbles. It compares the mean temperature (combining the High & Low) of each month to the 20th century average. Orange bubbles are warmer and blue bubbles are colder, and the larger the bubble the further it was from the average.
February 2019 stands out as a big blue bubble which was -10.9°C colder than Calgary's 20th century average temperatures for February. That made it Calgary's most below-average month since January 1969, and the coldest February since 1936. The gap between 2019 and 1936 was pretty big though, with February 2019's average temperature at -18.2°C while February 1936 was down at -24.5°C
So February 2019 was really cold, and February 2018 was also pretty cold with another blue bubble representing -4.7°C below February's 20th century average. Looking back over the past 20 years February has had a few blue bubbles, but most February's have been orange, and that included a really warm February 2016 (El Niño again) at 8.7°C warmer than the 20th century average, with an average temperature of 1.4°C.
Looking at January's recent history there's only one small blue bubble, from back in 2004. All of the other recent January's have been warmer than the 20th century average, including some very warm months like 2019, 2015, 2014, 2007, 2006, 2001.
The bubbles on the far right of the chart show the average temperature difference for each month, and in the past 20 years Calgary's January's have been 3.9°C warmer than the 20th century average. And that dwarfs the changes seen in the other winter months which have warmed by maybe 1°C.

Here's the same chart again, but this time it shows the monthly history all the way back to the 1880s.
In recent years Calgary has definitely had some cold months - notably February 2019. In general though, it's a lot of orange circles. A century ago there were also some warm months - notably January 1926 and 1931. But a century ago warm months were much less common, and the chart gets a lot more blue the further that we go back.
This dashboard also includes data for the other Canadian cites if you want to explore. The cold February 2019 showed up all across the west, from Winnipeg all the way to Vancouver(!). And warm January's are common for the prairie cities, but in central Canada the warming is more spread out more throughout the year.
Chinooks & Warm Winter Days

Calgary is of course famous for its chinooks, and in this chart we have the High temperatures for each day in January going back to 2000. The pink squares are warm days with Highs above freezing, and blue is below freezing.
And there are a lot of warm days. January has 31 days, and Calgary averages about 18 with Highs above freezing. Some years have a lot, like 2006 which had 27, while a year like 2004 only had 15.
And this isn't a new thing:

Here we have Calgary's January Highs again, but this time for 1885-1904. It's not quite as pink as recent years, but the average was still 13 Highs above freezing in January.
As always this dashboard has all of the Canadian cities if you want to see how others compared.

This dashboard shows how the number of warm days each winter has changed over time. Here we are looking at the Highs of 0°C or more for the most wintery winter months of December, January & February.
From the start of December through the end of February there are about 90 days, and Calgary averages about 45 days with Highs of 0°C or more. 2018-2019, 2017-2018 & 2016-2017 were all a little low around 40, but just before that 2015-2016 & 2014-2015 were up around 55.
The average number of mid-winter 0°C Highs has moved around over the years - from 38 in the early-1950s and early-1970s, up to about 56 in the mid-1980s and mid-2000s. But the current average of 45 days has been pretty typical over the past century.

Here we have the same thing, but looking at Highs of 5°C or Higher. And in the 90 days from December-February Calgary averages about 29 days which hit 5°C. That average has also bounced around over the years, dropping to 15 days in the early-1950s, and peaking at 38 days in the early-1990s. So the current average of 29 days is on the high-side, but there has not been a steady increase.
We can also use this dashboard to look at 10°C mid-winter days, and right now Calgary averages 7 really warm days in December, January & February. Those really warm days also peaked in the mid-1990s with an average of 15, and there was a drought of them in the 1950s with an average of only 2.
So Calgary's "hot" days each winter are currently near the high end of the range, but it has not been a steady increase.
Cold Days

And for the flipside of warm winter days here we have the number of really cold Lows each winter.
Calgary currently averages about 7 days with Lows hitting -25°C each winter. 2018-2019 & 2017-2018 were both well above average with 13, and a few years before that 2015-2016 & 2014-2015 were down at 1 & 2 days respectively.
While Calgary's warm winter days haven't changed much its cold Lows have really dropped off, decreasing from an average of about 20 per winter in the 1950s & 1960s to the 7 today.
With this dashboard we can also look at -20s, -30s, -35s, -40s...
- Calgary averages about 20 -20°C Lows each winter. That average was as high as 40 days in the 1890s, 1950s and 1970s.
- Calgary can now go several winters without recording a -30°C Low, but a "bad" winter like 2017-2018 had 3. In the 1990s there were two winters (the volcano winters of 1995-1996 & 1996-1997) that had close to 15. And historically a bad winter would have had about 10 Lows hit -30°C, while some really bad winters had 20 or more.
- Calgary's last recorded -35°C was January 13, 2005. Days that cold were never an every-winter occurrence in Calgary, but they are less common than they used to be.
- Calgary's last recorded -40°C was January 24, 1954. The winter with the most was 1892-1893 with 6 Lows hitting -40°C.
It's reasonable to ask if this change in Lows is all because Calgary has grown as a city. For Edmonton the outlying areas and the city have seen a similar decrease in cold days over the years. That Edmonton-centric data is all available here, but we don't have a similar comparison for Calgary.
Frost-Free Days

In the deepest part of winter Calgary gets fewer really cold days than it used to, while the really warm days haven't changed all that much.
Here we have Calgary's frost-free season: from the last frost of spring to the first frost of fall. Over the years it has increased by more than a month, from an average of 90 days a century ago to 123 days today.
The average first fall frost has shifted from September 2nd to September 18th. And the average final spring frost has moved from June 4th to May 18th.
Once again, you might wonder if this is just because Calgary has grown into a large city? And again, we have a comparison for the Edmonton area here. Its outlying stations also saw the frost-free season increase by a month, but we haven't done a similar comparison for the Calgary region.
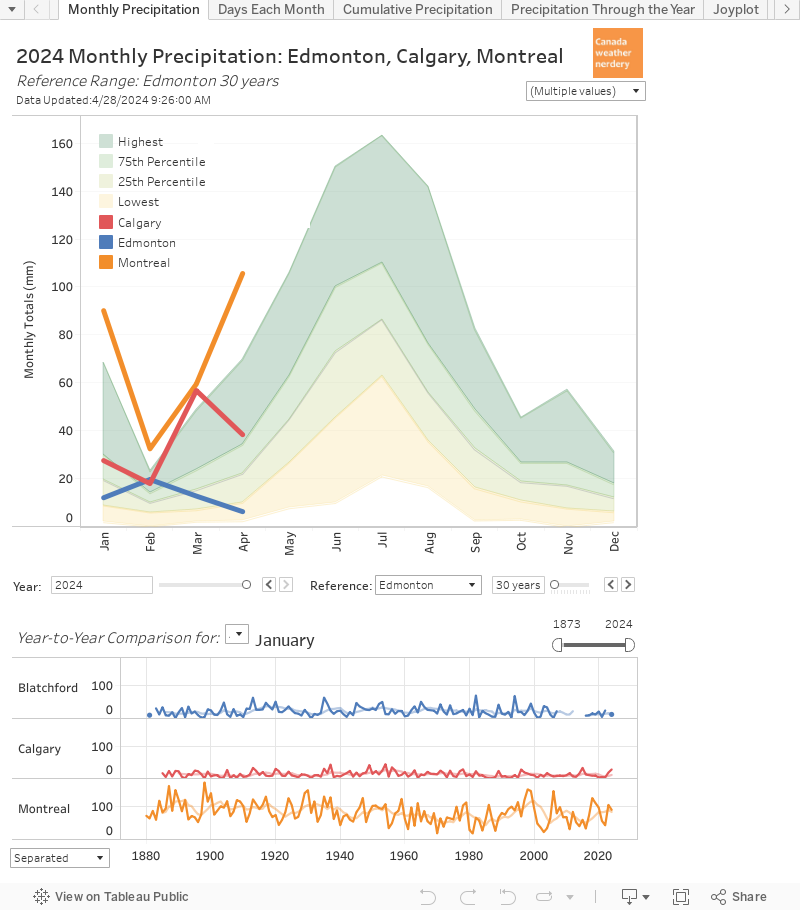
Snow!

Here we have the range of monthly snow for Calgary for the past 30 winters. Similar to the charts that we looked at earlier the line in the middle is the average, with the extremes on either side.
For Calgary the "real" winter months of November-April all average about 20cm of snow. On the ends of that October & May average about 10cm, and September averages about 3cm.
The orange line in this dashboard shows the winter of 2019-2020 so far. As I write this there has been no snow in November, but October was above average with 15cm, and September 2019 was Calgary's 5th snowiest September with 34.4 cm, and the snowiest September since 1972.
With this dashboard you can look at other winters, and recently last winter 2018-2019 had Calgary's snowiest recorded October with 48.4cm. And the winter before that 2017-2018 had Calgary's 3rd snowiest February with 43.3cm.

Over the course of a winter Calgary average about 135cm of snow. This dashboard shows last winter 2018-2019 which was above average with 168.9mm.
The little chart on the bottom of this dashboard shows the total snow each winter, and the average has been pretty consistently in the range of 135cm over the past century.
First & Last Snow

This chart shows the dates of the first and last snow recorded each winter, and how many days there are between them. And these dates haven't moved very much over the years.
The average first snowfall right now is September 25th. That's a little early because the last few years have had early September snow. 10 years ago there were a few years with late snow so the average was around October 12th. But late-September has been pretty typical for the last century.
The average final snow right now is May 4th, and +/- a few days that's been pretty typical going back a century.
From Calgary's first snow each fall to the last snow each spring there are about 222 days, and that hasn't really changed.
Lasting Snow

Environment Canada has only measured the depth of snow on the ground since 1955, so here is the relatively short history of snow-on-the-ground in Calgary. The orange blobs show when during the winter there was snow on the ground, and the gaps are when it melted away.
Even with the recent snowy Septembers and Octobers that snow usually doesn't start to hang around until November, and it's usually gone by the beginning of April.
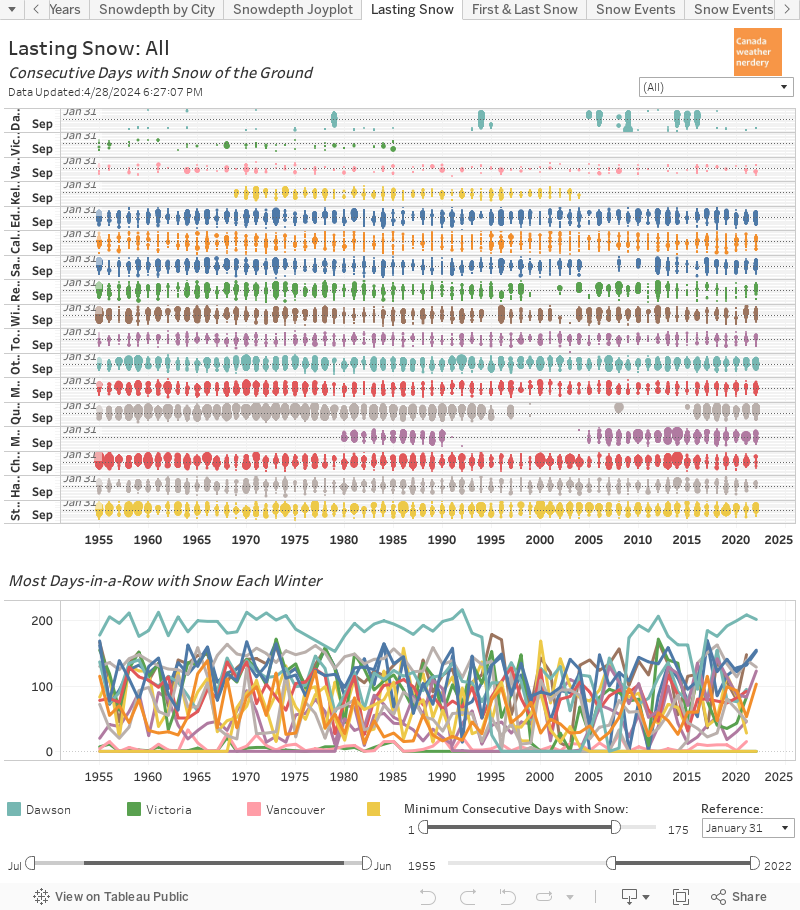
Calgary is of course famous for its chinooks which melt away the snow, and so here we have a comparison to Edmonton and Winnipeg.
In Edmonton and Winnipeg once the snow starts to hang around it usually stays until spring. The lines at the bottom of this chart show the longest period with snow each winter. For Edmonton and Winnipeg that's usually around 100-120 days. For Calgary the frequent melts mean 50 days-in-a-row with snow is a lot (although there will be several other shorter stretches each winter too)
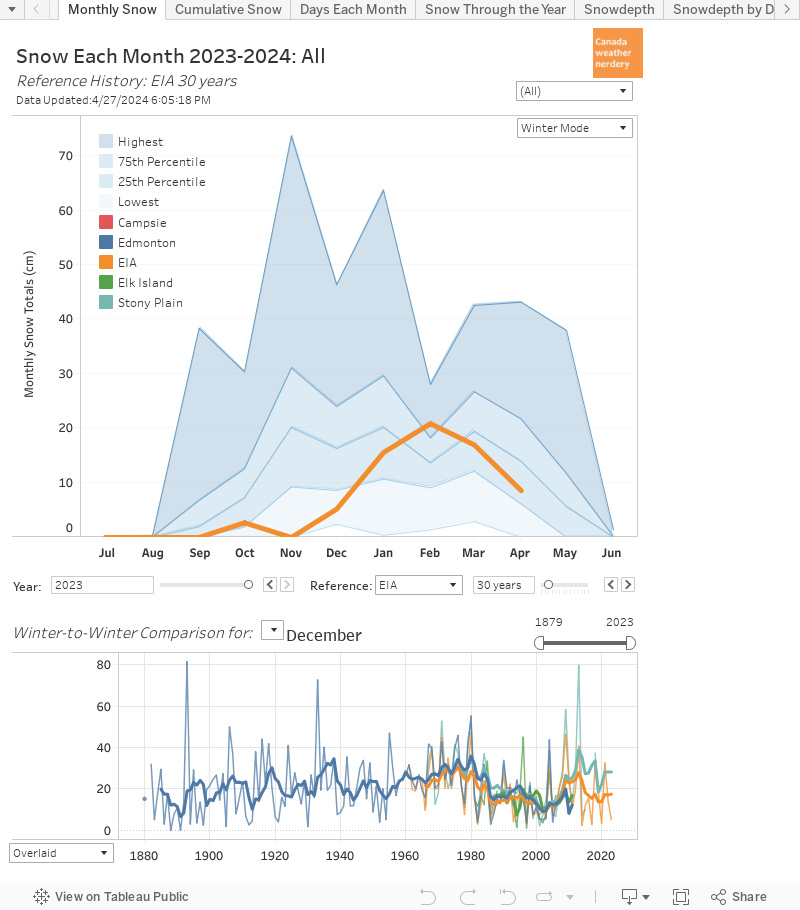
Snowdepth

And here we have how the snow piles up (on average) over the year.
On average Calgary's snowdepth peaks around New Year's at 6cm. That average is very low, and it's worth checking out the other cities just to see how different they are.
- Edmonton's average peaks at 20cm in early-February
- Winnipeg's average peaks at 23cm in mid-February
- Montreal's average peaks at 15cm in mid-February
- Ottawa's averages peaks at 33cm in mid-February
Calgary's peak average of 6cm is just the average though, and right after a storm it can be a lot higher. The orange line for 2019 shows a big blip up to 26cm at the end of September after a big storm.
In the chart at the bottom of this dashboard the thin orange lines are the peak snowdepth for each year. Around 20cm is a pretty typical maximum yearly snowdepth for Calgary, but some winters reached into the 30s and beyond.
Snowstorms

And speaking of big snowstorms here we have the history of single-day snowfall totals of 20cms or more. The bubbles show the individual storms, and the lines below count the number of storms each winter.
Many years get 1 20cm day, and some years get 2 of them. Recently September 29th 2019 had 24.6cm, and October 2nd 2018 had 32.8cm.
With this dashboard we can also filter for 15cm, 10cm, and 5cm storms. On average Calgary gets:
- 1 15cm day per winter, and a century ago the average was closer to 2 days.
- 3 10cm days, which hasn't changed much over time.
- 9 5cm days. That's up from the 1980s which averaged 5, but is fairly typical.

This is the same chart again, but here we have every day with recorded snow. Over the whole winter Calgary averages about 50 days with recorded snow, and that number has been fairly consistent since the 1940s. But before that the average was down around 40 or even 30 days. Even with the lower number of total days though, Calgary's average snowfall has usually been around 135cm each winter.
Winter Rain

And finally, here we have the number of days during the deep-winter (December, January & February) when Calgary has rain.
Since about the 1950s the frequency of rainy days has increased, and just since 2010 there have been a few more rainy days which has pushed the average up to 4 per winter. 4 days is not a big number, but it is the highest that it has been.
A century ago the rainy days were less common, but when it rained it tended to rain more which is why the bubbles are bigger.
Summary
So that is it for our big primer on winters in Calgary. A few of the high points:
- Calgary's average Highs & Lows drop until about Christmas. Then they hang out there for 2 months before warming up again.
- The number of really warm winter days each winter hasn't changed very much.
- The number of really cold winter days is half (or less) of what it used to be.
- The month which has seen the most warming is January, with recent January's on average 4°C warmer than the 20th century average.
- February 2019 was the most below-average month in 50 years.
- Snowfall each winter has stayed pretty consistently around 135cm.
- The months of November through April each average about 20cm of snowfall.
- September 2019, October 2018 & February 2017 were all very snowy.
- The dates of the first and last snow each winter have been pretty consistent over the past century.
- The average length of the frost-free season has increased by a month, from 90 days a century ago to 123 days today.
Normally at Edmonton Weather Nerdery we obviously focus on Edmonton. But if this Calgary-centric post prompts any questions please leave a comment, or tweet us at https://twitter.com/yegwxnerdery.