Today we're taking a very quick look back at the history of Halloween weather in Edmonton.
Temperatures & Precipitation
The average High on Halloween is has been 4.6°C, and the average Low -3.5°C.
Halloween 2018 was a little bit warm with a High of 8.3°C, 2016 & 2017 (and 2014) were right around average, and 2015 & 2013 were both a bit warm at around 10.7°C.
The last time that we had a below-freezing High on Halloween was 2012 at -6.6°C, and with a Low of -9.1°C
For precipitation 2017 had 6mm and 2015 had 3mm (and there was a gap in data
Trivia:
Edmonton's warmest Halloween was 1981, which was way up at 19.9°C
Edmonton's coldest Halloween was 3 years later in 1984, with a high of -18°C and a low of -24°C. 1984's High temperature of -18°C was lower than the Low temperatures of every other Halloween except for 1991.
Since 1981 Edmonton hasn't recorded a Halloween above 15°C. But prior to that there had been 9 warm Halloweens.
Prior to 1984 Edmonton hadn't recorded a Halloween below -15°C. But since then we've had 3 in 1984, 1991 and 2004.
Edmonton's snowiest Halloween was 1882 with 10.2cm of fresh snow.
Snow on the Ground
In recent years the only Halloween with recorded snow was 2017 with 2cm at the International.
The Halloweens with the most snow on the ground were 1984 with 16cm at the International (Blatchford had 15cm that year), and 1991 with 16cm at Blatchford (and 13cm at the International).
Halloween is just a little bit early for snow on the ground, but if you move the slider in this chart to November 7th or 15th the snow starts to pile up.
How did the weather for the 2019 Thanksgiving Long Weekend compare to recent years?
Temperatures
Thanksgiving 2019 was a late Thanksgiving, and it wasn't really cold, but it wasn't warm either.
Saturday's High of 11.9°C was above the Thanksgiving average of 11°C, and Friday also broke 10°C at 10.3°C. Things cooled off from Saturday & Sunday at 7.2°C & 4.4°C respectively.
In recent years:
Thanksgiving Monday in 2018 was below freezing at -1.8°C
2017 had two days above 15°C
2016's Highs were all below 3°C
2015 was a "hot" thanksgiving with one High at 26°C and another at 21°C
Precipitation
It was a fairly rainy Thanksgiving weekend, with the International getting 2.7mm on the Sunday and 3.6mm on the Monday. And Blatchford (not shown) was double that with 6.4mm of precipitation on the Sunday and 6.9mm on the Monday.
This year the International also recorded "trace" amounts of snow, but not enough to count as a measurement. Thanksgivings 2016-2018 were all snowier than that, with 2016 & 2018 getting a lot, and 2017 a little.
For 2015-2019 we've now had 5 Thanksgivings in-a-row with precipitation. And just before that from 2010-2014 we had 5 in-a-row without any.
Today we're going to be taking a look back at September of 2019. The summer of 2019 was generally pretty disappointing, and did that continue past labour day? Let's take a look.
High Temperatures
Here we have the daily High temperatures for September 2019 compared to the range of temperatures for the past 30 years.
The month has ended with a coldsnap, with the 27th-30th all around 5°C which is right at the bottom of our range for September.
In the middle of the month we had 10 days of above average temperatures. Most of those days were around the 75th percentile and weren't extremely warm, but 10 straight "warm" days was more than we had managed all summer.
The little bargraph at the bottom of this dashboard shows how September 2019's Highs compared to other years. And 2019 is a little bit hard to see, because it's just a touch below the 30-year average. It is dwarfed by 2018 which was -6.5°C below average, and had the 3rd coldest Highs since 1880.
In September 2019 we didn't have any days hit 25°C, while the September average is about 3 days. We did have 12 days hit 20°C though, compared to an average of 10.
We also had 2 Highs below 5°C. That is less than the 7(!) we had last year during the ridiculously cold September of 2018, but most Septembers have none.
The average High for September 2019 of 17°C is right in the middle of the pack, and was similar to 2014-2016. It was a lot warmer than 2018's 11.1°C, but a lot colder than 2009's 22.6°C.
Low Temperatures
For the Low temperatures September 2019 was mostly just above average...right up until the last week when things took a nosedive. We had a few days right at the bottom of the 30-year range, but that is still above the coldest-since-1880 records which are down around -10°C.
The little bargraph at the bottom again shows how the Lows compared. September 2019's average Low was 1.4°C above the 30-year average, and was almost 5°C above 2018.
This September Blatchford record 3 frosts. That is down from the 8 we had in 2019, but it is a lot compared to most Septembers. In recent years we went frost-free in September in 2015-2017 & 2011-2012.
The average Low of 7.3°C was slightly on the warmer side of things - well above 2018, but also above 2014-2016.
First Frost
The first fall frost of 2019 on September 27th was 3 days after Blatchford's average of September 24th. That made the frost-free season for 2019 145 days long, from May 5th to September 27th, and that is right around average.
2019 So Far
After the cool summer there had been some hope that September would finally turn things around. It didn't really manage that though, with our average High for May-September coming in at 19.7°C. That was 0.7°C cooler than the 30-year average, and ranks 98th out of 139.
This chart can also be flipped to the Lows temperatures. The May-September average Low of 9.0°C was just -0.1°C cooler than the 30-year average.
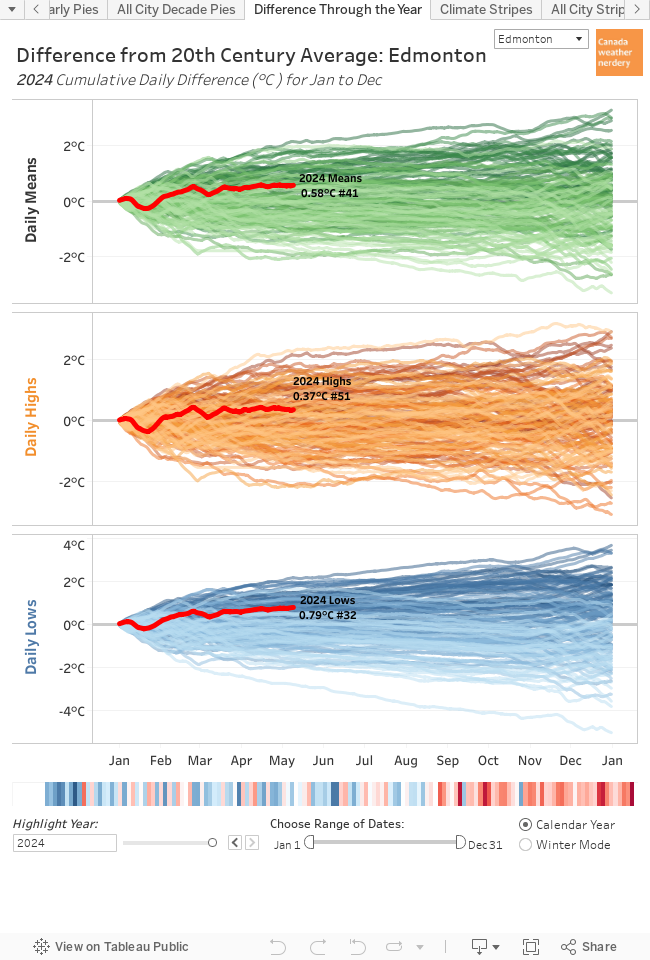
Combining the Highs & the Lows, September 2019's Mean temperature of 12.1°C was 1.4°C warmer than the 20th century average for September. That makes this 2019's largest orange circle (or warmest month compared to the 20th century average) since back in March.
This chart can also be flipped to show the Highs or the Lows. For the Highs September 2019 is a small orange circle, at 0.1°C warmer than the 20th century average. For the Lows it's a large~ish orange circle at 2.6°C above the 20th century.
This set of charts can be a bit cryptic, but on a day-by-day basis it compares how warm or cold the year has been. The top section is for Mean temperatures, and then that is separated into the Highs and Lows.
For 2019 so far our mean temperatures are just a bit above the 20th century average at 0.34°C. In recent years 2018 was 0.9°C above the 20th century average, 2017 was 1.6°C, 2016 was 2.9°C, and 2015 was 2.6°C. The last year that was close to the 20th century average was 2009 at 0.2°C difference, and the last below-average year was 1996 at -1.7°C colder.
And while 2019's mean is sitting right now at 0.34°C above the 20th century average, the Highs are at -0.1°C below while the Lows are at 0.8°C above. We still have October-December to go though, and the winter months can really change things.
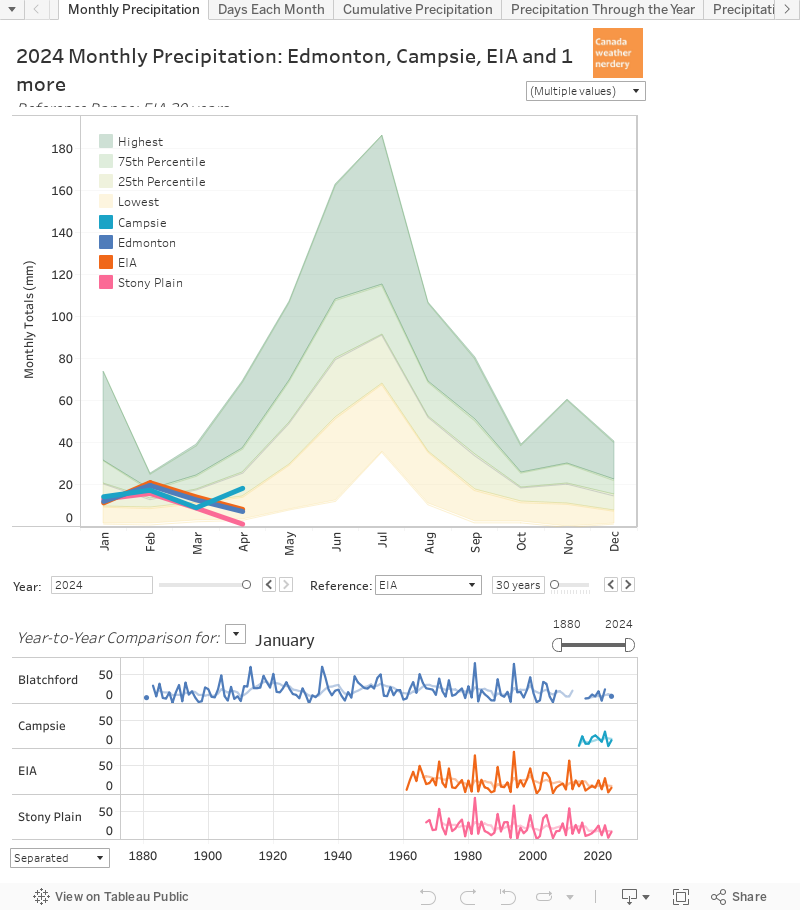
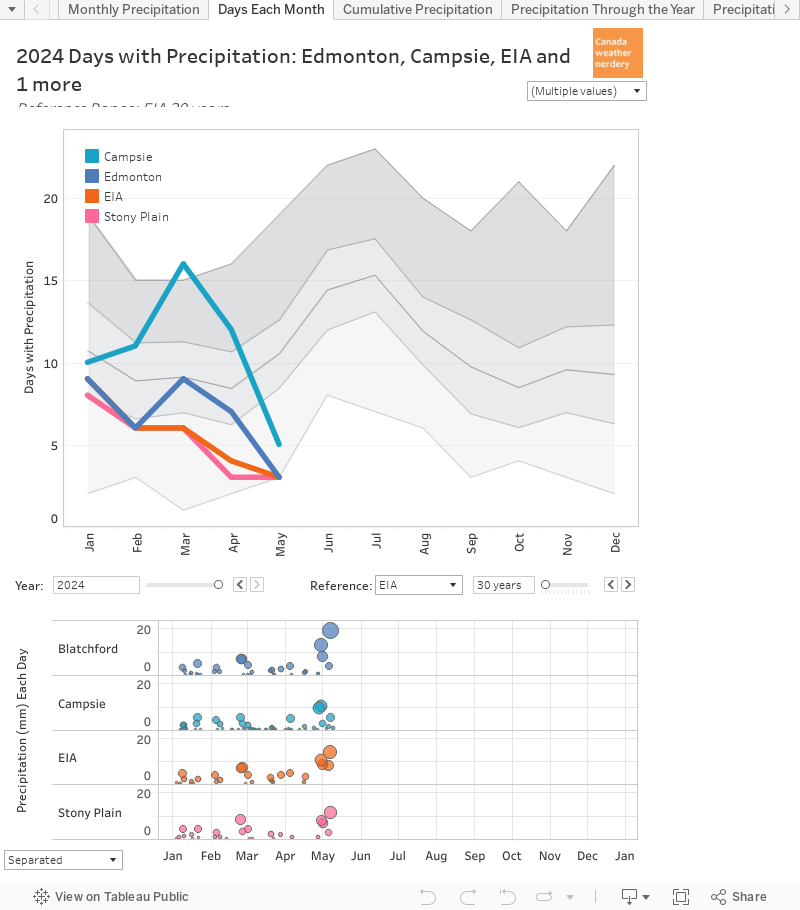
Precipitation
Switching over to precipitation, both Blatchford and the International were a little below the September average of 35mm. The International had 25.5mm and Blatchford had 24.2mm.
But even though our amount of precipitation was below average, our number of days with precipitation was a little bit above September's average of 10 days.
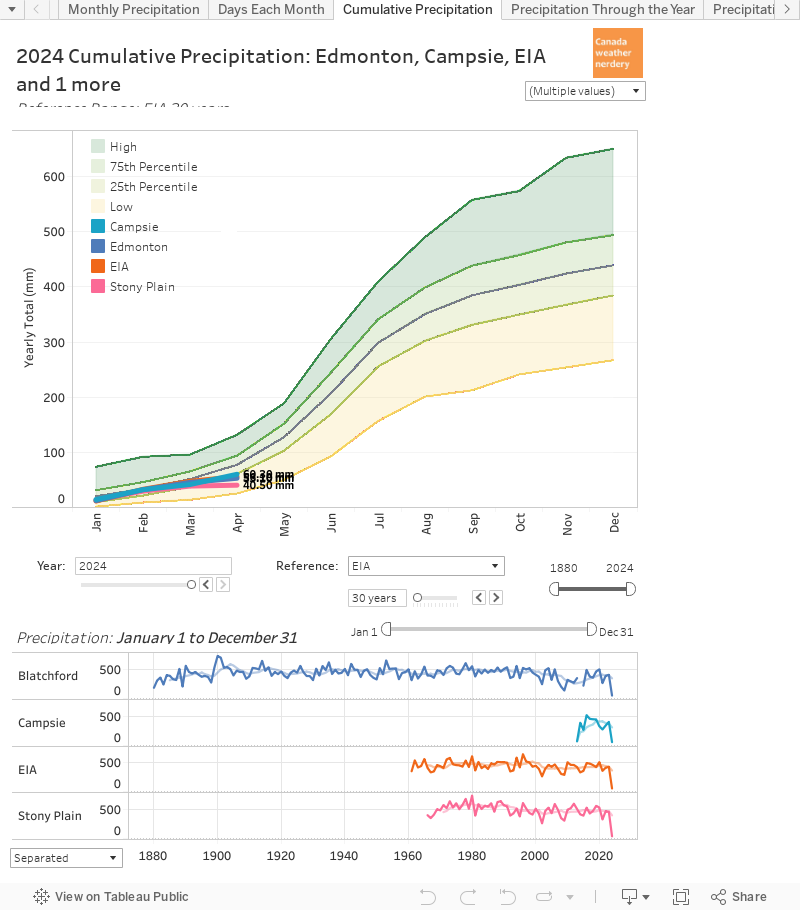
For the year so far Blatchford's total precipitation is a little bit above the average at 407.7mm, and the International is right around average at 373.8mm.
Snow
No snow!
Well, that's not quite right. The International reported "trace" amounts of snow on the 27th, 28th & 30th but they weren't enough to measure, so we're not counting them.
This chart has our history of September snowfalls for Blatchford (1880-2005) and the International (1960+).
2018 stands out with bubble after bubble after bubble for a record snowy month. But we also had significant September snow in 2017 and 2014, and one small snowfall in 2015. So in the last 5 years September snow has been quite common, but before that from 1992-2014 only two Septembers - 1999 & 2004 - had any snow.
We will talk a lot more about snow once it starts falling, but for today let's just look in awe at Calgary's 34.4cm of this September (which was all crammed into 4 days):
October Temperatures
Here's a look at what October could have in store for us.
We've mostly seen the end of our 20°C days, with October averaging only 1 per month. And we'll probably start seeing some below-freezing Highs, with October averaging 2 days below 0°C.
For Lows the frosts will undoubtedly start to ramp up, but October averages about 16 Lows above freezing.