2016/05/31

May Review / June Preview

It seems like I say this a lot, but "and so we come to the end of another warm month."


This May had more days above 25°C than in any of the last 20 years. And almost half of the month broke the 20°C mark, although that falls shy of the 19 days above 20°C in 1998.

There isn't much to say about the lows, beyond the fact that there were two nights that were just a touch below freezing. That's fairly typical, but about one quarter of the time May has no nights below 0°C.


Looking at June we see a lot more red. Although this May we had 6 days above 25°C, and in the last 20 years the only Junes that had more days than that above 25°C were 2015, 2006, 2004 and 2002. Even in terms of days above 20°C, the average for June is 17 which is only a bit more than the 15 that we had in May. In terms of lows, in the last 20 years there hasn't been a low below freezing during June.

Here's another look at where we've been, and what to expect:


The last two months really was a rollercoaster, with temperatures fluctuating between 20-year highs and 20-year lows. Although from the 2015 numbers for June and July, it looks like the same thing happened last year. And at the tail-end of this chart we can see temperatures start to trend downward again in late July.

The real story of May was the much needed precipitation:


The Blatchford data for precipitation isn't very good, so here I'm using information from the International Airport.

Prior to all of the rain on the May long weekend 2016 had been sitting in 2nd-last place, just above 2001. But with about 100mm of rain in the past two weeks, that pushed us up above the 20-year average. Unfortunately this chart isn't the easiest to read, but in a few weeks I'll take a look at Edmonton's monsoon season in more detail.

2016/05/24

2016 May Long Weekend Post-Mortem

I hadn't really planned on doing yet another post about the Victoria Day long weekend, but this year ended up being so cool and rainy that a recap is worthwhile.


In terms of temperatures we didn't have any days that dropped below freezing like we did in 2015.

But we did have three days where the highs didn't reach 10°C, and Monday just barely broke through at 11°C. Looking at the average daytime highs for all four days, that means that this was the coldest May long weekend of the last 22 years. Taking both the highs and lows into consideration 2010 was still a little bit cooler than 2016, although not by much.

In terms of precipitation though, 2016 is the clear winner for recent years:


And precipitation was particularly important in 2016, considering how little of it we had had so far this year. Environment Canada has a combined Total Precipitation measurement that includes rain and snow, which is what I'm using here.
Source: Environment Canada http://climate.weather.gc.ca/glossary_e.html#totalPrec


Through last week we'd had a little under 40mm of precipitation so far in 2016. But with the rains of the last week that has pushed our total up above 130mm, and right around the average.

A note about this chart: normally I like to use the Blatchford weather station which is near downtown Edmonton, but for this last chart I'm using the Edmonton International Aiport instead. Blatchford's precipitation data for 2016 is complete, but its historical dataset has entire months that are missing. I wanted to compare 2016 precipitation against the average, but I can't reliably calculate one for Blatchford. So here I have switched to the International, and I'll probably use it again in the future anytime that I'm looking at precipitation, or maybe some combination of it and Blatchford.

2016/05/19

A typical May long weekend

I don't think that there will be too many people complaining about Edmonton finally getting some rain:

Source:Environment Canada http://weather.gc.ca/city/pages/ab-50_metric_e.html

But as we head into what will probably be a cool and rainy long weekend, just a reminder that the forecast for this year is very typical for Victoria day.


This rather busy chart is from a more detailed look at May Long Weekend Weather that I did a few weeks ago.

2016/05/11

The Rollercoaster

Here are some fancy charts of Edmonton's yearly temperature rollercoaster:


These use data from the last 20 years rather than going all the way back to the 1880's, so they're roughly representative of what we except to see today. The white line is the average, the grey band is the 50%-of-the-time range, and the oranges and blues are the warm and cold extremes.

The low point on the rollercoaster is in mid-January - things bottom out around New Year's but then it takes another week or two for the upswing to start. And right now we are - somewhat distressingly - only about two months away from the high point in mid-July.


And here is the actual 2016 data. As we've seen before, it's been well above the average for pretty much the whole year, with the exception of a few weeks in January.

But the rollercoaster that's on my mind right now is the day-to-day one that we've been on recently:


This is the same data from the other charts, but it is zoomed-in to focus on the last month-and-a-half. And we really have seen some wild temperatures swings, with the highs rising and falling and rising and falling by 20°C over the span of a few days.

This year has had some very warm (although again, not unprecedented) days, but every spring pulls this trick. We get a few days of fake-summer - so we put away the sweaters, turn off the furnace, and grab the sunscreen - and then things return to normal (or below normal).


Not that I'm complaining. But with the weather we've had it's just strange to think that we can't count on days being consistently above 20°C until the start of July.

2016/05/07

Record Watch - First Week of May

Earlier this week I looked at the records that we broke on May 3 and May 4, and the one that we got close to on May 2.

And the final day of the week was another warm one, although not a record breaker:


29.2°C today puts us behind 29.9°C in 1987 and 29.4°C in 1953, but ahead of 28.9°C in 1908.

And with that, we finish a very warm week.


Here we have the 50 warmest days during the first week of May, going back to 1985.

2016 had 6 days in the top 50, in 3rd, 4th, 5th, 7th, 18th and 31st spots. It was the only year with 4 days above 25°C, and all of those days were actually above 28°C.


Taking a longer-term view, here are the 50 warmest during the first week of May, going all the way back 1880. (there is actually a 7-way tie for 50th position, so this is really the Top 56)

2016 still had 4 days in this list, in spots 3, 5, 8 and 13. The next closest year was 1911 with 3 days in 11th, 18th and 45th spots.

I grouped these by decade, because it's interesting to see that the 1920s and 1970s each only have one day in the list. The cutoff is quite high at 24.4°C, so those decades might have had other warm days, but not really warm days. The 2010s are only about half over, but between 2013 and 2016 there are already 6 days in the list. That matches the numbers for the 1910s, 1950s, 1980s and 1990s.

2016/05/05

May Long Weekend Weather

For many people the May long weekend marks the unofficial beginning of summer, but it also has the reputation of being something of a disappointment. Does it deserve its reputation?

Victoria Day is still a few weeks away, but I wanted to do this early before the longterm forecasts are available. This is more interesting when we don't know what 2016 has in store for us.

(the long weekend is technically only Saturday-Monday, but here I'll be including the Friday as well.)


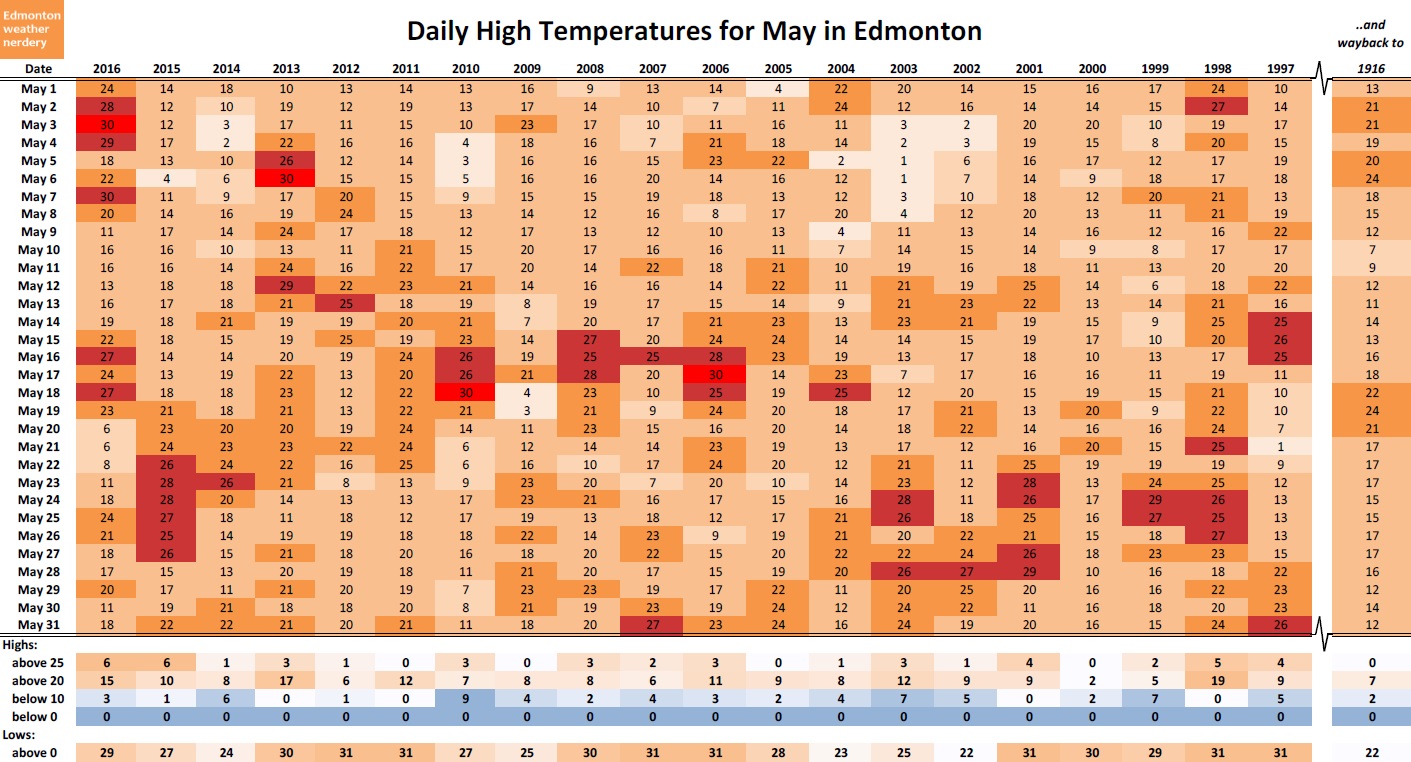
Anyone hoping for really "hot" weather is probably going to be disappointed most years. Going back to 1995 there have only been 2 days above 25°C.

Lowering expectations to 20°C helps a bit, but it's by no means a guarantee. In 9 of the last 21 years the temperature didn't reach 20°C on the May long weekend, and in the years when it did, in many cases it was just for a day or two. The only years with all four days above 20°C were 2008 and 2013, while 2011 managed a 3-day streak.

In terms of small victories, you can usually count on the daytime high temperatures to reach above 10°C. The coldest year was 2010 with 3 days below 10°C, and only 5 other years have had days that stayed below 10°C.


There's not much to say about the lows, beyond that fact that even in the cold years the temperature rarely drops below freezing. There have been plenty of lows around 0°C, but it has only dropped below that three times (one of which was last year in 2015)


This is the first time that I've used Environment Canada's precipitation data for anything, and that is partly because it isn't very reliable. There is no recorded data for 2000 or 2014, so in the graph those years show as 0, but that may or may not be correct. The data also doesn't distinguish between rain or snow - based on the temperatures this was probably mostly rain, but with some of the lows around freezing you never know.

So with those caveats we can see that rain-or-maybe-snow on the May long weekend is pretty common. Of the 19 years that have data, only 2004 and 2015 had no precipitation.

I don't have a great sense of what "a lot" or "a little" rain is though, so here is a comparison of how much rain we actually get on a typical rainy day.


On days that it rains in Edmonton, 38% of the time we'll get 1mm or less; 50% of the time it's 2mm or less, and 73% of the time it will be 5mm or less.

That helps put the May long weekend numbers in perspective because it means that the years when the precipitation was just a blip - 1996, 2003, 2013 - probably didn't seem too rainy. But once you get to 2mm in a day - 2002, 2007, 2008 - that is going to feel like a genuinely rainy day for Edmonton. Anything above 4mm or 5mm is going to be quite rainy, and for the days above 10mm - 1999, 2005, 2006 - that's a lot of rain for Edmonton. That's all just a guess though, because rain during the night or from a short thunderstorm isn't necessarily going to ruin a holiday.

Combining it all together then:


Here the summer~ish days (warm, and not rainy) are highlighted in orange.

As usual, this data is all from the Blatchford weather station in central Edmonton. The people who are most disappointed in the May long weekend typically want to go camping, and Edmonton weather won't be a perfect match for that. But looking at a year like 2010, most places within driving distance suffered a similarly cold and rainy few days.

So what to expect from a typical May long weekend in Edmonton?
  • It's almost never above 25°C
  • It's almost never below 0°C
  • It's above 20°C less than half of the time
  • 75% of the time there's at least one genuinely rainy day, and 90% of the time there's at least a little rain.
Usually I try to find the silver-lining in our weather, but this one is kind of hit-or-miss.

2016/05/04

Record Watch - May 4

And one more. 28.6°C beating the previous records of 27.8°C from 1944, 26.7°C from 1957 and 26°C from 1992.


It looks like we should get a break for a day or two, before things warm up again on the weekend.

It's maybe a little interesting to note that the records we've been breaking or bumping up against have all been from different years: 1980 and 1998 for May 2; 1945 and 1909 for May 3, and 1944 and 1957 for May 4.

2016/05/03

Record Watch - May 3

Today wasn't even a close one, with the high of 29.4°C well above the previous records of 27.8°C in 1945 and 26.1°C in 1909. And the overnight low of 13.6°C almost matched the average daytime high for this time of year (although as I've mentioned, averages are not normal)


And there's at least one more very warm day in the forecast for tomorrow.

Record Watch - May 2

I won't do this everytime that it's warm, but 28°C on May 2nd feels pretty noteworthy.

It wasn't quite a record though, coming in second behind 28.7°C in 1980, but above 27.1°C in 1998.


There are still some very warm days in the forecast, and the records for May 3rd and 4th are a little lower at 27.8°C, so we'll see how things go this week.