2020/12/31

December 2020 Review / January 2021 Preview

Today we are taking a quick look back at Edmonton's weather for December, 2020. This will be a little bit shorter than the typical months-in-review because a lot of things will be covered in the 2020 Year-in-Review Spectacular instead.


High Temperatures

December 2020 started warm, cooled-off for a week in the middle, warmed-up again for a week around Christmas, and then finished things a little bit above average. We didn't set any new records, although the start of the month was right up at the top of our 30-year range. For the month as a whole 23 Highs were above the 30-year average and 8 were below.

It always seems surprising, but in December Edmonton averages about 10 days with Highs above freezing (which show up here as the pink squares). Some years are well below that: 2012 had 3, 2009 had 1, and 2010 had 0. 

December 2020 had 17 Highs above freezing, and that ties 2017 but is below the 19 in 2011 or the 23 in 1999. 2020 also had 10 Highs which broke 5°C, and December only averages 3 of those. 2020's 10 matches 2011 and 1997 for the most 5°C Highs in recent years. 2020 did not break 10°C though, which happened in 2017, 2014, 1999 & 1997.

The coldest High was -17.9°C on December 13th, and about one third of the time December doesn't have any Highs below -15°C.


Low Temperatures

The Lows looked a lot like the Highs, with a warm start, slightly cool middle, warm Christmas, and slightly above-average ending. 24 Lows were above the 30-year and 7 were below.

The first -20°C Low of the winter of 2020-2021 was on December 18th at -20.5°C. On average December has 4~5 below -20°C but this year it was just the one.


December Through History

December 2020 ended up as a warm December. The average High of 0.4°C ranks as the 11th warmest since 1880, with the average Low of -8.9°C as the 14th warmest. In recent years Decembers 1999, 1997 and 2011 were all warmer, ranking #1-3 respectively for Highs.


December 2020's Mean temperatures (the average of the Highs & Lows) was 6°C warmer than the 20th Century average for December. That makes it the most above-average month of 2020, with February as the next highest at 4.3°C above average. 

December being 6°C above-average is pretty unusual, because since 2000 only the 13 months have been that far above average. 6 of those were Januarys (including January 2001 at 10.8°C above average), 2 were Februarys, 3 were Marches, and December 2011 also came in at 7.3°C.


Snowfall

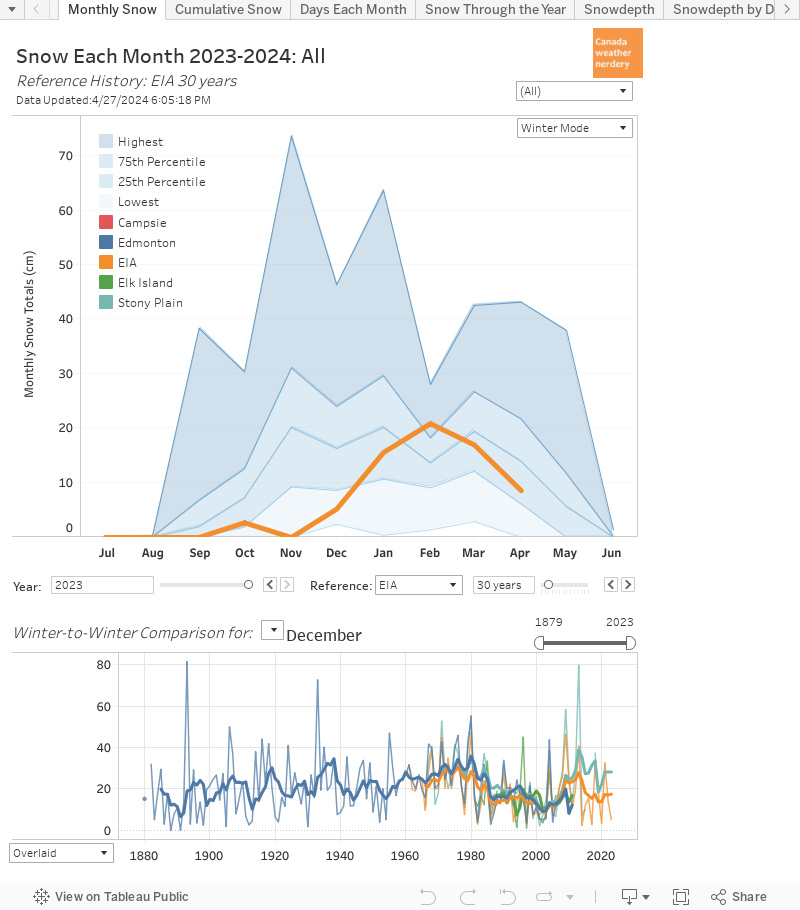
The International Airport recorded 3.4cm of snow in December 2020, which puts it in the bottom-5 leasts snowy Decembers for the airport.
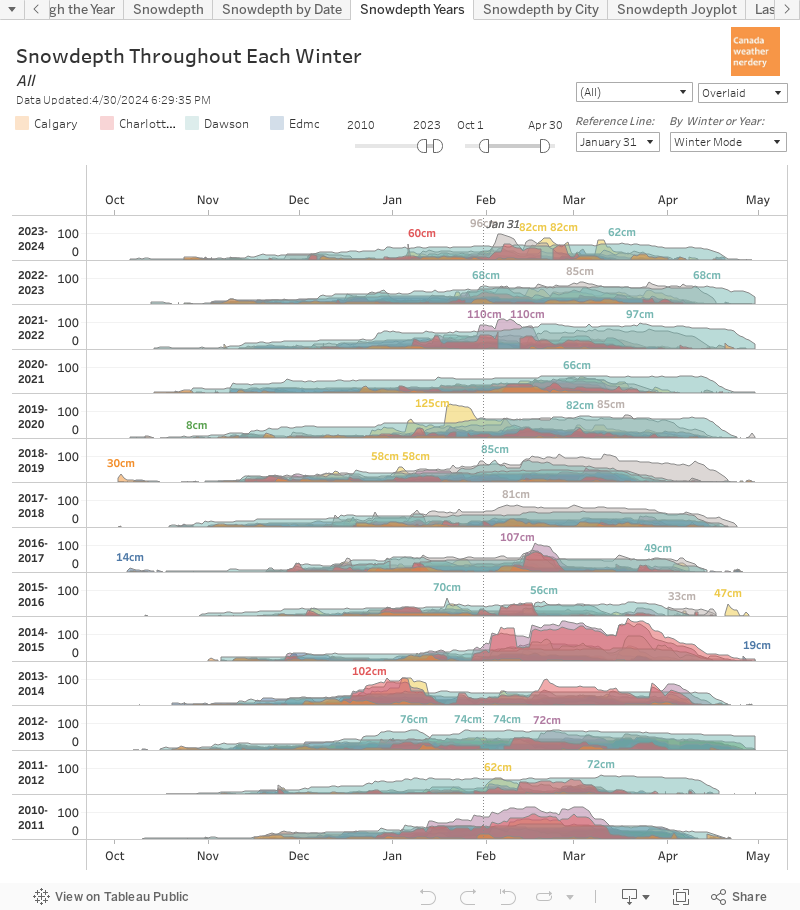

Snowdepth

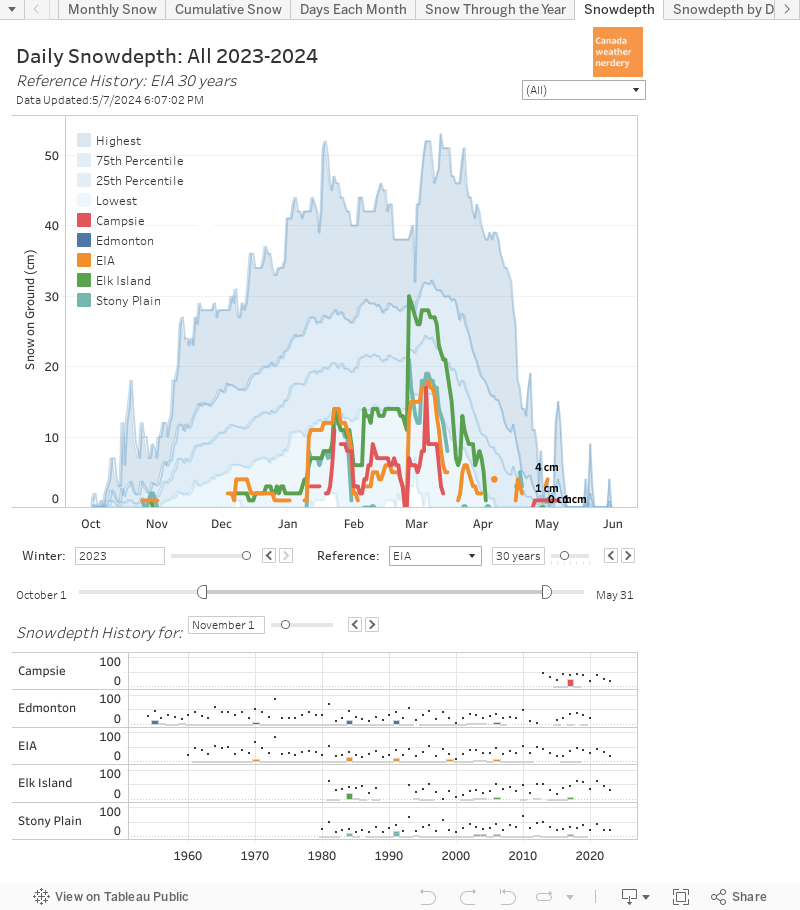
We had a few really warm days in December 2020, and the snowdepth at the International fell from 28cm down to around 17cm. Blatchford's numbers did not see as signifiant a drop, spending most of the month in the 15-17cm range. The average snowdepth for the end of December is about 14cm, so 2020 had been High for November-December, but the average has finally caught up with what is currently on the ground.


January Temperatures

In January on-average we get 12 days with Highs above freezing. Since 2000 there have been some low years like 2005 with only 5, but there are other years that have lots of "warm" days like 2001 with 25, 2012 with 17 and 2014 with 16. Recently 2020 had 13, 2019 had 14, and 2018 only had 10.

January is also our biggest month for deepfreezes, though. We average 8 Lows of -20°C or colder, and 3 of -25°C. The last time that January didn't have any Lows hit -20°C was back in 2006. And last year in 2020 we had a short but extremely cold deepfreeze, with January 15th dropping all the way down to -37.6°C. Since 2000 the only Januarys to cross the -35°C mark were 2020, 2008 and 2004.

2020/12/30

New Year's 2020

Ready to test your memory of New Year's temperatures?


New Year's Eve Temperature History

Edmonton's average temperatures for New Year's Eve are an average High of -7.6°C and a Low of -15.6°C. But looking at the history we are rarely on the average, with most years bouncing between really "warm" or really cold. 

2019 was very warm with a High of 6.1°C and Low of -6.6°C, 2018 actually was quite close to the average, and 2017 was very cold with a High of only -22.6°C and a Low way down at 28.2°C.

Here are the Highs going back to 2000:

Since 2000 we have had 4 New Year's Eves with Highs above freezing: 2012, 2014, 2015 & 2019 (shown in pink). Before that though you need to go back to 1997 to find another one.

This chart can be switched to show the Lows, and since 2000 we have had 6 New Year's Eves with Lows below -20°C, plus another 3 at -18°C. The coldest was also the most recent, in 2017 at -28.2°C.


New Year's Day Temperature History

New Year's Day's average are close to New Year's Eve's, with a High of -7.2°C and Low of -15.9°C.

2020 and 2019 were both on the warm side of things with Highs of 3.8°C and 2.9°C respectively. 2018's Low was way down at -27.6°C, but it's High of -7.9°C was close to average, and close to 2017's -8.8°C.

The last time that we had a New Year's Day with a really cold High was 2009 at -21.7°C, and 2010 was at -16.6°C.

Since 2010 we have had 5 New Year's Days with Highs above freezing: 2013, 2015, 2016, 2019 & 2020. Before that you need to go back to 2001 to find another one, and then to 1992.

This chart can also be switched to show the Lows, and since 2000 we have had 6 New Year's Days with Lows below -20°C: 2002, 2005, 2009, 2010, 2014 & 2018. The coldest was also the most recent, in 2018 at -27.6°C.

2020/12/24

Christmas Eve & Day 2020

Today we will take a quick look at the history of Edmonton's temperatures for Christmas Eve and Christmas Day.


December High Temperatures

In this chart each box shows the High temperature for a day in December, going back to 1990. It's highlighted to make the 24th and 25th stand out. Pink boxes had Highs above freezing while blue boxes were below. Is it surprising to see so many pink boxes?

Just since 2000 Dec 24th's High has been above freezing 7 other times: 2003-2005, 2007, 2011, 2013, 2014. And 2021 marks another one.

Since 2000 December 25th's High has been above freezing 9 times: 2001-2007, 2011, 2013.

So warm Christmases aren't unheard of, although we hadn't had one since (way) back in 2013.


December 24th History

Here is the full history of temperatures and precipitation for December 24th.

The record High of 9.9°C was recorded in 1999, and 2020 comes in as #2.

The record warmest Low of 2.3°C was in 1989, and 2020 ranked #9th at -2.3°C.

The coldest December 24th temperatures were both in the first year of records, with a High of -30.1°C and a Low of -41.7°C in 1880.


December 25th History

Edmonton's warmest Christmas Day was 1987 at 8.9°C.

For 2020 the High of 1.6°C ranked as Edmonton's 30th warmest, with the Low of -7.2°C as the 29th warmest.

From 1985-2000 there were actually a bunch of warm Christmases (which I have no particular memory) of: 1985 at 8.1°C, 1987 at 8.9°C, 1989 at 7.4°C, 1993 at 6.8°C, 1997 at 6.6°C, and 1999 at 8.3°C. Since 2000 Christmas Day has only broken the 5°C mark twice: 2005 at 6.3°C and 2011 at 6.7°C.

For recent cold Christmases 2008, 2012, 2015, 2016 & 2017 all had Lows below -20°C, with 2017 the coldest at -26.7°C. 2012 was close with a Low of -26.3°C, and a High of only -20.6°C.

The coldest Christmases on record were 1917 with a record High of -28.9°C and a Low of -32.2°C, and 1880 with a High of -24.4°C and a record Low of -39.8°C.

2020/11/30

November 2020 Review / December 2020 Preview

It's time for our look back at Edmonton weather for November 2020. It was a pretty quiet November, but sometimes that's okay. Let's take a closer look.


High Temperatures

This seems to come up a lot, but does anyone remember all the way back to the beginning of November? We started off with two warmest-in-30-years Highs, before dropping down to the cooler side of things for 2 weeks. It didn't get super-cold though, with the coldest High at -11.1°C on the 19th. TFor the final week things warmed up to around the average, and on the 30th the temperatures jumped way up, although still well below the top of the range.

For the month overall there were 17 days with Highs below average, and 13 above (including the 2 warmest-in-30-years days).
   
Looking at the numbers November 2020's average High of 0.6°C was right in the middle of recent years. It was cooler than 2019 & 2018, but warmer than 2017 down at -3.3°C.

We started November with a High of 17.5°C on November 1st, and in the last 30 years the only Novembers to record a High above 15°C were 2001, 2005, 2009, 2016 and now 2020.

Overall November had 13 days with Highs of 0°C or warmer, and that is actually fewer than the average for November which is 18 days.

The coldest High was -11.1°C on the 19th, and the last time that we had a November High hit -15°C or -20°C was in 2014.

Low Temperatures

The Low temperatures for November 2020 also started warm, had a few cool weeks, and then ended warm. 17 Lows were below average and 13 were above, including 1 warmest-in-30-years Low of 2.7°C on November 3rd.
    
The coldest Low was -18°C on November 20th, which means that we made it through November without hitting -20°C, and that is always nice. The average Low of -8.3 was right in the middle of recent years.

Warm & Cold Months

Here we have average High and Low temperatures for November going back to 1880. 2020 is right on the long-term average, with the average High of 0.6°C ranking as 71st warmest and the Low of -8.3°C as 73rd.

November is a bit of a strange month, in that its average temperatures have stayed very constant over the past century:

Here we have a comparison of the average temperatures for November and January.

November's average High has theoretically decreased by about 1°C from 1.3°C in the 1880s to 0.1°C today, although it has been hanging out right around 0°C since about 1930. And the average Low for November has increased about 1°C from -9.3°C to -8.1°C today.

On the other hand, for January the average Highs have increased by 8°C while the Lows have increased by 10°C, and most of that has been since 1970.

You can add in other months too as a comparison, although it gets a little messy. December is also pretty flat, with the Highs increasing by about 2°C and the Lows by 4°C. And February is our 2nd most changed month after January, with the Highs increasing by 4°C and the Lows by 7°C.
 
     
When we add up the Highs & the Lows, November 2020's average temperature was 0.1°C warmer than the 20th century average for November.

In this chart months that were warmer than average are big orange bubbles, and cold months are blue bubbles. And November 2020 was so close to the average that it barely shows up.

Across Canada

November 2020 was fairly middling in Edmonton, but across the rest of the country it was quite warm. The means temperatures for the central cities were 2.5-2.9°C warmer than their 20th century averages, amd even Calgary was 2.2°C warmer which seems unfair.

You can switch this chart to show the High temperatures, and the central Canadian cities were all about 3.8°C warmer than their November averages. In Toronto the Highs were the 3rd warmest on record for November, for Ottawa it was the 5th warmest, and for Montreal it was the 3rd warmest.

Snowfall

Our average snowfall for November is 20cm, and in 2020 the International recorded 31cm. That was the International's 9th snowiest November since records started in 1961, although in recent years 2013 hit 45cm and 2014 hit 37cm.
     
And looking across the country Edmonton's 31cm of snow in November beat St. John's at 23cm, Toronto at 21cm, Calgary at 18cm, Ottawa at 13cm, and Montreal at 12cm.

Snowdepth

November 2020 was a bit snowier-than-average and a bit less melty-than-average, and so our snowdepth was quite high at both Blatchford and the International. The average snow depth at the end of November is about 10cm, while Blatchford spent a lot of this month with 19cm of snow on the ground, and the International was between 25-29cm.
     
Here we have the history of snowdepth throughout the winter for Blatchford and the International, and it has been a long time since we have had a November with as much snow on the ground, and as little melting as 2020. Every winter is different, but in recent years 2013, 2006 & 1996 would have been comparable to 2020.
     
Across the country Edmonton is out to an early snowdepth lead for the winter of 2020-2021. 


December Temperatures

For December Temperatures on average we have about 10 days with Highs above 0°C. Some years have more than 15, like 2017, 2011, 2006-2002, etc. And then others have 7 days or less, like 2020, 2012, 2010-2007, etc.

For the Lows, since 1990 there have been 5 Decembers which didn't hit -20°C: 1993, 1997, 2002, 2001 and last year in 2019. And about half of the time December will hit -25°C, and about half of the time we will escape it. 


Here we have the chart for average monthly temperaturas again, and it's a little bit messy, but it compares the average temperatures for December compared to January.For most of Edmonton's history January was the month with the coldest average temperatures. As we saw earlier January has warmed up a lot over the past century, while December has stayed relatively flat. And so for the past ~5 years January's average Highs and Lows have actually been warmer than December's, leaving December with the title of Edmonton's coldest month.

2020/11/01

October 2020 Review / November 2020 Preview

 We have lots to talk about for October 2020.

High Temperatures

October 2020 started-off pretty warm, but then it was cold-cold-cold, before warming back up to around average at the end of the month. We were well below average from the 16th through 25th, and that included 4 coldest-in-30-years Highs, but for that whole week-and-a-half we were right at the bottom of our typical temperature range. Overall the month ended up with 11 Highs above average and 20 below average.

Looking at the numbers, October started out with two Highs which hit 20°C. On average October gets about 2 of those each year, although October 2019 didn't have any. Then after the first week things rapidly cooled off, and we recorded 7 Highs that hit 0°C, including 3 that hit -5°C.

Highs of 0°C are pretty rare in October - we didn't have any in 2014-2017. And Highs of -5°C are very rare, with only 6 recorded since 2000, and 3 of those were this month. So that week-and-a-half coldsnap had some days which were very cold for October.

October 2020's average High of 6.9°C is on the cold side of recent years, but overall it was warmer than 2016 at 5.7°C or 2012 at 5.8°C.


2020 Warm Days

Unfortunately it's probably safe to assume that we have seen our final 20°C day of the year: the last time that we hit 20°C in November was 1949, although 2016 got really close hitting 19°C, 19.5°C and 19.9°C. 

2020 ended up with 100 Highs at 20°C. That's up from the 82 which we had in 2019, and is a little bit above the longterm average.


Low Temperatures


As usual the Low temperatures look similar to the Highs, with a warm start, really cold middle, and then warm~ish end. October 2020 had 15 Lows below average, which included 5 coldest-in-30-years Lows. But there were also 16 above average Lows, including 2 warmest-in-30-years Lows early in the month.
 

October 2020's average Low of -1.3°C was cool, but 2019 was cooler at -1.7°C, 2012 was -2.1°C, and 2002 was down at -2.7°C So it could have been worse.

We had 15 Lows below freezing, including 2 which hit -10°C, which is pretty unusual in October. Since 2000 the only Octobers to hit -10°C were 2002-2004, 2012, 2019 and now 2020 (although 2003 & 2003 both got all the way down to -16°C).


Frost-Free Days

Blatchford didn't record any frosts in September, and so our first frost of the year was October 9th. That's about 2 weeks later than average, and the final frost of spring on April 19th was also about 2 weeks early. So 2020 had 173 frost-free days, which is about a month more than average.

Dates of frosts vary wildly across the region, and so if you are interested in some of the other stations that data is here


Warm & Cold Months


October 2020 was definitely colder than average: the average High of 6.8°C ranks as #130 warmest out of 140, and the average Low of -1.3°C was #98 (to see that switch the chart to "Lows"). But it was still warmer than several recent Octobers: 2002, 2006, 2012 & 2016 were all in the bottom-10 for October Highs.

Over the years October's average High has stayed fairly constant around 10°C, or maybe even decreased a bit from 10.6°C. On the other hand the average Low has increased from around -9°C a century ago to -7.7°C today.


Sticking with the Highs, the cool October 2020 appears here as a fairly large blue bubble. But the row for October has several other fairly large blue bubble, because we have had a number of cool Octobers.


Across the Country


Looking across the county, October 2020 was pretty cold for the prairie cities, while in central Canada it was average~ish, and in St. John's it was a little warm.


How Warm is 2020 so far?


With two months left in 2020 it's time to check-in to see how the year's temperatures compare overall.

This isn't my favourite chart, but the red lines show how much warmer/colder the year has been compared to the 20th century average. Each time that the red line goes up that means the day was warmer-than-average day, and each dip was colder-than-average. It's broken into mean/high/low because our Lows are usually warmer than the longterm average, while our Highs are more variable.

For 2020 so far our cumulative average Highs are actually -0.05°C colder than the 20th century average, following the dip for the October coldsnap. The Lows have been 1.1°C warmer though, and so for the year as a whole we are at 0.53°C above the 20th century average, or the 49th warmest year since 1880.


Here we can see how 2020's overall temperature compares to recent years - the is the mean temperature, so it is the combination of the Highs & Lows. And right now 2020 is right in the range for a typical post-1980 year, although that could change drastically if November or December are much warmer or colder than average.


First Snow


The International Aiport recorded its first snow on October 16th. Looking back over the years that's a fairly typical date for the first snow, but it's much later than the really early September snowfalls that we had in 2014, 2016, 2017 & 2018.


Overall October 2020 recorded 4.9cm of snow, which is about half of October's average of 9.5cm.


A bit further south Calgary had another really snowy October with 27.9cm. That follows 15.8cm in 2019 and a record 48.4cm in 2018. Their October average is 12.1cm


Total Precipitation


For overall precipitation (snow + rain) October 2020 recorded 11.2mm at Blatchford and 12.5mm at the airport. Those were both low compared to the October average of 21mm.


October 2020 recorded 9 days with precipitation, which is right on the average. (I would have guessed that it was a gloomy month, but I probably think that of most Octobers)


2020's overall precipitation is still well above average thanks to the rainy summer, with Blatchford at 473mm and the International at 471mm. The average at the end of October is 407mm.


November Temperatures

We probably don't want to talk about November temperatures, do we?

On the plus side, November frequently still has a lot of Highs above freezing. Recently 2006 was down at only 7 and 2017 had 9, but plenty of years were up around 20 including 2018 & 2019.

On the less-plus side about half of the time November is when we'll see our first -20°C Low of the winter. November 2017 was pretty cold, but we haven't had a true November deepfreeze since 2014.