Today is our big review of the weather for June 2020.
How did it "feel" to everyone? Warm or Cold? Rainy or not? Let's take a look.
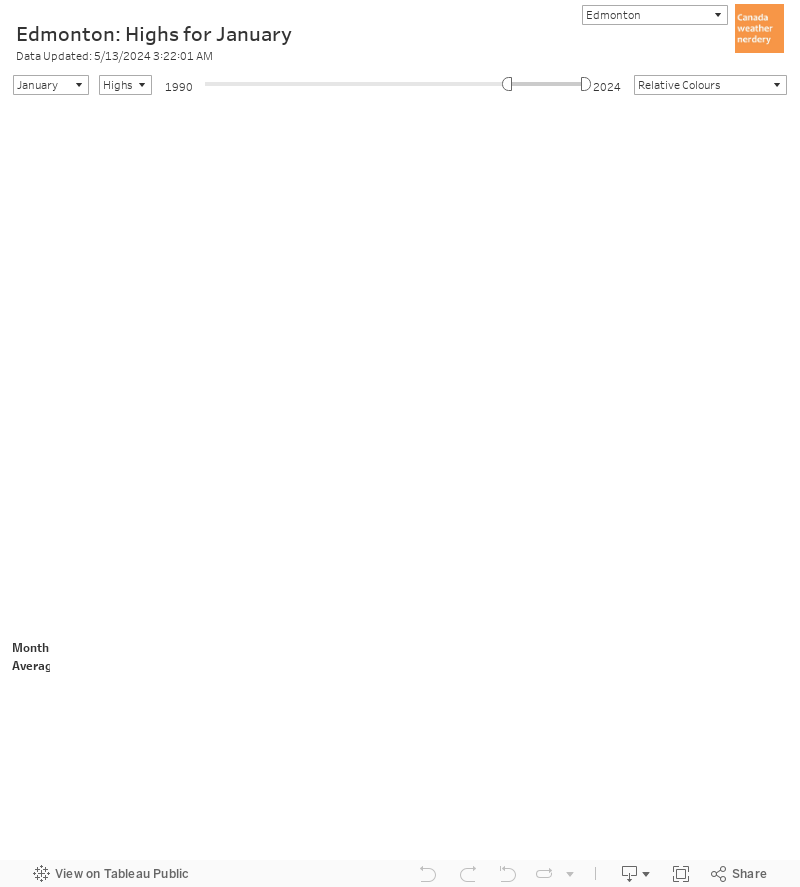
High Temperatures
June's High temperatures were fairly average, with 14 days above the 30-year average and 16 below it. On June 12th we hit a 30-year-warmest High at 27.9°C, although the record is up at 31.1°C from 1912. And then a week later on June 17th we hit a 30-year-coldest High at 13.6°C, and the coldest record there was 10°C from 1902. June 30th's High of 17°C came close to a 30-year-coldest High, but 16.9°C is the actual number.
The little bargraph at the bottom of this chart shows how the temperatures for June of each year compared to the 30-year average. For 2020 the Highs were just a bit colder than the 30-year average, and were a bit warmer than 2019. June 2015-2018 were all much warmer than the average, and before that June 2013 & 2014 were both relatively cold.
Looking at the numbers, June 2020's average High of 20.6°C was just a bit warmer than 2019's 20.3°C, and ranked as 12th warmest (or 8th coldest) since 2000.
We only had 3 days hit 25°C, compared to an average of 5 days for June. And we had 16 days hit 20°C, which was just a bit below the average of 17 days. We also had 2 days with Highs below 15°C, and that is right on the average for June.
Hot Days
For the year so far we have had 4 days hit 25°C, which is below the 6 that we had in 2019. But before that 2015-2018 all had a lot of hot days, and were up at 14-25 days by this point in the year.
The longterm average is around 7~10 days at 25°C by the end of June, so 2020 was a little low. We also have not had any days break 30°C or even 28°C yet this year.
For 20°C days we have recorded 29 so far. That matches 2019, and is pretty much average.
Low Temperatures
June's Low temperatures looked similar to the Highs, with 14 days above the 30-year average and 16 below. June 18th came close to a 30-year-coldest Low at 6.1°C, but everything else was comfortably within the typical range.
June's average Low of 10.4°C ranked as 10th warmest since 2000.
We had 2 Lows above 15°C, which is about average. And we had no Lows below 5°C, compared ot last year in 2019 when we had 4.
Warm & Cold Months
Here we have the average High temperatures for June going back to 1881. The average High has not changed much over the years, staying close to 21°C. 2020's average High of 20.6°C was below that average, although it was still above 2019, 2014, 2013 & 2011. It ranked 75th overall.
Here we have the average Lows for June, which have increased from about 7°C a century ago to 10°C today. 2020's average Low of 10.4 ranked as 22nd warmest overall.
Here we have combined the Highs & Lows, and each bubble represents the mean temperature for a month. Orange bubbles were warmer than the 20th century average, and blue bubbles were colder.
With June 2020's below-average Highs and above-average Lows the temperature overall was 0.8°C above the 20th century average, and so it appears as a small orange bubble. 2016-2018 were all warmer and appear as larger bubbles. And there are blue bubbles for cool Junes like 2000 & 2001.
June 2020's orange bubble follows an orange bubble for May, blue bubbles for April & March, and orange bubbles for February and January.
Across the Country
Across the country all of the cities which we look at had June temperatures warmer than their 20th century average. St. John's was 2.8°C warmer than its average; Toronto, Montréal & Winnipeg were all about 1.7°C warmer than their averages; and Regina & Vancouver were just 0.3°C above their averages.
The Year So Far...
This chart is really busy, but the red lines show how the daily temperatures for the year so far compare to the 20th century average.
If you add up each of the daily temperatures for January through June then so far 2020 has been 0.48°C warmer than the 20th century average, or Edmonton's 56th warmest year.
But most of that warming comes from the Lows, shown in the chart on the bottom in blue. The Lows have been 0.83°C above the 20th century average, while the Highs in orange have only been up by 0.12°C. That's similar to 2019, but very different from a really warm year like 2016 or 2017.
You can also use this chart to look at other cities, and for some examples Montréal is having a top-10 year, Winnipeg is top-30, and Calgary is pretty similar to Edmonton.
For one final look at how things have gone recently, here we are looking at the temperatures for the past 12 months, back to July 2019. In this chart each of the spokes on the big circle at the top represents how warm or cold the year was, and July 2019-June 2020 was 0.5°C warmer than the 20th century average. That put it in the 54th spot.
The circle in the middle of the bottom row shows how each day of the year compared to the 20th century average. There are large blue spikes for a few very cold weeks in January & April, and orange for our relatively ("relatively") warm November, late-December & late-January.
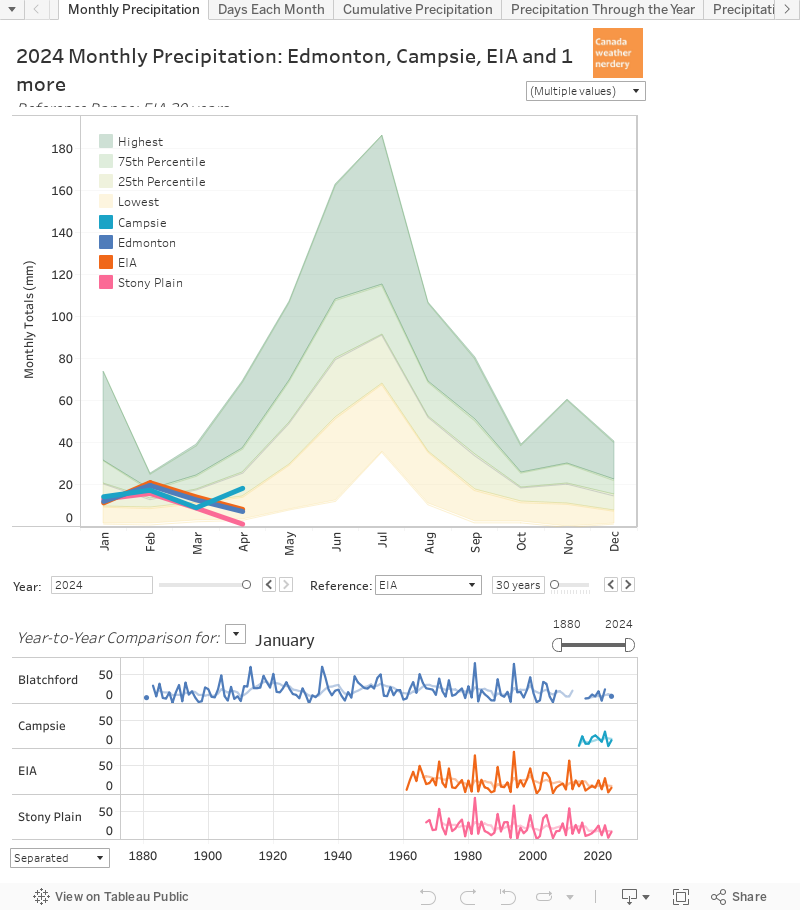
Monthly Precipitation
Was June 2020 rainy? Yes it was, but June is usually pretty rainy. It averages 75mm of precipitation, which makes it our 2nd rainiest month after July. In 2020 both stations above that with Blatchford at 106mm and the International at 117mm. That was Blatchford's 33rd rainiest June since 1881, and the International's 11th rainiest since 1961.
Last year June 2019 was also above average, with Blatchford at 117mm and the International a little lower at 86mm.
Here is a look at a few of the other cities around the country.
Calgary was up at 172mm, which made 2020 Calgary's 9th rainiest June, and quite a bit above the 134mm which they recorded in 2019. And while we like to think of Vancouver as rainy, it actually usually gets less rain than Edmonton or Calgary in June & July. It recorded 52.6mm which is close to its average. Montréal recorded 46.4mm, which is quite low compared to its June average of around 90mm
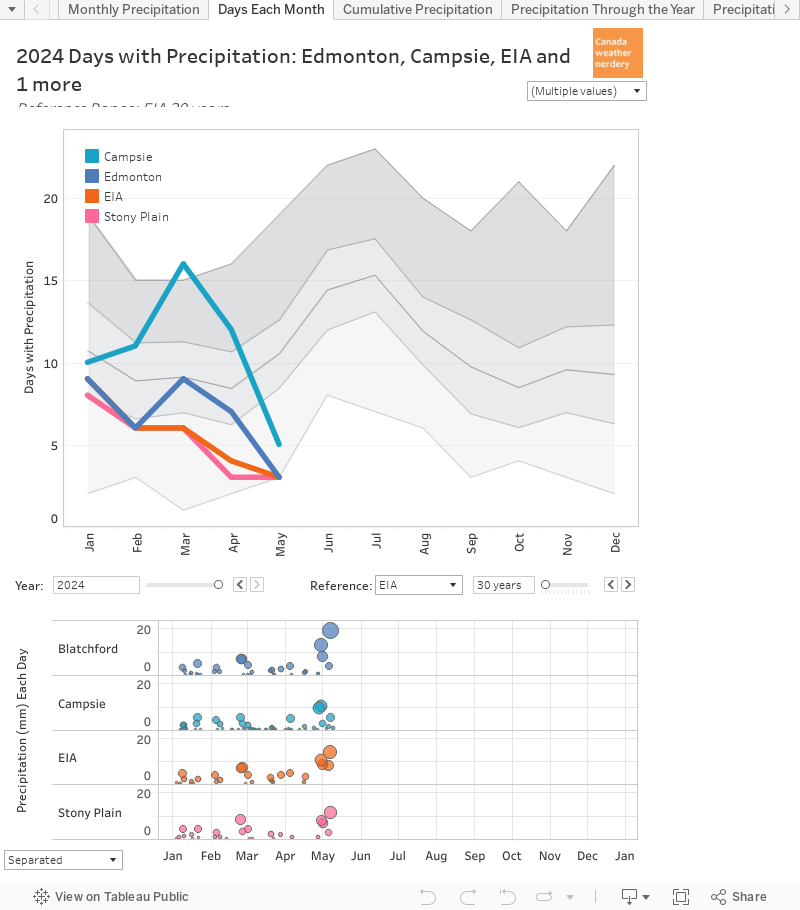
Rainy Days Each Month
In June we average about 14 days with rain. This year we recorded a bit more rain than average, and the International also recorded more rainy days than average with 18. Blatchford was actually just below average with 13 days with rain.
The Rainiest Days
This chart shows the rainy days for Blatchford, and each bubble is a day with 20mm of precipitation or more. June 2020 had 3 of those (the bubbles furthest to the right) with 27mm on June 7th, 24mm on June 14th, and 24mm on June 30th.
If you switch this chart over to the International Airport, it also had 3 big days: 24mm on June 7th, 29mm on June 14th, and 33mm on June 30th.
Precipitation So Far...
Our total precipitation for the year so far is 253.3mm at Blatchford and 287.4mm at the International. Both of those are above the average of 207mm, and are also above the 74th percentile.
Looking at a few other cities around the country, so far in 2020 Calgary has had about 100mm more precipitation than Edmonton, with 357mm. Montréal's total is 470mm, while Vancouver is at 520mm.
This chart only shows those 4 season to keep it clean, but it includes data for 9 cities in total. At the extremes St. John's is all the way up at 663mm, while Winnipeg is down at 132mm and Regina is at 76mm. (I don't really know how accurate those last two are).
July Temperatures
So we have had another cool~ish start to summer in May & June this year, which was similar to 2019, and way down from warm years like 2016-2018. What could July hold? On average July has about 25 days which hit 20°C, including about 10 at 25°C. And 30°C doesn't happen every year, but only 6 of the past 20 July's didn't have any (that included 2019).
July is also usually our rainest month, with an average of 90mm, which is less that what we just got in June.