Showing posts with label How Warm Is.... Show all posts

2026/10/02

September 2026 Review

It's time for our big look back at September 2026, which was another pretty quiet month.

September 2026 was our coldest September since 2020. But historically that still puts it well above average. 

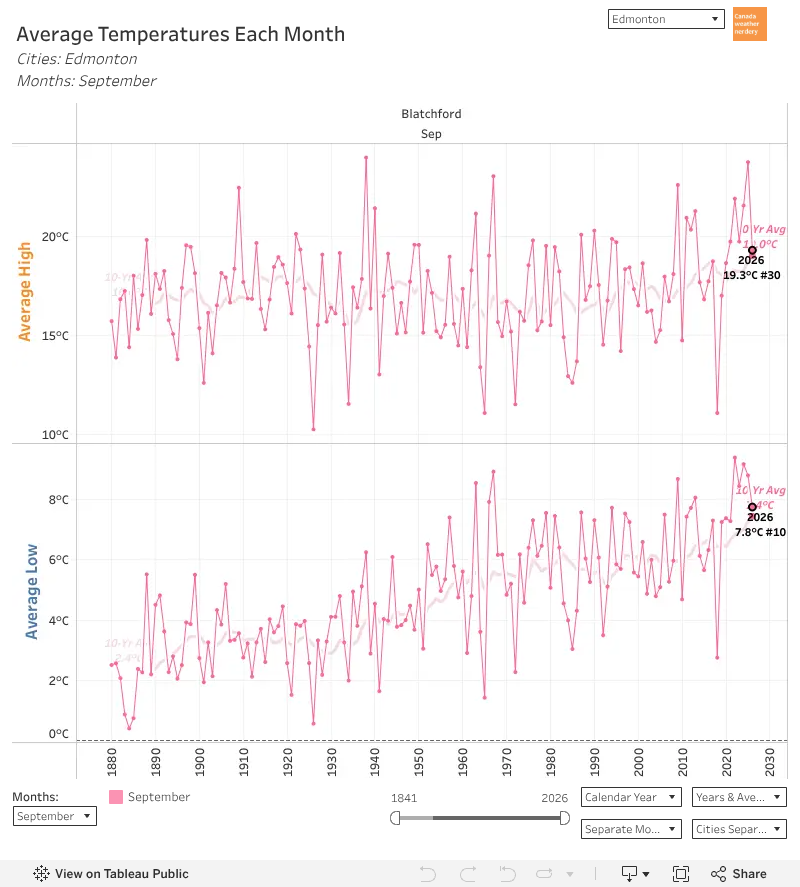
The average High of 19.3°C was the 30th warmest. 

The average Low of 12°C was 10th warmest. (compared to 100 years ago September's average Lows have increased by 5°C)


High Temperatures
September's Highs basically bounced around the average all month, with a few extra warm days around the 21st. The coldest High was 11.1°C on the 26th, and the warmest was 28°C on the 21st. 

Overall 16 Highs were above-average, and 14 were below.

September averages 12 20°C Highs, and 2026 got 12. 

4 of those might get to 25°C, while 2026 got 6 of them.

2022 & 2024 both had several 30°C Highs, but 2026's warmest was 28°C. 

And September averages 2 Highs below 10°C, but 2026 had none.


Warm Days So Far
We might still see some warm days in October. 

But right now 2026 has had 103 Highs reach 20°C, which is typical nowadays, but the historic average was closer to 90. 

And 38 of those got to 25°C, which is just a bit above average.


Low Temperatures
September 2026's Lows were mostly above average: 19 were above, with 11 below. 

The warmest was 14.6°C on the 2nd. The coldest was 1.4°C on the 15th. So it was another frost-free September for Blatchford.

Blatchford hasn't had a September frost since 2019. Although they used to happen every few years.


First-Frost
Blatchford's average first frost is September 30th, and Stony Plain's is September 25th. But so far they're both frost-free.

The airport & Campsie got their first frosts on the 15th & 13th, which is a little later than their averages of the 10th & 6th.


Warm & Cold Months
September 2026 gets medium orange/warms dots. 

The average High of 19.3°C was 2.4°C warmer than the 20th century average. The average Low of 7.8°C was 3.1°C warmer than the 20th century average.


The Horserace
With 3 months left in the year (and the promise of a super El Niño on the way) 2026's temperatures currently sit as Edmonton's 23rd warmest on record, at 1.48°C warmer than the 20th Century average. 

Recently 2025 & 2024 ended the year as 7th & 10th, while 2023 was 1st.


Across Canada
Across Canada September was cool in the east, and above-average everywhere else. Saskatoon's Highs were 2.8°C warmer than their 20th century average, while Moncton's were 0.8°C below theirs.


Precipitation
In September Edmonton averages 32mm of Precipitation. After the ridiculously rainy summer, September was below average. 

In 2026 Blatchford got 14.4mm, the airport got 21mm, and Stony Plain got 21.7mm.


2026 So Far
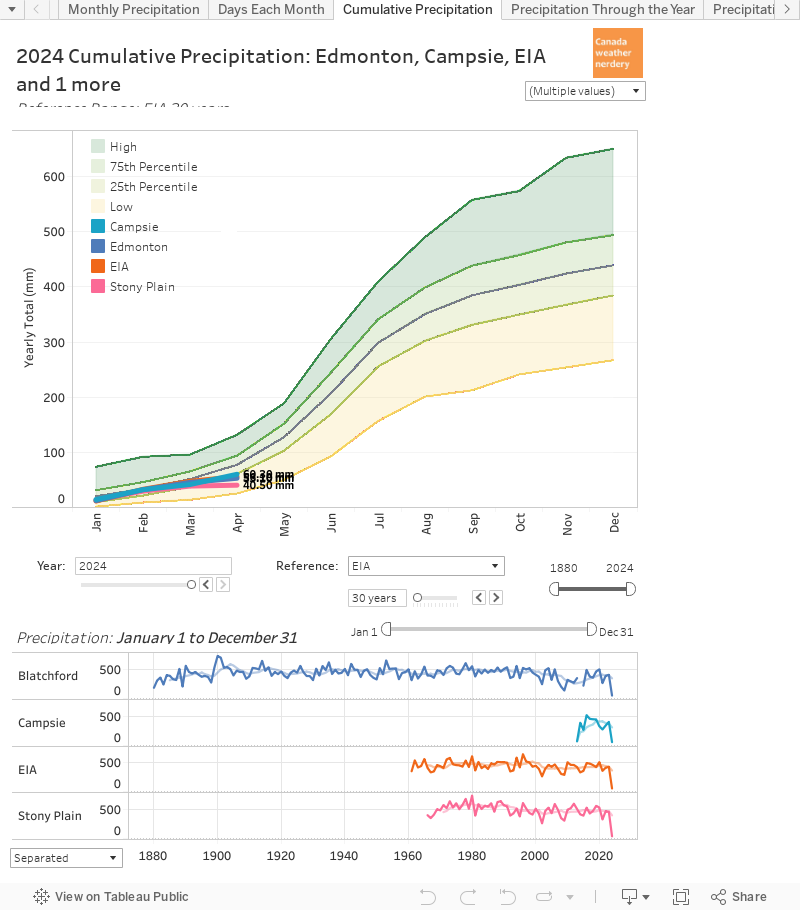
By the end of September we average around 382mm of precipitation for the year, but in 2026 the local stations are still well above average. Blatchford is up at 716.8mm, Stony Plain has 571mm, and the airport has 496mm.

716.8mm is Blatchford's 2nd rainiest year on record. It's just 8mm behind 1900's record of 724.8mm. In October we average 18mm, and before the end of the year we average 54mm.


Precipitation Across Canada
Edmonton's 717mm has it well ahead of the other prairie cities, which are all between 350-400mm. But central & eastern Canada are mostly from 800-1000mm, with Halifax close to 1100mm.

For big September storms Halifax led the way with 72.6mm on the 4th. That first week saw 40mm+ storms in Toronto, Halifax, Charlottetown (x2), St. John's, Regina & Saskatoon. Compared to that the rest of the month was pretty quiet.


October
For October, we average about 1~2 Highs of 20°C, but half of the time there are none. 

October also averages 2 Highs below 0°C, and 14 freezing Lows. 

And...we average 7cm of snow in October. Although 2021, 2022, 2024 & 2025 had none.

2026/01/01

2025 Year-In-Review: Part 1 - Temperatures

And now, what you've all been waiting for! It's time for our big look back at 2025 with our Year-in-Review Part 1 - Temperatures.


Warmest & Coldest Years
The big news: 2025 is Edmonton's 7 warmest year on record at 2.2°C above the 20th century average. 

That's a bit above 10th place 2024, but below 1st place 2023.

Warm months were Jan (#13), May (#6), Aug (#5) & Sep (warmest on record). Feb & Dec were below average.

At the end of November 2025 was 5th warmest, but the cold December pushed it down to 7.

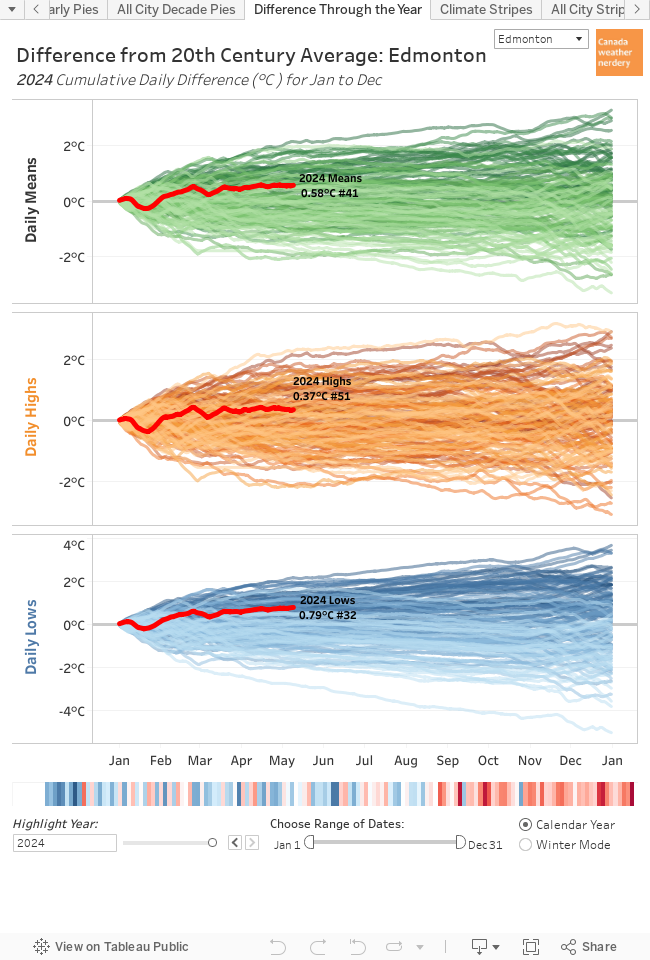
The average High was also our 7th warmest, while the average Low was 14th warmest. But together that makes 2025 #7.

You can see where the red line dips for February & December.

I only get to use this chart once a year, and here each month of the year gets a pie piece.

In 2025 February & December were colder than the 20th century average, so they get the blue trivial pursuit pieces. The other months get various shades of orange.

For the climate stripes scarf chart 2025's 2.2°C is another red one, although obviously not as red as the record-breaking 2023.

The last time that we had a blue stripe was back in 1996, at -1.7°C colder than the 20th century average.

For the local outlying stations 2025's temperatures ranked #8 for the airport, #13 for Stony Plain, and Campsie was just #26.


Temperatures Across Canada
Across the country 2025 was Kelowna's #1 warmest on record.

Dawson City, Edmonton, Calgary & St. John's were top-10.

The other cities mostly fell in the range of top 15-35. But Quebec City was lowest with 2025 as its 56th warmest year.

Here are the climate stripes for the country's big cities. 

Back in 2022 we had a few whites and one blue (Winnipeg), but 2023, 2024 & 2025 have been all pink or red. Quebec City is the least pink of the bunch.

Kelowna's previous hottest year had been 1958, at 2.3°C warmer than their 20th century average. 2024's 2.2°C came close to catching it. But 2025 succeeded, at 2.6°C warmer.

Aug & Sep were their warmest on record, and 6 other months were top-10.


Warm & Cold Months
Across the country February & December were below-average for most of the country.

All of the other month were pretty unanimously above average, with a few little blips of blue, like July in Saskatchewan, and November in Ontario.


High Temperatures
For 2025 Edmonton had 230 days with Highs above our 30-year average. That included 8 warmest-records in February, May, 4 in August, and 2 in September.

2025 had 115 Highs reach 20°C. That's the 6th most on record. Recently 2022 had 119 and 2023 had 121. 1897 & 1898 share the record with 122.

2025 had 56 Highs reach 25°C, which is the 5th most on record, and the most since 1961. 1898 has the record with 64.

2025 had 14 Highs reach 30°C. That ties 1961 for 3rd most on record. The only years with more are 2024's 16 and 2021's 17.

We got a late heatwave at the end of August, which wasn't as exciting as some of the big peak-of-summer heatwaves that we've seen recently. But for as late in the year as it was, it set a bunch of new records. We talked about it more here: https://edmontonweathernerdery.blogspot.com/2025/02/the-great-deepfreezeish-of-february-2025.html


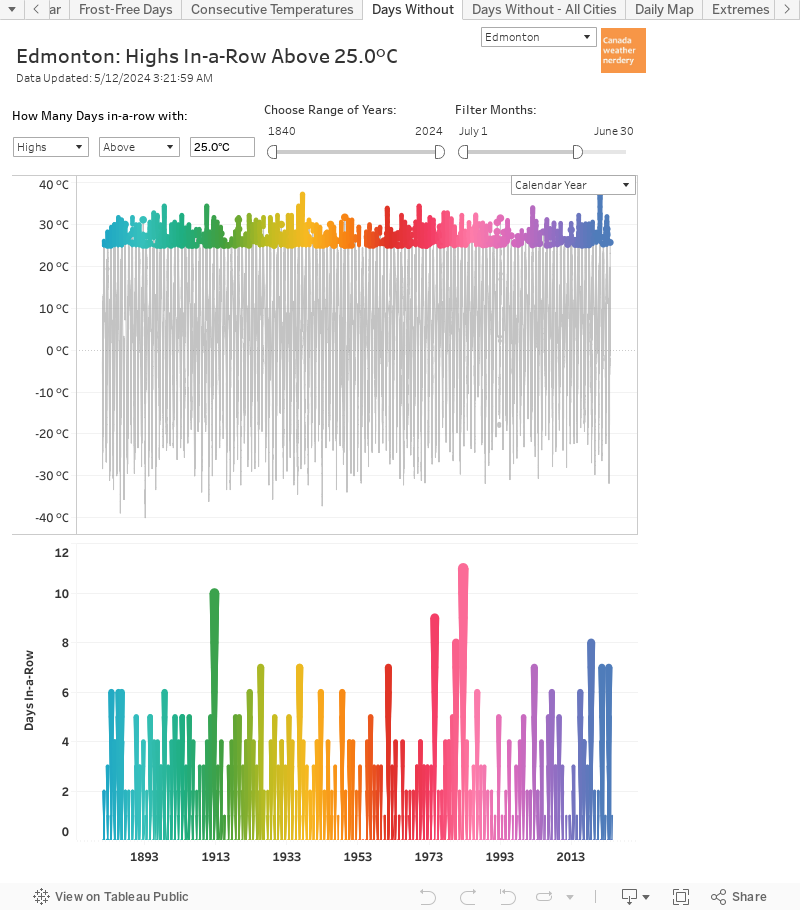
The August heatwave had: 6 30°C Highs in-a-row, which doubled the record for that late in the year, and missed the overall record by 1. 

4 32°C Highs in-a-row which tied the overall record. Set 4 new daily record Highs in-a-row.

For 30°C days across the country Edmonton & Kelowna, Montréal & Moncton were top-10.

And even though Edmonton got a lot, Calgary & Saskatoon were both well below average.


Low Temperatures
For 2025 there were 214 days with above-average Lows, including 6 new warmest-records in January, Feburary & August. 

The 151 below-average Lows were spread around, but included lengthy February & December deepfreezes, and a few cool weeks in July.

2025 ended up with 31 Lows of -20°C, when our average is around 25. Most of those came from February (13) and December (13).

19 of those got to -25°C, which tied 2019. Our average is around a dozen.

2025 only had 1 Low reach -30°C, when we average around 4. The only -30°C was -30.3°C on February 18th. For as cold as December felt, it "only" got down to -29.5°C.

2025 had two deepfreezes, in February & December. They were both long, but they weren't as long, or as cold as some of the more epic deepfreezes we got from 2018~2024.

We looked at them in more detail here:


For -20°C Lows across the country 2025 was pretty typical for the big winter cities.


Warm Winter Days
In the deep-winter months of January, February & December we average around 35 above-freezing Highs (about 40% of the winter). 

2025 had long coldsnaps in February & December, and ended up with 34 of them.

That included 16 5°C Highs, which is right on average.


Yearly Extremes
With a warmest High of 33.3°C and a coldest Low of -30.3°C Edmonton's temperature range in 2025 was 63.6°C. That's pretty typical for modern years. 

2024, 2021 & 2020 were all around 70°C because they got hotter heatwaves and colder deepfreezes.


Records
2025 set 8 new record Highs. That's down from 2024's 11, but it ties 1934 for the 4th most record Highs.

And it set 6 new record warmest-Lows. That's pretty average, and down from 2021-2024 which all set 10 or more.


Frost-Free Days
2025's final spring frost was pretty late on May 5th, while the first fall frost was just a bit late on October 4th.

So 2025 ends up with 140 frost-free days, which is a bit below the average of 146.

2024 had 174, 2023 was up at 182, and 1980 has the record at 184.

This chart is very cramped, but it gives a sense of how the growing season varies across the country.

In 2025 most cities were pretty average, but the prairie cities (except Edmonton) were all around 2 weeks longer than average.


Edmonton versus Calgary
And finally, a quick comparison of Edmonton & Calgary. The temperatures usually track fairly closely, although Calgary is warmer.

But something happened in December. It was a really cold month in Edmonton and across the prairies, but Calgary lucked out with just a bit below average.

That's the end of Part 1 of our 2025 Year-in-Review. Part 2 will look at precipitation, and part 3 will be all about snow.

2025/06/30

June 2025 Review

It's time for our big look back at June 2025 weather in Edmonton. It was a pretty unremarkable month, although sometimes that's not a bad thing...

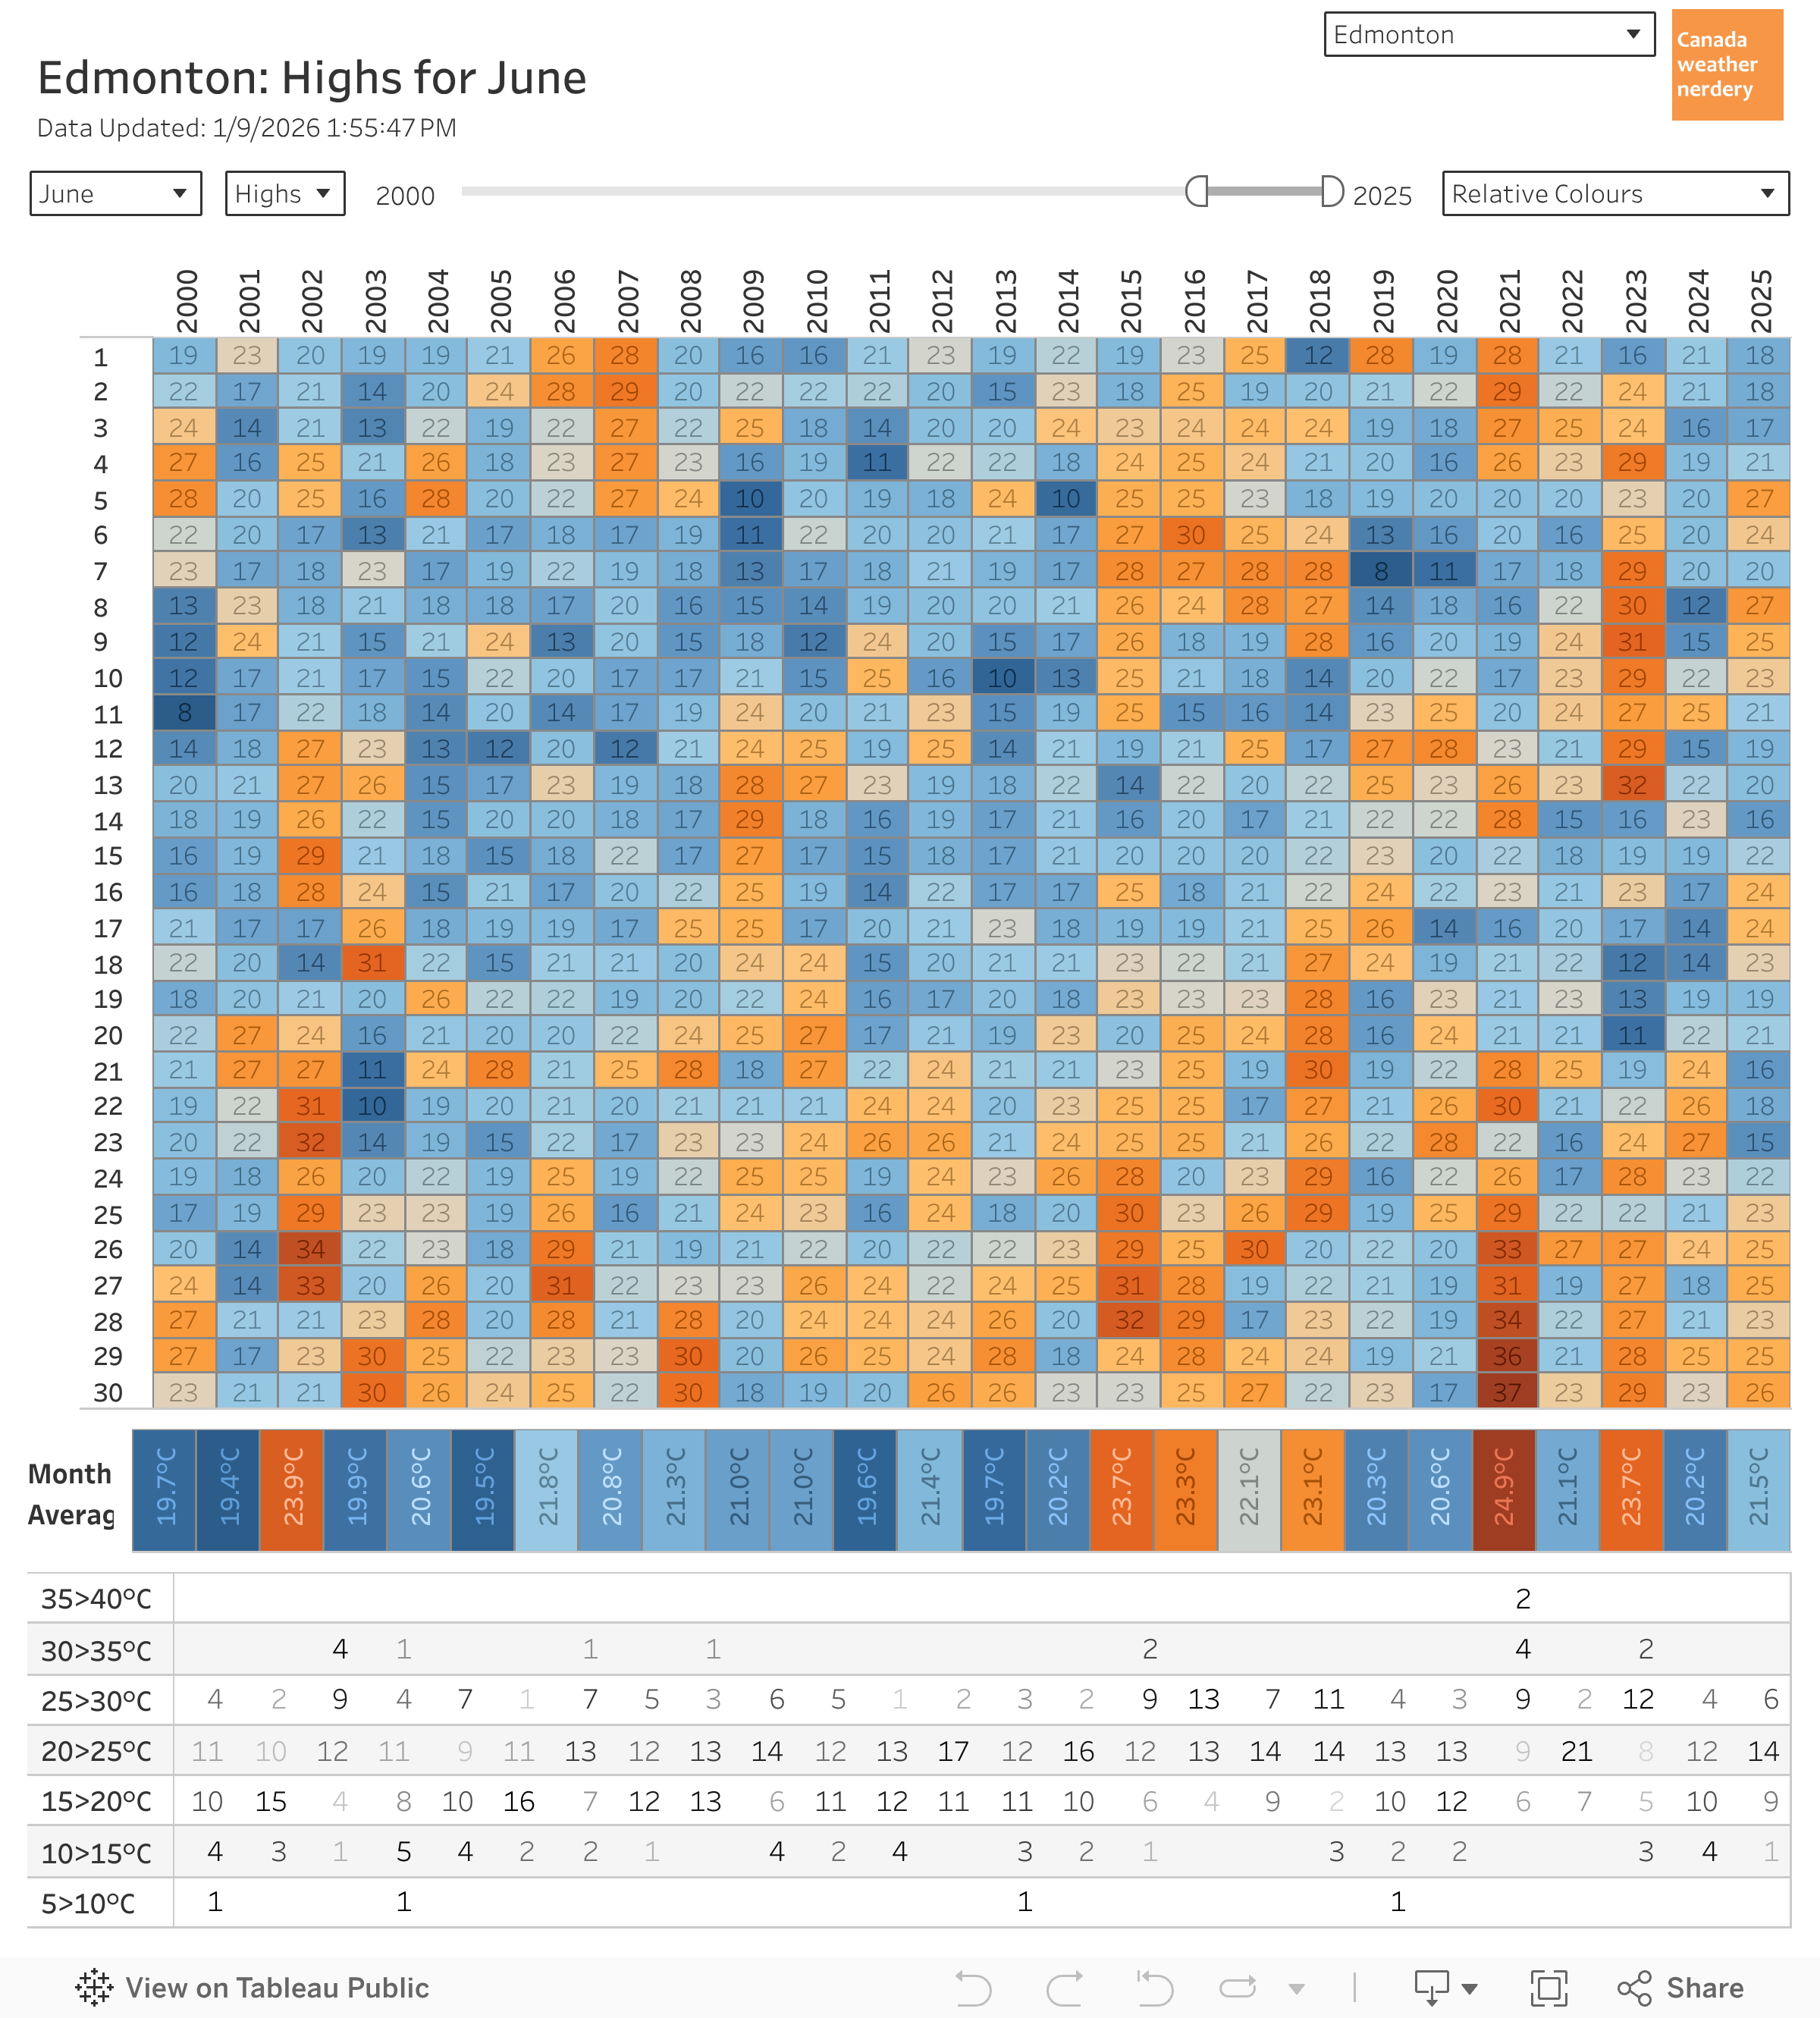
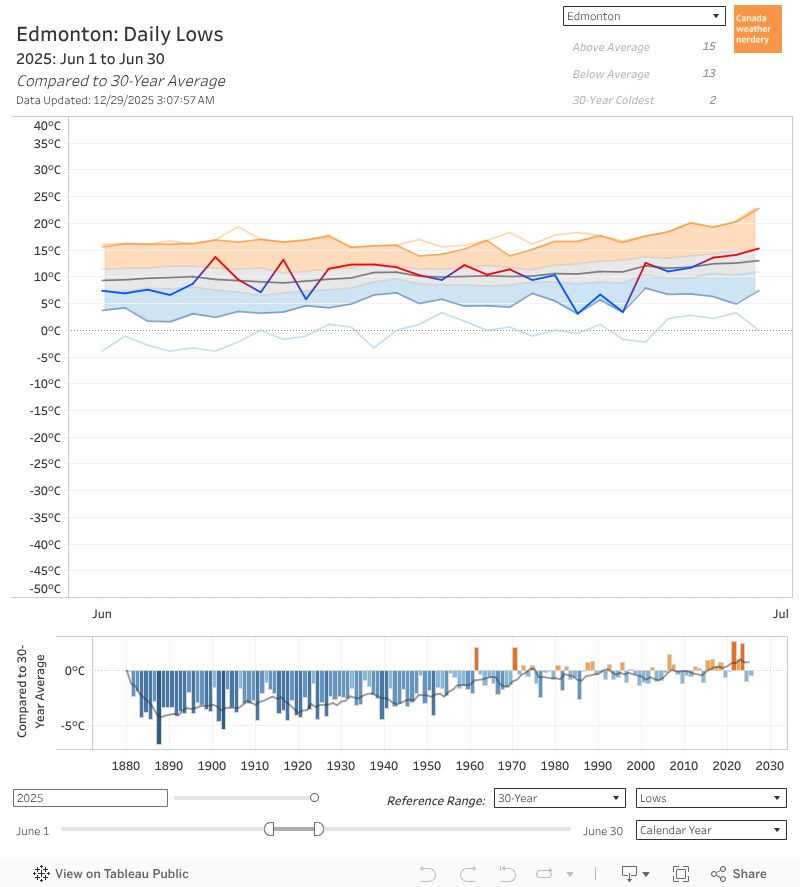
June 2025's average High of 21.6°C was our 46th warmest June on record, and the average Low of 10°C was our 36th warmest. Those are both below the recent averages of 22.2°C and 11.1°C.


High Temperatures
June 2025 had 18 above-average Highs and 12 below-average. But they were all comfortably within our typical range, and nothing was particularly hot or cold.

June 2025 didn't get to 30°C, but the only recent Junes to get there were 2023 & 2021, and before that 2015.

June averages 5 25°C Highs, and 2025 had 6. It averages 18 20°C Highs, and 2025 got to 20.

And it averages 2 Highs below 15°C, and 2025 had 1, with 14.5°C on the 23rd.


Hot Days
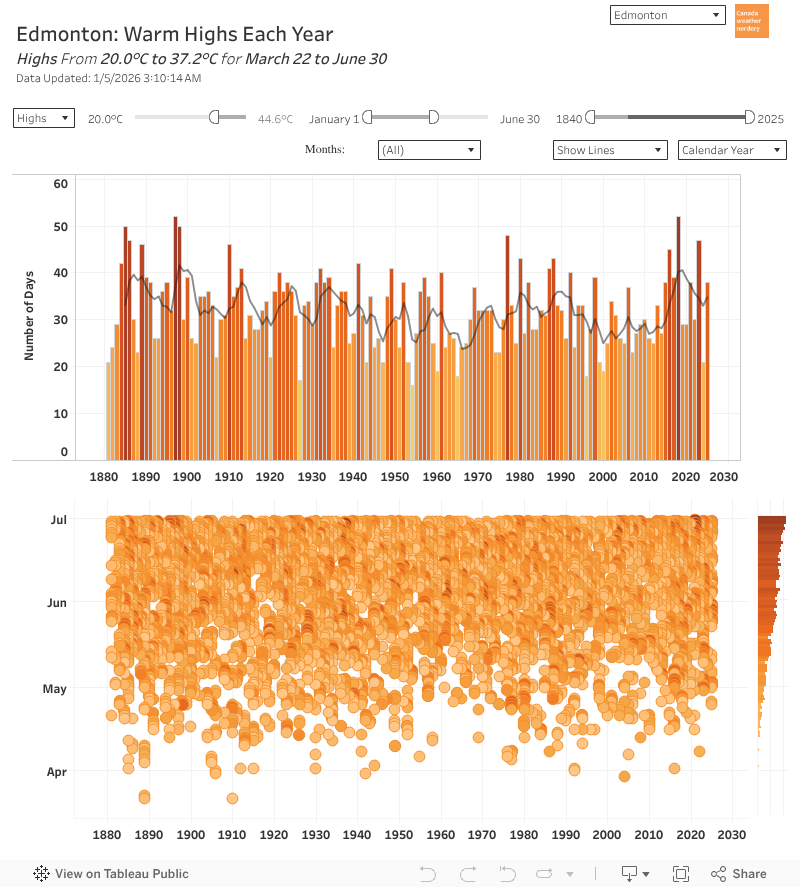
By the end of June we average 35 20°C Highs, and 2025 is just a bit above that with 38.

Our recent average for 25°C Highs is around 11 (although the range is from 2 in 2022 to 26 in 2023), and 2025 has 13 so far.


Low Temperatures
June 2025 had 15 above-average Lows, and 15 below-average. None of the warm Lows were particularly warm, but June 22nd's 3.1°C and June 24th's 3.4°C were the coldest in 30 years.

On average June gets 1 Low below 5°C, and 2025 had 2. June also averages 2 Lows above 15°C, and 2025 had 1, with June 30th's 15.3°C.


Warm & Cold Months
June 2025 was cooler than recent years, but still warmer than the 20th century average, so it gets a small orange bubble here.

The average High of 21.5°C was 0.8°C warmer than the 20th century average, and the Low of 10°C was 1.3°C warmer.


Across Canada
Across the country the Highs for March through June have all been warmer than the 20th century average for all of these Stations. 

For June St. John's was the most above-average, at 4.9°C above their average, followed by Kelowna at 2.7°C above theirs.


The Horserace
6 months into 2025, and so far it's a pretty warm year.

Overall it's Edmonton's 16th warmest year on record, at 1.3°C warmer than the 20th century average. The Highs are 21st warmest, and Lowest are 17th warmest.

Across the country January-June 2025 is Dawson City's 6th warmest and St. John's 7th warmest. Quebec City is at the bottom, with 2025 as its 68th warmest January-June.


Precipitation
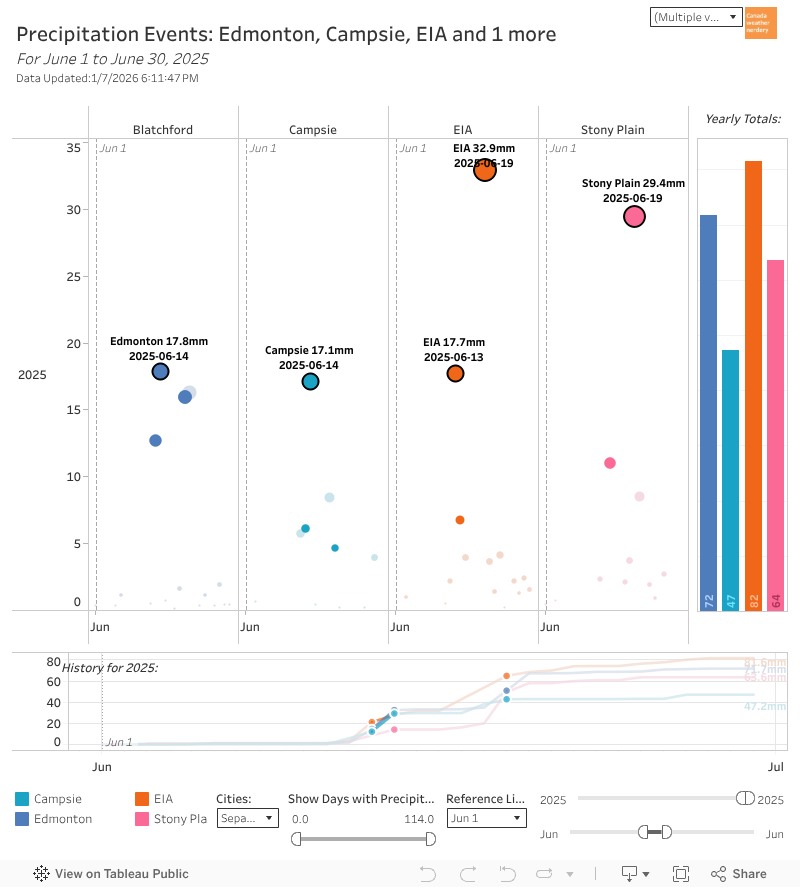
In June we average 77mm of precipitation, and 2025 was pretty average. The airport got 82mm, Blatchford got 72mm, and Stony Plain got 64mm.
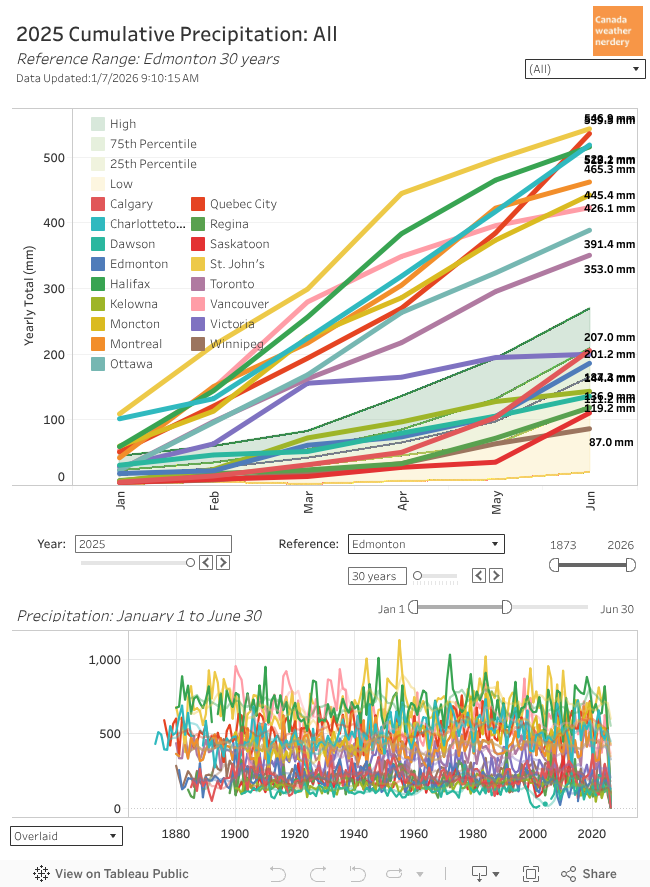
By the end of June we average around 203mm of precipitation for the year. In 2025 Blatchford is a little low with 183mm, the Airport has had 187mm, and Stony Plain had had 189mm.

These are the precipitation totals for 2025 so far across the country. 

St. John's and Quebec city are at the top around 540mm. All of the prairie cities, along with Victoria, are below 200mm.


Big Storms
Around Edmonton June's biggest storms were: 
  • Campsie 17.1mm on June 14st
  • Blatchford 17.8mm on June 14th 
  • Stony Plain 29.4mm on June 19th 
  • The Airport 32.9mm on June 19th

Across the country the biggest June storms were: 
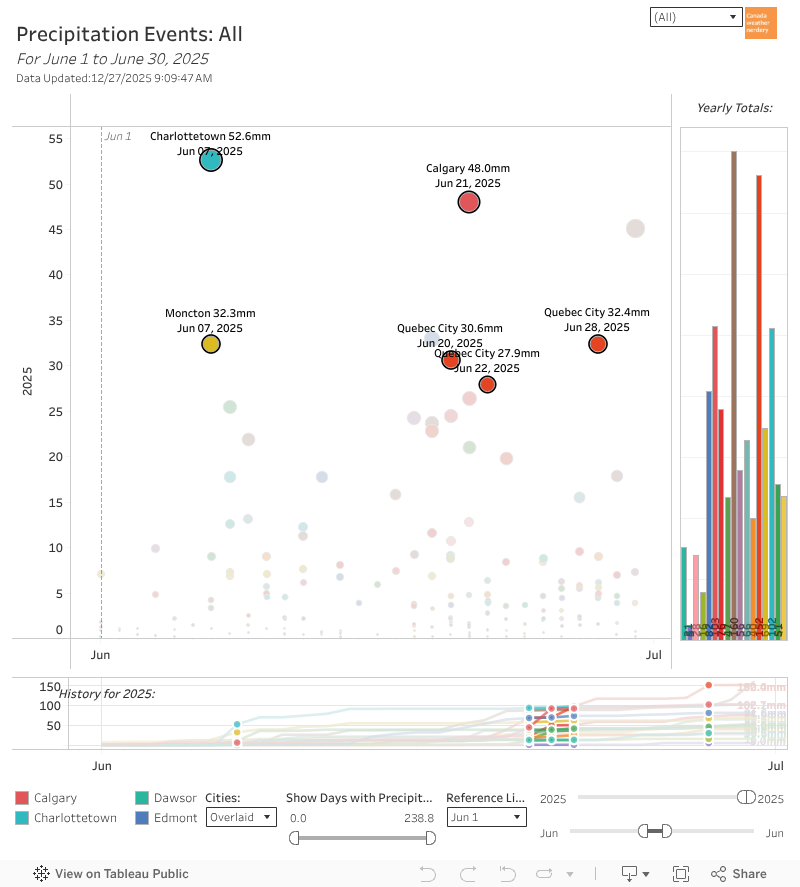
  • Charlottetown 53mm on June 7th 
  • Calgary 48mm on June 21st 
  • Moncton 32mm on June 7 
  • Quebec City had 3 ~30mm storms.


July
For July, the average High is about 23.5°C. It has around 25 days reach 20°C, including about 10 at 25°C. 

 Most July's will get at least one 30°C day, but recently 2020, 2019 and 2016 didn't.

July is also usually our rainiest month, with an average of 90mm.