2017/02/28

February Review / March Preview

February High Temperatures

Things have cooled off a bit recently, which almost makes it easy to forget just how warm things were during the middle of the month. We broke one all-time record on the 15th, at 16.4°C. That was the second warmest February day ever recorded in Edmonton, after February 27, 1889 at 16.7°C, and ahead of February 26, 2016 in third place at 15.3°C. That warmspell also broke three other recent records.

Before that though, we started the month with a pretty decent coldsnap. And to close off the month we settled in around the now-disappointingly-chilly average.

Looking at the last two months, the temperatures have only been slowly creeping up since New Year's. And that goes back to the idea that when our temperatures bottom-out for the winter, they hang out there for a long time. But as we head into March things should start to warm up faster.


Looking at February as a whole, we had 3 days above 10°C, which is more than any year since 1998. The last time a February had that many warm days was back in 1992, with 5. But it's actually not all that uncommon an occurrence - February 1889 recorded 6 days above 10°C.

For days above 0°C we only had 11, which is a bit on the low side. It's nowhere near as low as 2014 which only had 3, and it matches 2015, but 9 -of-the-last-19 February's had between 15 and 20 days above freezing.

February Low Temperatures

The low temperatures are a pretty similar story, with 3 recent records during the warmspell, along with a few other very warm days. And the early coldsnap had two recent coldest days.


This February had 4 nights that stayed above freezing, which is more than any of the other years since 1998.

For the colder nights, with 5 below -20°C and 2 below -25°C, that put this February around the middle of the pack.

Snowdepth

We've talked about snowdepth a lot in the past few weeks (Part 1, and Part 2 - the big melt) and on February 22 the Edmonton International officially dropped to 1cm of snow on the ground. It stayed there for a few days before we got some new snow on the weekend.

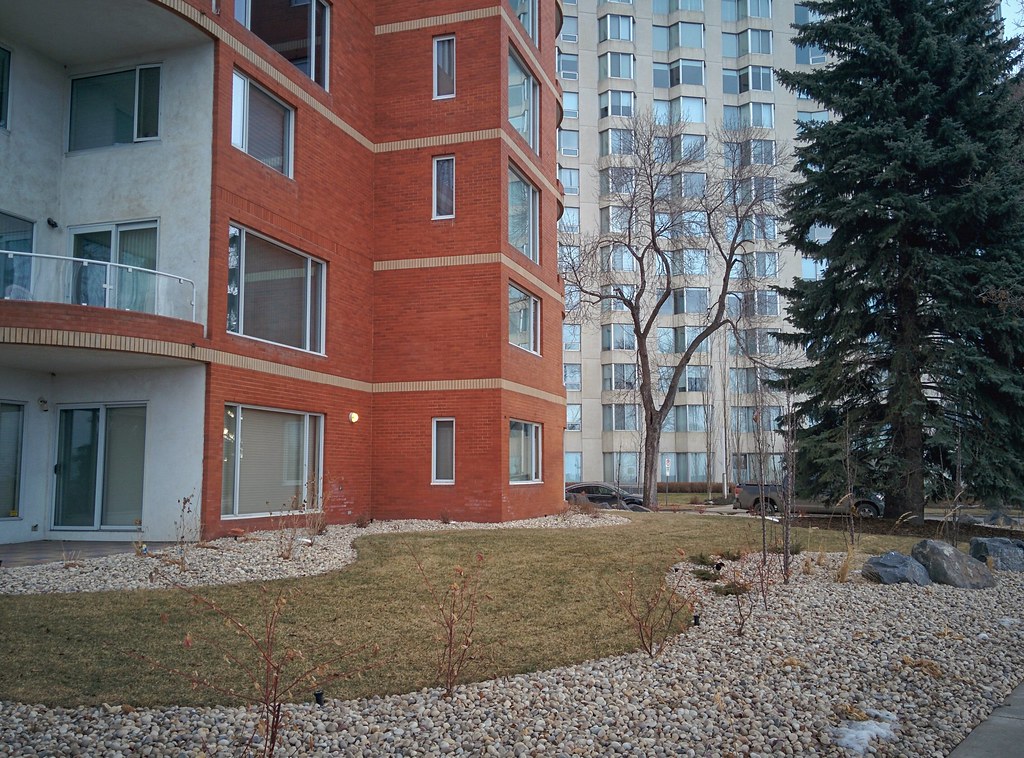
For my own reference as much as anything, this is what the downtown looked like while that airport had 1cm of snowdepth:


In the actual downtown it was tough to find any snow, but in big open areas like the golfcourse the snow was getting ready leave, but it hadn't quite stepped out the door.


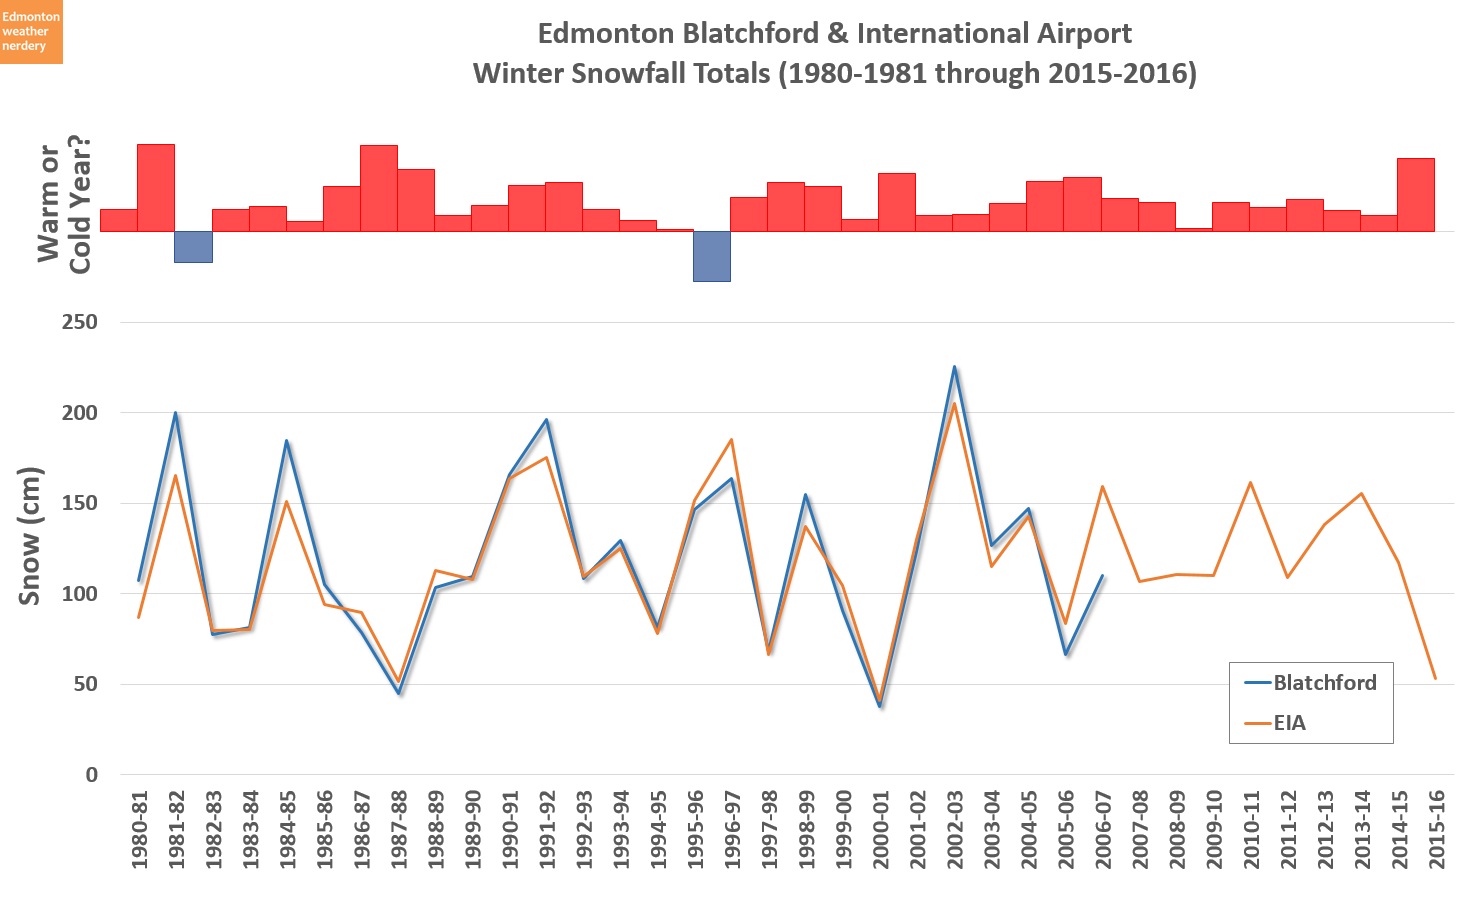
As of February 28 the International is sitting at 3cm of snow on the ground, which puts it in the second-lowest spot ever recorded at the airport, and just a bit below last year and 2006. Although the winter certainly isn't over yet.

Snowfall

In terms of total snowfall for the month, at 9cm we were a little bit below the average. That makes February the least-snowy month this winter so far, which is pretty typically. In March things usually bounce back up, so we'll have to see what this spring has in store.

March Temperatures


As we move into March we can expect to see a lot more warmer days. The average High hits 0°C around the 9th of the month, and on-average we get 19 days above freezing.

March is not without deepfreezes though, which show up as the blocks of dark blue. We had some in 2014, 2013, 2011, 2009, and etc. 9-of-the-last-19 Marches have had at least one low below -20°C, and 17 have had lows below -15°C.

And this month we'll take a look at the topographical map again:

This shows the daily temperatures for January, February and March for the last 20 years.

Right now it still doesn't look like much, because even in March the temperatures don't usually break the 5-10°C range. But we do see a lot fewer blue canyons in March than we did in January. And once we move into April some warmer colours will start to appear.

2017/02/21

Snowdepth - Part 2 - The Big Melt

Last week we looked at how snowdepth changes throughout the winter.

Today we're going to continue on that topic, and look at when our snow usually starts to disappear.
It's a funny thing to talk about today, since all of this winter's snow is basically already gone. But even in a normal year, the start of the big melt would usually be just around the corner.

Average Snowdepth

This chart is something that we looked at last week, and it shows the average snowdepth during the winter, along with the recent quartiles, highs and lows.

In 2016-2017 we've already had a few melts, which isn't particularly unusual. What is a little unusual, is that because we had so little snow to begin with, last week's very warm temperatures dropped the airport all the way down to 2cm. And right now the downtown has been basically snowfree for a few days.

Eye-balling off of the chart I've highlighted roughly the timeframe where snowdepth usually starts to decrease. This will vary a bit depending on the year, but in the first week of March the average, 25th and 75th percentiles all start to head down. The very snowiest years hang on a little bit longer, but by the time we reach the third week of March the snowdepth is plummeting. That's just the start of the melt though, and if we look at when the snowdepth finally hits 0cm it's usually about a month later - somewhere between the beginning and the end of April.

Low-Snow Winters

The speed of the yearly melt is obviously going to depend on how much snow we start with, so here are the 5 years with the lowest maximum snowdepth, going back to 1995. The winter of 2016-2017 isn't over yet, but I've included it here because so far we maxed out at 18cm back in January.

2000-2001 was by far the least snowy winter in recent memory, with the snowdepth never rising above 7cm. After that we have last year's non-winter, which reached 17cm in late-January, 1997-1998 comes it at 20cm, and 2001-2002 was at 25cm. After that, the next 7 years which aren't shown on this chart all topped-out between 26cm and 30cm. So a maximum snowdepth of between 25cm-30cm is actually pretty common.

Snowy Winters

The flipside of the low-snow years is the really snowy ones, and here we have the 5 winters (6 actually, since there's a tie) since 1995 with the greatest recorded snowdepth.

Our 5 low-snow winters ranged from 7-25cm, and these 5 snowy winters are between 44-53cm.

Our last two winters 2015-2016 and 2016-2017 have (so far) been very low, but in recent years 2010-2011, 2012-2013 and 2013-2014 were all in the Top 5. 2012-2013 was actually quite low for most of the winter, until a late-March storm pushed it up to 49cm for a week or two.

The Earliest Melt

So when does the snow finally disappear? Here we have the snowdepths just from March onward, and we're looking for the point where all of the snow that built up over the winter is gone.

Last winter the snowdepth first hit 0cm on March 13, which made 2015-2016 the earliest melt going back to 1995. Right after that it snowed again, but here we're just interested in when the snow first disappears. That might seem like a bit of a cheat, but we can see here that the late-spring snows don't usually hang around for more than a few days.

Keeping that assumption in mind then, 2014-2015 was the second earliest to hit 0, on March 28. And in 3rd place is our low-snow year 2000-2001, on March 31.

The years with the slowest or latest melts were 2010-2011, 2001-2002 and 2012-2013 all stretching until the last week of April.


Here's another version of the same chart, this time highlighting the actual drop. We can see that for the most part we hit 0cm around the first or second week of April - although there are a few early years and a few late years.

I usually think of melting as being a gradual process, where most of the snow will disappear quickly, but some remnants will seemingly hang around for weeks. We don't really see that here, because once things start they pretty much all head straight down to 0 (although a few years bounce up a bit from new snowstorms).

It is worth remembering though, that this is Environment Canada's snowdepth for the International Airport. In the real world there are probably patches of snow in the shade that hang around a bit longer than what we're seeing here.

When Snowdepth Reaches 0cm

Here we have all of the earliest and latest melts going back to the 1960s. Last year was very early, although it comes in 2nd place overall after 1988. And 2011 was pretty late, although a couple of other years stretched things into May.

If we look at the "average" day that the snow disappears, it's right around April 15th. Although more typically that means it fluctuates between the beginning and the end of April. And once again I'm surprised to see the late-80s/early-90s were consistently earlier than what we've seen recently - by about two whole weeks.

March Surprises

Today I've been talking about winter like it's already over, but that isn't necessarily the case:


In March through May we typically get about a quarter or a third of our total snowfall for the year, and here are a few winters which saw significant increases in snowdepth in either late-February or March. One thing that we can see from these late snows is that they don't usually last very long. These big jumps all disappear within a week or two.

The two most interesting winters here are probably 2011-2012 and 2005-2006. They both had really low snowdepth at the end of February, before some big storms pushed things way up, and extended their melts by a few weeks:

Snowdepth on February 20th

Here we have the snowdepths for each year, as of February 20th. Right now we're at 2cm, which puts 2017 in 3rd-lowest place overall after 1991 and 2006 which were both near 0cm.

At this point of the year 2012 was just a little bit higher at 4cm, before getting a tonne of new snow which pushed the snowdepth up by 25cm. And 2006 was basically at 0cm for the whole winter, before being buried under snow during March. So who knows what this spring will bring?

As we approach the end of February though, what we do know is:
  • the big melt will probably get started in a week or two
  • a few weeks after that it will be in full swing (assuming that there's still any snow left at that point)
  • in a typical year the airport would be completely snowfree in maybe another month-and-a-half

Right now the downtown is already basically snowfree. There is still snow in the parks and open areas, but anything that is close to a building or road is clear. So I'll be watching for when the airport's numbers officially hit 0cm, to compare that to what we see downtown, in the parks, and on the singletrack.

2017/02/17

Family Day

Here is the history of temperatures for the Family Day long weekend, going back to when it was first introduced in Alberta in 1990.

Temperatures

When Family Day was introduced I remember people asking: "Why would anyone want a holiday, in February, in Alberta?!?"

And if we look at that very first Family Day in 1990, it's almost like the weather was trying to prove a point: the temperature swung from a low of -31.2°C on the Saturday up to a balmy high of 2.6°C for the holiday Monday. After a weekend deepfreeze, I'm sure that people were more than happy to have the extra Monday off.

Since then the Family Day weekend has generally been pretty warm. The average high is -2°C, and the average low is -11°C. Of the 27 years shown here, there were only 9 which didn't have any days above 0°C, and also only 9 that had even one low below -15°C.

The warmest-overall Family Day weekend was last year, with all three days between 5-7°C, and warm overnight lows as well. To find the last "cold" family day weekend you have to go back to 2011, and even for that year the holiday Monday warmed up to just below freezing. The coldest-overall Family Day weekend was back in 1994, and it's the only Family Day weekend that was a complete deepfreeze, with all three days down around the -20°C mark.

Right now the forecast for this year is calling for highs right around freezing, and lows maybe down to about -10°C. That would make 2017 pretty similar to 2012, and one of the less-warm (although not actually cold) Family Day weekends. But after this past week, it'll be really tough to actually complain about the weather.

Personally, I tend to think of Family Day as always being a great time for winter bikerides through the river valley, and spots like Hawrelak Park are usually packed. Although this year I am expecting lots of ice.

Precipitation

In terms of precipitation, 2015 is probably the most interesting story, with 7.4mm of rain on the Saturday, and then just under 1cm of snow on the Monday. Beyond that, we might get some snow, but for the most part it hasn't been very much. For the whole history of Family Day, 1992, 1996 and 2003 were the only years with more than 5cm of snow during the weekend.

2017/02/14

Record Watch: Valentine's Day

Normally I look at weather history for long-weekends, and we will be back in a few days to check-in on Family Day.

But for today, the temperatures this Valentine's Day are supposed to be potentially record-breaking:


In recent years our average high on February 14th has been -3°C, and the average low -11°C. And in there we've had some warm years like 2016 at 5.6°C and 2011 at 7.5°C, or cooler years like 2009 at -11.4°C. We haven't had a super-cold Valentine's Day in a long time though - 2007 was chilly with a low of -22.4°C, but a reasonably nice high of -7.4°C. For a true deepfreeze you have to go all the way back to 1979 with a high of -24.1°C and a low of -35.1°C.

Right now the record temperatures for Valentine's Day were all set a long time ago. The warmest-ever-recorded Valentine's day was 1907, with a high of 10.6°C. 1981 came close to that though, reaching 10.3°C. The forecast high for today is 10°C, so there's a chance that we'll break the record today.


As usual though, whenever I look at records I like to look at the entire week, and not just a single day. And here we see the 50 warmest days (57 actually, because there's a tie again) for this week of February.

While the record for February 14th is 10.6°C, that's actually pretty low compared to most of the other days this week: the records for the 12th and 18th are both above 12°C, for the 16th it's 13.3°C, and the 15th has the warmest record at 13.9°C. So if we do break a record on the 14th, it's worth remembering that it's a pretty low-hanging fruit.

To get into the top-50 the temperatures need to beat 7.8°C, so this past Monday is included at 9.7°C, but the warm Sunday misses out at 7.4°C.

Looking at all of the years, there were lots of warm days this week in the 1890s, 1910s, 1930s and 1980s, but there hasn't been too much since then. After the week is over I'll be back to update this chart to see the full impact of 2017.

2017/02/13

Snowdepth

According to the forecast we'll probably see a lot of melting this week, so today we're going to look at how the depth of snow changes during Edmonton's winter.

This continues Edmonton Weather Nerdery's ongoing look at all-things-snow:
(I think we're finally getting close to the end)

The snowdepth measurement is a bit weird though, so we'll start with a few caveats.

Caveat #1: It's All Relative
January 28, 2017. And yes, that's Edmonton
This is a building near me, and from the middle of January through the beginning of February it was completely snowfree. And it will probably be snowfree again by this afternoon.

And that's not even very unusual, because for the 4 winters that I've lived nearby it has always had large patches of exposed grass during either January or February.

There are a few contributing factors: warm underground parkade, southern exposure, and I think there's an important windtunnel effect coming off of the river. But even compared to similar buildings a block away, this building and a few of its neighbours always lose their snow first.

I mention this, because snowdepth is obviously going to be very dependent on location. Today we'll be looking at Environment Canada's snowdepth data for the International Airport, and that won't necessarily be a great match for a downtown apartment building, or a spot in the shade, or a boulevard with a winter's worth of snow piled on top of it.

So today will be less about the specific numbers, and more about how different winters compare to one another, and how snowdepth changes over the course of a winter. The word for the day is "relative."

Caveat #2: The Data

Today we're going to look at data from the International Airport, because Blatchford has no data from 2007-2015. But Blatchford's data also has other problems, like this:


Environment Canada's records for January 2017 at Blatchford show that the snowdepth jumped by almost 10cm on January 12. Except that in reality there was definitely no giant blizzard on that day. And later in January we had two don't-call-them-chinooks which caused a lot of melting, but Blatchford's numbers don't reflect that.

So this Blatchford data is obviously wrong, but the only reason that I recognize that it's wrong is because it just happened.

We won't be using the Blatchford data for anything today, but the data for the Edmonton International might have similar errors in it, and I would never know. The International does have a bunch of suspicious 0's - a snowdepth of 20cm one day, 0cm the next, and then 20cm again the day after - and I've tried to correct those. But there could be other problems hidden in the long forgotten decades.

Even with those caveats though, I still want to know about snowdepth, so lets see what we've got:


Snowdepth on February 1st

February 1st is a nice midpoint for the winter, and this year we were sitting at 9cm (and since then we've crept up to 13cm). Going back to 1961, that put us in 8th lowest place overall.

While I don't necessarily have huge faith in the absolute numbers here, the lowest recorded snowdepth was essentially 0cm in 2006, and the two highest were 58cm and 66cm in 1974 and 1971. Those two highs are pretty big outliers compared to any of the other years.

Our average snowdepth for this time of year is about 20cm, although that can swing pretty wildly from something like 5cm in 2012 to 38cm in 2011. Looking at the 5-Year average we've been a bit on the low-side over the last few years, but the late-80s were more consistently low (and once again, that is not how I remember things at all).

February 1st is just one point in time though, so next lets look at how things change over the whole winter. 50 years of data is a little overwhelming, so for this we'll stick to more recent history.

Snowdepth since 1995

Here we have the snowdepths over the course of a winter, going back to 1995-1996.

We've seen before that we don't usually get lasting snow until November, and here we can see that the snow mostly disappears by early April (at least according to Environment Canada's measurements).

Snowdepths in the last three winters have all been pretty low, but before that 2010-2011, 2012-2013 and 2013-2014 were all pretty substantial.

If we roll each of those individual years into my typical average/quartiles/max/min format we get this:

Average Snowdepth

In the background here the average snowdepth for each day of the winter is shown by the solid, white line. Surrounding that in the darker blue area are the 25-75th percentiles, which is where we'll be about 50% of the time. And then outside of that are the highest, second highest, lowest, and second lowest totals recorded since 1995.

For 2016-2017 we had the surprisingly large snowfalls in October, which melted fairly quickly. Then a storm in mid-November pushed us up to the average, although that really only applies to the airport. On November 15 & 16 it got 9cm of snow, but that snow completely missed the city. Back when we'd looked at yearly snowfall totals we saw that over the course of an entire winter Blatchford and the International were usually pretty close, but certainly there will be some storms that hit one location and not the other.

The snows of December and January briefly pushed the airport back up to the average, but then the chinooks of mid-and-late January melted half of that off, and dropped us below the 25th percentile (that was when I took the earlier picture of the snowfree apartment building). Since the beginning of February we've gotten a bit of new snow, but the warm temperatures this week will probably make a pretty big dent in that again.

We saw up above that individual years are pretty variable, but on average the snow starts piling up in November, and the snowdepth climbs throughout the winter until the beginning of March. At that point the average starts to drop, and by the time we hit late-March it's in freefall.

Snowdepth vs. Total Snowfall

One thing to keep in mind is that snowdepth is not the same as total snowfall.


This chart tries to show how snowfall and snowdepth compare. Basically: snowfall dwarfs snowdepth. The winter of 2016-2017 is a good example of that difference, with a lot of our snow falling in October, and then quickly vanishing.

In a typical winter we get between 100cm and 150cm of snow, but the maximum recorded snowdepth since 1995 was only 53cm. And since the records started in the 1960s, the maximum snowdepth ever recorded was 84cm in March of 1974. 84cm is pretty deep snow (the second most was 66cm in 1971), but that's a record amount, and it is still only about half of the total snowfall that we would get in any typical year.

I might do another post later on looking at how snowdepth actually relates to snowfall, but for now I assume it's some combination of:
  • snow compresses over time
  • the deeper or heavier the snow, the more it compresses
  • snow melts during our reliable mid-winter warmspells
  • snow at the beginning and end of the winter quickly disappears

The spring is interesting, because during March-through-May we average about 40cm of snowfall, but the snowdepth usually starts to flatline in early March. Spring snowfall is about 1/4-to-1/3 of our total for the year, but it doesn't add up to much on the ground.

I'll leave things there for today. Next week will be Snowdepth - Part 2, where we'll take a closer look at when the big melt starts.

2017/02/06

Snowstorms

I've had this one written for awhile, but I like to be topical and was really hoping to post it during a snowfall warning or a nice, 3-day snowstorm. But since October we haven't had much in the way of snowpocalypses.

We might get a bit of snow today, but southern Alberta is getting a true snowpocalypse right now. And that's as good an excuse as any to talk about snowstorms. This is Part 5 of my recent(ish) look at Edmonton snowfall:

The first question is: when it snows, how much does Edmonton typically get? 1cm? 10cm? More?

Typical Snowfall Amounts

This shows the breakdown of how much snow we get in a typical day's snowfall. I'm including data from Blatchford and the International here, because Blatchford data goes all the way back to 1880 but stops in 2007, and the International data is current but it only goes back to 1961.

For both Blatchford and the International, almost half of the time snowfall will be less than 1cm. About 85% of the time it will be less than 5cm, and 95% of the time less than 10cm. And days above 30cm are very rare.

Looking at daily snowfall is a bit problematic though, because snow will often start in the evening and continue on through the morning. Environment Canada's numbers would split that across the two days, but I'd rather look at that as a total. So for the rest of today I'm going to look at snowfall "Events" and try to combine the totals when there were several days in a row with snowfall.

I'm going to define a Snowfall Event as:

  • the total snow on consecutive days where each day received at least an inch of snow. 

I've put that 1" cutoff in there, because I don't want to combine a bunch of days which only received a light dusting. 1" is completely arbitrary, but using 1cm as the cutoff seemed too low, and setting it at 2.5cm moves things beyond the 0-2cm range which makes up about 65% of snowfalls.

So with all of that said, here is the chart revised for these multi-day snowfall Events:

Typical Multi-day Snowfall Events

It doesn't look much different, but things have shifted around a bit. In particular, for snowfall of 10cm or more we're now seeing slightly higher numbers. What's happening is that some of the 2-5cm and 5-10cm days are now combined to give larger multi-day totals.

For a little bit more explanation of what grouping snow into these Events actually does:

Here we have hypothetical examples of two different 3-day sequences - in both cases the total snow for the 3 days is 20cm.

Example 1 is counted as 3 small snowfalls, because the second day only received 1cm of snow, which is below the 2.5cm cutoff.

Example 2 is grouped together as one big event, because all three days cross the 2.5cm threshold.


This is just an approximation that I've made up, and it's certainly not perfect or scientific. But for trying to count snowstorms I think it makes sense to group snowfall into a multi-day total like this, rather than just looking at the 24-hour amounts.

So what qualifies as a lot of snow? Personally, I think 10cm is a nice starting point. With 10cm of fresh snow on the ground walking and biking gets challenging, and I'm sure that the Quesnell bridge will be a mess.

More than 10cm (4") of Snow

Here we have the count of snowfall events for each year that are greater than 10cm.

I haven't included 2016-2017 in any of the charts today because the winter isn't over yet. But for the record, back in October the International got 11.5cm from the 7th through the 9th, and then 9.5cm on the 14th. And those are the only really notable storms so far.

This also isn't perfect, because it shows 2015-2016 with no 10cm events, while I'm pretty sure that the downtown had one major snowstorm. For November 23 & 24, 2015 the International recorded 9.4cm of snowfall, but Environment Canada also has a station at the UofA which recorded 15cm. I think that's a better representation of what actually hit the city, but I'm not going make things even more complicated by mixing in the data from a 3rd station. For today we'll just have to accept a bit of imprecision.

Generally, we can see that in most winters there are from 2-to-5 10cm snowfall events. Some winters have 6-or-7, and some have 0-or-1, but 2-to-5 is pretty typical. And outside of a few really snowy years (1903-1904 and 1906-1907) that hasn't changed much in the last century.

When are these 10cm+ snowfalls most likely to happen?


Of the roughly 2-to-5 snowfalls greater than 10cm in a typical winter, here is the likelihood of them occurring in each month.

If I had been forced to guess, I would have said that November gets a disproportionate number of big snowfalls. Looking at the numbers though, things are spread fairly evenly. Of the real winter months January is the highest and February is the lowest, but none are really a huge standout.

For a little bit more context, for the rest of today we're going to include Montreal as a comparison.


Here we have the same count of yearly 10cm snowfall events, but with Montreal added on top in purple. Central Canada and the northeastern US gets much larger yearly snowfall totals than we do, and I wanted to see how things compare.

Where Edmonton typically gets 10cm snowfalls 2-to-5 times per winter, Montreal is more in the range of 4-to-7. And their historic extremes are between 15 and 18 times per year.

(if it looks like Montreal's numbers are trending downward, that is correct. Montreal's overall snowfall has fallen by about 50% over the last century. But that is a story for another time...)

For a little bit more detail, here we'll look at recent history:


This is the same chart as above, but now only going back to 1980. (Montreal's data ends in 2013, so the last few years might look low on this chart, but that is because they are actually missing).

Hopefully this makes it a bit easier to see what is going on. Blatchford and the International are pretty similar, although it looks like Blatchford typically got a few more snowy days (before the data ended in 2007). And Montreal generally gets about twice as many 10cm snowfalls as the Edmonton stations (before that data ended).

10cm is pretty snowy, but it's not really snowy. Next we'll look at snowfall events of more than 20cm.

More than 20cm (8") of Snow

Here is the same basic chart, but now we're looking at snowfall events of 20cm or greater.

The numbers have dropped off, with Edmonton now typically in the range of 0 or 1 events each year. And going back a century it hasn't changed much - the average has fluctuated around a 60% probability each year since the records started. Montreal is much higher, frequently seeing 3 or more 20cm snowfalls, although there are a few years that have only seen 1.

Now we'll focus on recent history again:


Here we have a closer look at the 20cm snowfalls.

The standout is 1992-1993 with 3 20cm snowfalls at Blatchford, but that whole 1990-1994 period had at least one 20cm event each year. More typically though they happen about every-other-year. And just in the last 10 years Edmonton's numbers have dropped, so that we've only seen a 20cm snowfall every 3 or 4 years.

Montreal's numbers bounce around quite a bit, but they've almost always had at least 1 20cm snowfall, and 2007 had 7. And then from 2013-2014 there are no records.

Finally we'll up the numbers one more time and take a look at 30cm snowfalls.

More than 30cm (1') of Snow

At least according to Environment Canada's measurements, 30cm snowfalls are very rare in Edmonton - there have only been about 20 of them recorded going back to the 1880s. There was a period in the 1940s where they happened almost every-other-year, and there were two in the winter of 1984-1985, but other than that things have been much more spread out.

The most recent was 35.2cm on May 5th & 6th 2003, and before that 40.6cm on April 6th & 7th 1991.

Montreal also doesn't typically get a huge number of 30cm snowfalls, but they are more frequent and occur roughly every-other-year. And 2007-2008 was a really snow year, with 3 of them.

I chose to include Montreal in these charts today for a few reasons:
  1. I was curious how central Canada compares to Alberta.

  2. Adding Montreal actually makes the 20cm and 30cm charts easier to interpret - they don't look very good with Edmonton data alone since it just bounces between 0 and 1. 

  3. Having a second city gives a bit more context. I know that the absolute numbers today - 10cm, 20cm, 30cm - are a little questionable. As I said, last November there was one day downtown that definitely had more than 10cm, but Environment Canada didn't record it that way at the airport. And in the last 5 years the media have reported 30cm at least a few times, but again those don't show up here. With Montreal here as a comparison, we can see that whichever exact "10cm" or "20cm" we're talking about, Montreal obviously has more of those than Edmonton.
For that last point then, lets go back to the beginning and look at the breakdown of typical snowfalls - but this time with Montreal added to the mix:

Typical Snowfall Events redux

And here we can see that Montreal's distribution is a little different than Edmonton's.

In particular, about 7% of their snowfalls are 20cm or more, compared to 1-2% of the time for Edmonton. And 18% of their snowfalls will be 10cm or more, compared to about 8% for Edmonton. Montreal has a shorter snow-season than Edmonton does (which we saw here), but when they get snow they are more likely to get more of it.

Finally for today, just for the sake of trivia lets look at the biggest snowfall events for Edmonton and Montreal:

Largest Snowfall Events

There's a lot of information here, but this is basically a scatterplot of the largest recorded snowfalls for Edmonton and Montreal. It shows the Top-5 largest snowfalls for each city, and I've broken things down into the modern era from 2000-onwards, as well as the Top-5 ever recorded.

Because of the way that I've grouped snowfall into events, some of these totals were just one snowy day, some were 2 or 3, and there's one which is most of a week. 25cm spread over January 17-22 is maybe stretching the idea of a "snowfall event" a little bit, but the rest are okay. And I'm still happier using these multi-day groupings rather than individual 24-hour periods.

Historically, Montreal's 5 largest multi-day snowfalls were in the range of 57cm to 68cm. But since 2000 the largest was 50cm in 2000, with the rest between 36cm and 46cm.

Edmonton largest historic snowfalls are between 42cm and 47cm. And the recent Top-5 ranges from 21cm up to 35cm in 2003.

Ultimately though, what all of this means for giant snowfalls in Edmonton is:
  • 10cm (4"): usually about 2-5 times per year
  • 20cm (8"): maybe every-other-year
  • 30cm (1'): none in the last decade, 3 in the last 30 years.
And as I said earlier, for the winter of 2016-2017 the two big snowfalls were back in October: 11.5cm on the 7th through the 9th, and then 9.5cm on the 14th.