
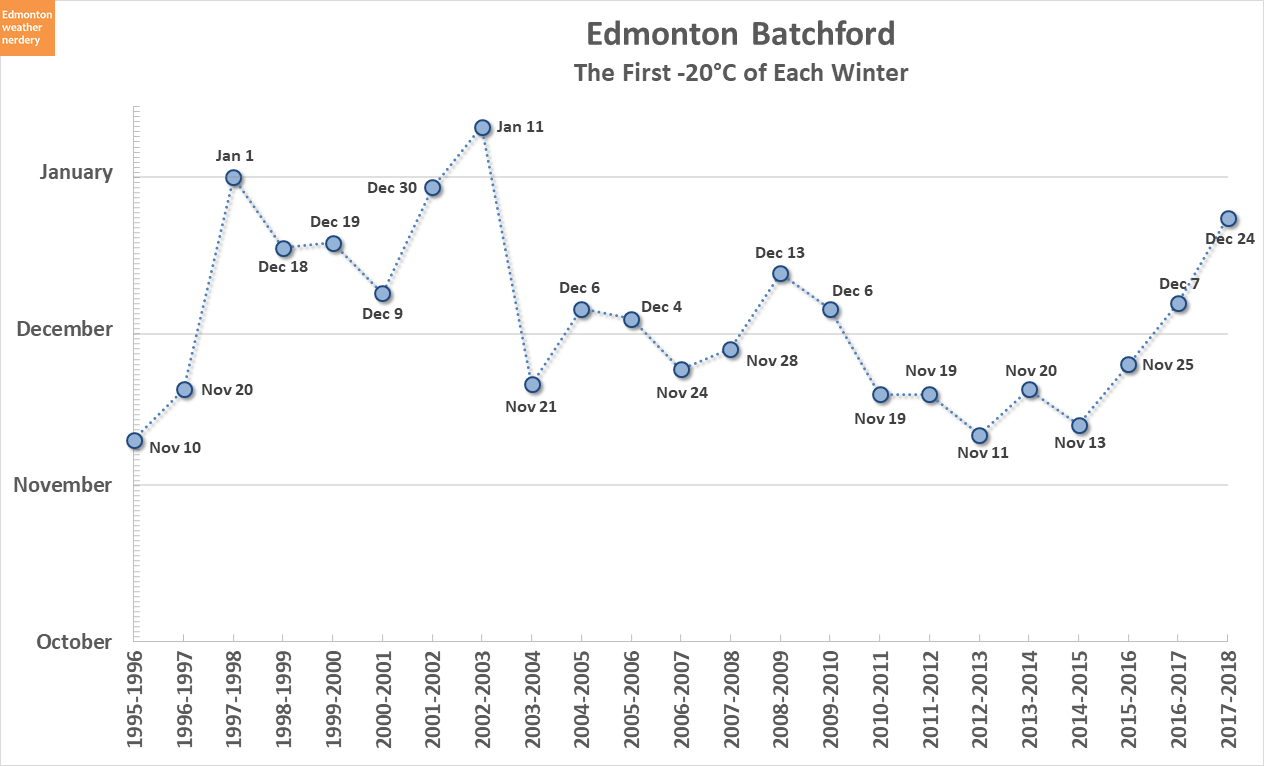
New Year's Eve Temperatures

In the last 30 years the average temperatures for both New Year's Eve and New Year's Day have been a High of -8°C and a Low of -16°C. Just last week we looked at Christmas Day, which has an average that's a little bit higher with a High of -4°C and Low of -13°C.
One of the important things about New Year's Eve is always hoping not to freeze at -20°C or -25°C while waiting for the fireworks in Churchill (or at any other outdoor activity). And that's a bit hit-or-miss. In the last ten years 2008, 2009, 2010 and 2013 all had Lows below -22°C.
This morning the temperature dropped to -27.9°C, and if that ends up being the Low for the day then that would make 2017 the coldest New Year's Eve since 1984 which was at -29.3°C. But the forecast for tonight is calling for the temperature to fall further to -29°C, and so the city has announced that it's cancelled most of the outdoor events. New Year's Eve 1984 was -29.3°C, and 1981 hit -29.4°C, and to find anything colder than that we would have to go back to 1964 & 1965 which both dropped to -31.1°C.
On the bright side though, the last three New Year's Eves were fairly warm with Highs of 3°C, 2.5°C and -1.5°C respectively for 2014, 2015 and 2016, and then Lows of -3.6°C, -14.4°C and -9.7°C.
New Year's Eve Temperatures

Unsurprisingly, New Year's Day has been very similar to New Year's Eve.
In recent years 2015 and 2016 were both warm with Highs of 3.2°C and 1.4°C, but 2016 was cooler with a High of -8.8°C and Low of -17.1°C.
New Year's Eve & Day Precipitation

When we looked at Christmas last week I combined the precipitation numbers for Christmas Eve and Christmas Day, and I think that's a fair approach again since New Year's Eve and Day are so closely tied.
We saw that Christmas hasn't gotten new snow very often in the years since 1992, but for New Years it's about 50/50. (please note: Blatchford is missing data for 2007-2014, so in the chart above the International's data is correct)
Jewelry stores used to do a promotion where if it snowed X amount (I can't remember how much) on New Year's Eve or Day (also can't remember which) then anyone who'd bought something during the holiday season would get it for free. Across the two days the most snow we've gotten recently (ie. since the 1930s) was 11.8cm at the International for the 1997-1998 New Year's.
And since the 1880's rain has been recorded twice - 0.5mm in 1958-1959 and 0.6mm in 2000-2001.
New Year's Day Snowdepth

And finally, here we have the snowdepth at Blatchford and at the International on New Year's Eve.
The average hovers around 15cm. In 2014, 2015 & 2016 we were on the low side of that, but in 2013 the International was way up at 41cm (Blatchford data is missing for that year).
We recently looked at Low-Snow (or brown) Christmases, and here we see several of those years were still lacking snow on New Year's: 1959, 1989, 1993, 1997, 1999 & 2005.


