
High Temperatures

The grey band in the middle of this chart is the 25th-75th percentiles for our High temperatures, which is where the temperatures will fall about half of the time. In the first part of the month July 1, 2, 7, 8, 12 & 13 were all below the 25th percentile and were pretty chilly for July. And only 1 day was actually above the 75th percentile into "hot" territory: July 16th at 27.1°C.
That all changed on July 27th when the temperatures finally (finally) jumped above average. They stayed there until the end of the month, and the forecasts say they will continue at least a little longer into August.
At the end of the month we finished with 17 days below average (including a 30-year coldest High), and 14 days above average.

July 2020's average High of 23.4°C was on the cooler side of recent years, ranking as 12th warmest since 2000.
Hot Days So Far...

For slightly hotter days, we had our first 28°C High quite late on July 27th. We have now had 3 of those, while the average is around 6. And for milder 20°C days we have had 57, and that is below 2015-2018, but is pretty close to the long-term average.
Low Temperatures


Warm & Cold Months

July 2020's average Low of 12.9°C is right on the recent average, and ranks as #13 out of 140. While the July Highs have stayed fairly constant over the years, the average Lows have steadily increased from 8.5°C a century ago to about 13°C today.

Usually in these monthly reviews we talk about the mean temperatures (High & Low) of each month, but this is the middle of summer, and what people really care about are the Highs. So sticking with the Highs temperatures, in this chart the bubbles represent the average Highs for each month going back to 2000. These are compared to the 20th century average, and so big, orange bubbles were warmer than the 20th century average, and big, blue bubbles were colder.
You might notice that it has been a while since we have seen an orange bubble, because the last "warm" (above-average) Highs that we saw were back in February. Highs in March & April were both about 2°C below the 20th century average, and May, June & July 2020 barely show up here because they were so close to average.
So far during what we might call "summer" 2020 hasn't had any hot months, and it joins 2019, 2010, 2009, 2008, 2005, 2004 & 2000 which all had average-to-cool Highs for May through July. In 2019 that continued through August & September, and we didn't get another "warm" month until November. But hopefully August will turn things around for 2020.
Across the Country


Monthly Precipitation
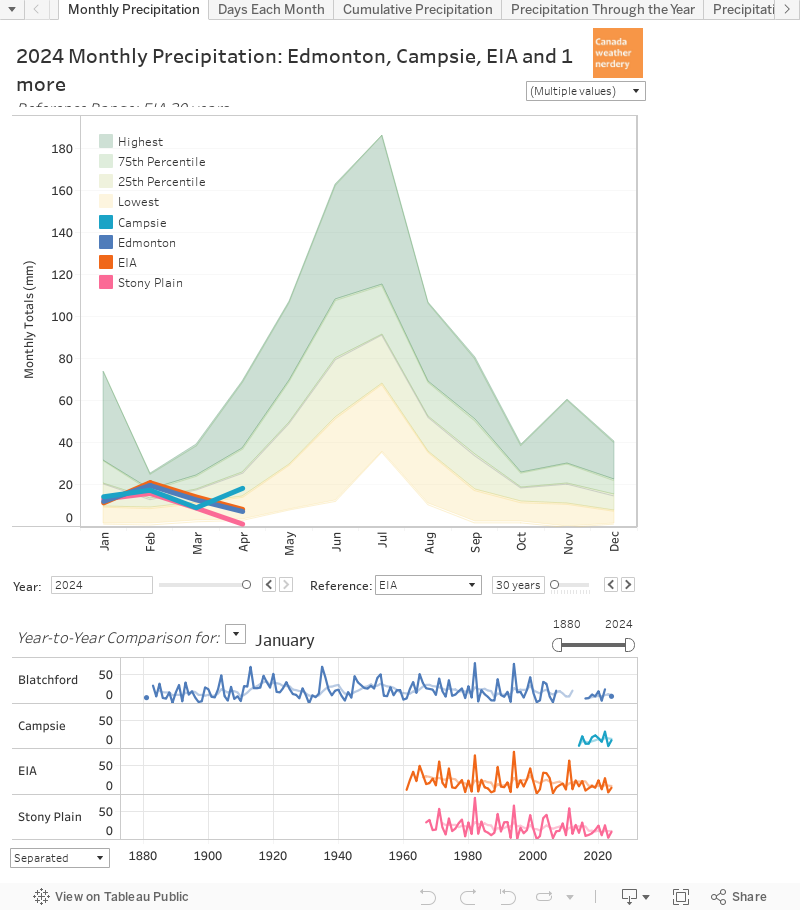
July's average precipitation is 90.8mm, so the International was just a bit above that, while Blatchford was above the 75th percentile and into the realm of "lots of rain." And looking at the chart June and May also both had lots of rain at both stations.
Blatchford's May-June-July total of 319.6mm was actually its 5th highest since 1880 (1901 leads with 410.4mm). The International's 310.1mm was its 3rd highest May-June-July since 1960 (2010 had 332mm).
Days With Rain

Precipitation So Far...

August Temperatures

For August the daytime Highs are above 20°C most of the time, with typically about 25 warm days each month. We also average a week or two of days above 25°C, but 30°C days only happen about half of the time in August. For the Low temperatures it should be a lot of the same 10-20°C orange which we saw for July, but with a few more nights in the 5-10°C range, and every 5 years-or-so a night below 5°C. And also, August's average precipitation is about half of July's.
August 2019 was pretty blah, but that followed a string of warm years from 2011-2018. So hopefully last year was the anomaly, and summer 2020 actually hangs around for awhile this time.
No comments:
Post a Comment