
High Temperatures

The High temperatures for November 2019 started off around average, then dropped for a week, then spent 11 days-in-a-row above average, and then finally cooled over for the last week.
The grey band in this chart shows the 25th-75th percentiles, where the Highs will fall about half of the time. And we did have a few days outside of that, but we didn't come close to the warmest or coldest temperatures for the last 30 years (the orange and blue areas) or to the warmest and coldest since 1880 (the orange and blue lines).

Looking at the individual numbers we had 10 days with Highs of 0°C or colder, and 20 days with Highs above freezing. We average 18.6 days above freezing in November, so 2019 was just a little bit less frozen than normal. We didn't have any Highs above 15°C, but we did have two above 10°C with the 17th at 11.9°C and the 23rd at 10.6°C.
Our coldest High was -12.1°C on the 10th. The last time that November had a High below -15°C was 2014, which had one High all the way down at -20.4°C.
The average High of 1.3°C was the 11th warmest out of the past 20 years.
Low Temperatures
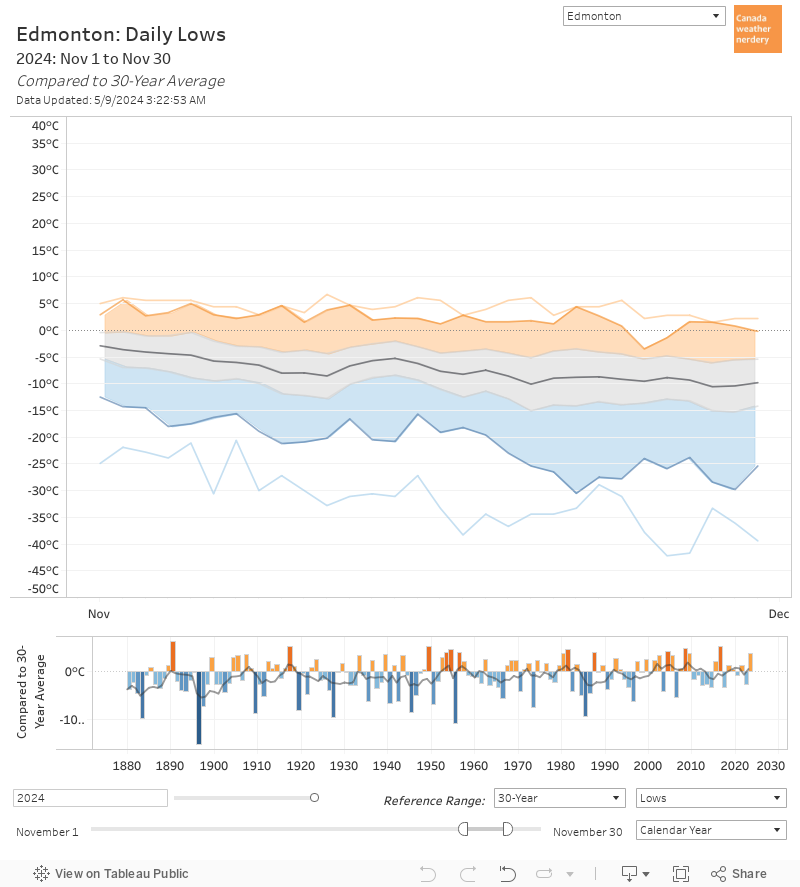
For the low temperatures we were right down at the bottom of the 30-year range early in the month, with the 7th at -13.6°C, and the 11th at 19.6°C. And then the 23rd, 24th & 25th were right at the top of the 30-year range.

We didn't have any -20°C Lows this November, although we came really close with -19.6°C on the 11th. We also had 4 Lows above freezing, and November's average is 3.4 days.
November can sometimes have some really cold days, and those show up here as the dark blue boxes. 2014, 2011, 2010, 2006 & 2003 all had November days below -25°C.
The average Low of -7°C was the 11th warmest out of the past 20 years.
2019 So Far
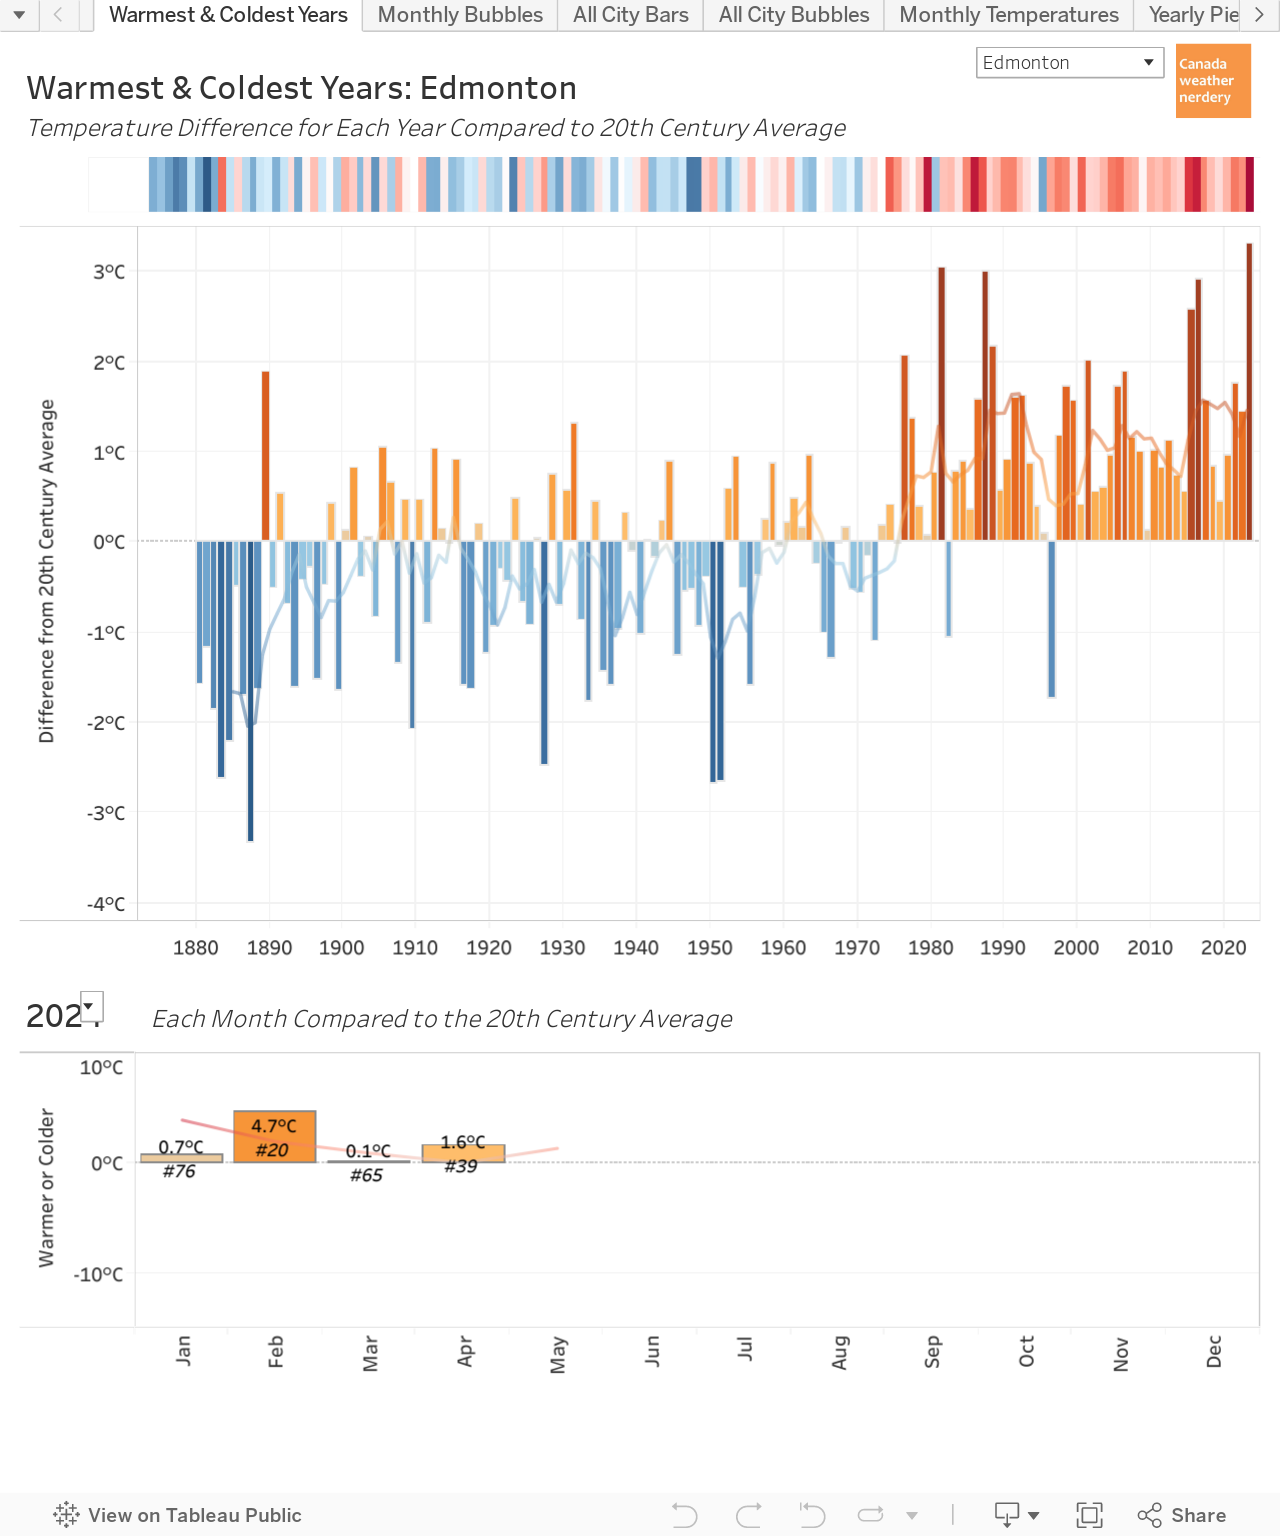
When we add up all of the High & Low temperatures for 2019 so far it has been 0.2°C warmer than the 20th century average. There's still a month left, but right now it's about the 65th warmest out of 139 years going back to 1880.
The bargraph at the bottom shows how things have gone so far in 2019: warm January, really cold February (Edmonton's 5th coldest), slightly warm March, pretty average summer, warmish September, coolish October, and finally a warmish November. All of that talk of "warm" or "cold" is relative to the 20th century though, and not necessarily to recent years.
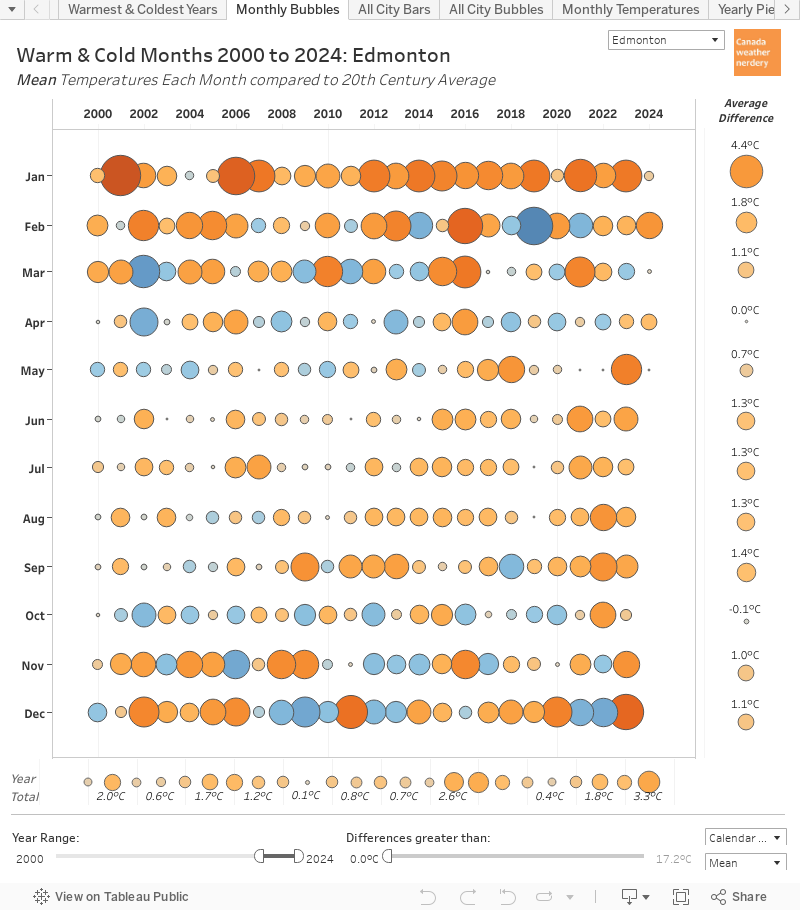
Here we have the history of the monthly mean temperatures for the last 20 years, with each month represented as a bubble.
For 2019 the giant blue bubble for the cold February stands out. And the very average summer was quite different from the past few years. Once we hit fall all of the years get a little bit more random, and alternating warmish/coldish/warmish months aren't unusual.
Looking ahead to December, in the past 5 years we have had 4 warmer than average final months. But then for 2007-2013 6-of-7 Decembers were colder than average.
Precipitation

For total precipitation (rain + snow) November 2019 was just a bit above average at both Blatchford and the International. The November average is 20.5mm, and the International recorded 23.7mm with Blatchford at 24.8mm.

It's worth mentioning that some of that precipitation (4.1mm at the International) fell as rain. November 2019 had 4 rainy days, which was down from the 6 in 2018, and a bit below the average of 4.5 days.

For the year so far Blatchford has recorded 454 mm of total precipitation which is just above average, while the International was a little below at 412m.
That's a change from 2017 & 2018 where Blatchford's precipitation had been more than 100mm below the International.

For a bit of context, in this (messy) chart we have the January-November 2019 precipitation for 8 other Canadian cities compared to Edmonton. Edmonton is the blue line down with Calgary, Winnipeg & Regina all around 400-500mm. Toronto, Ottawa & Vancouver are all over 800mm and roughly double the prairie cities. And then Montréal and St. John's are up around 1,200mm.
Snow

November might have felt a bit snowy, or maybe not? With 21.2cm at the airport it was just a bit above November's average of 20.1cm, but it was snowier than our below-average October and September.
Do you know who hasn't had below-average snow?

Calgary just had it's snowiest November since 1966 with 43.4cm (narrowly passing 2014's 43.2cm). That combined with an above-average October and a snowiest-since-1972 September brings Calgary's total for September-November to 93.6cm. That is their snowiest fall since 1925's 131.9cm, and their 3rd snowiest on record.

Here's another messy chart to show Calgary's cumulative snow compared to everyone else. Their 93.9cm is more than double Winnipeg's 43.2cm 2nd place, and then the rest of the cities are down around 30cm or less.
Snowdepth

Here we have the snowdepth at Blatchford and the International. At the end of November Blatchford is down near 1cm, while the International is a bit above the average with 17cm. Both of those numbers will likely grow as we move through winter towards the big melt in March.

Winter 2019-2020 is just getting started, and this chart shows that we normally have measurable snow on the ground from around now until about the end of March.
December Temperatures

For December Temperatures on average we have about 10 days with Highs above 0°C. Some years have more than 15: 2017, 2011, 2006, 2005, 2004, 2003, 2002 & 1999. And then others have 6 days or less: 2012, 2010, 2009, 2008, 2007, 2001, 2000. Last year December 2018 was pretty average with 9 above-freezing days.
For the Lows, in the last 20 years there have been 2 Decembers which didn't hit -20°C, and 11 which didn't hit -25°C. We are definitely entering the season of weeklong deepfreezes, but luckily they usually get balanced with a mild week or two.
No comments:
Post a Comment