2016/03/05
The normal temperature for today is...
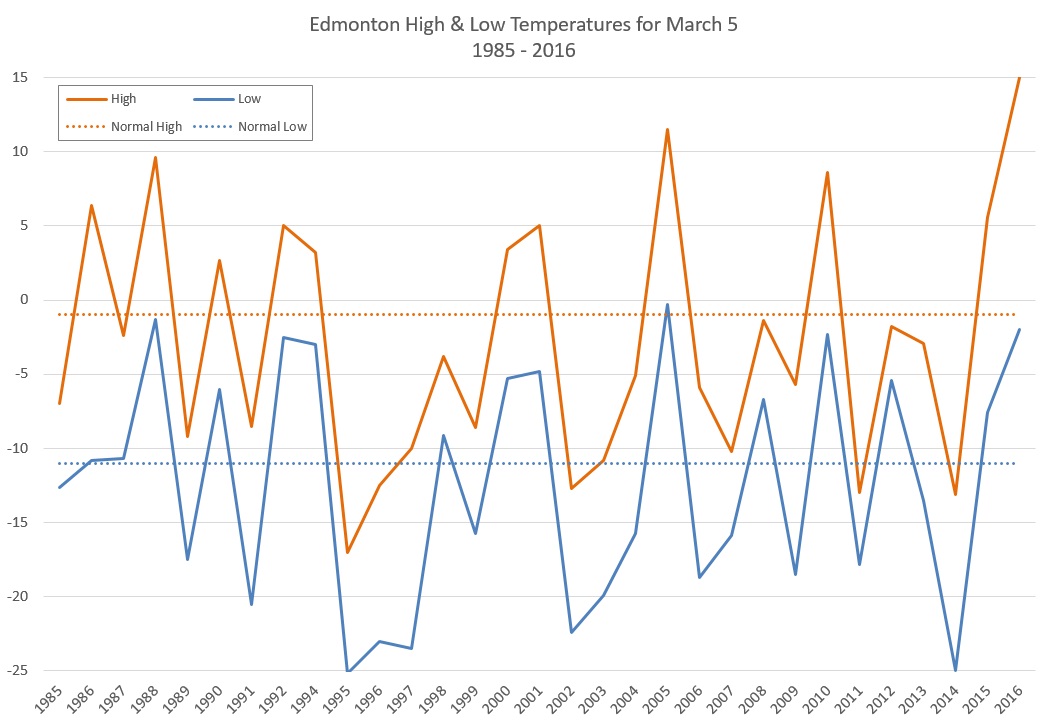
I don't really like the "normal" temperatures that are reported with weather forecasts. I understand why they're there, but they are not very useful. They're based on the rolling 30-year average, but if you look at 30 years of data for a single day (like March 5, for example) it's all over the place.
For anyone interested in the statistics, the standard deviations for March 5 are 7.9°C for the high, and 7.8°C for the low. So 50% of the time the daytime high can be expected to fall between -6°C and 4°C, and the actual March 5, 2016 high of 15°C is only likely to occur 2% of the time.
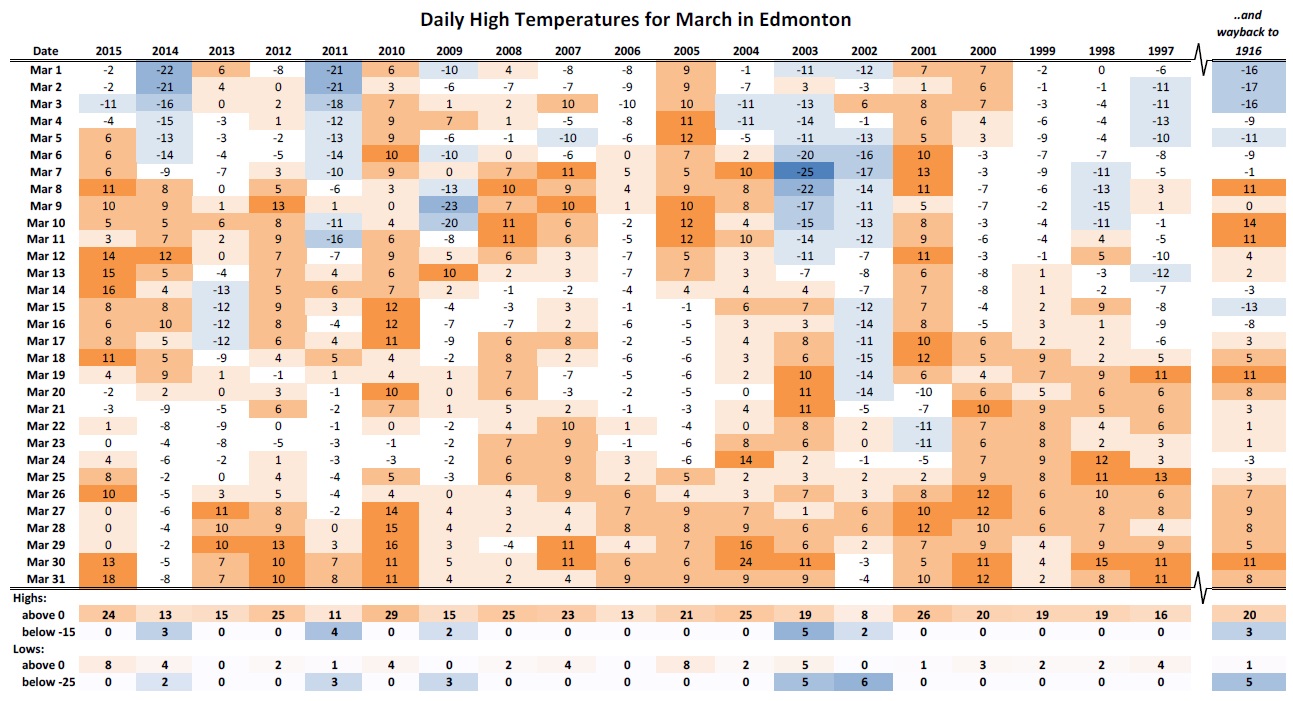
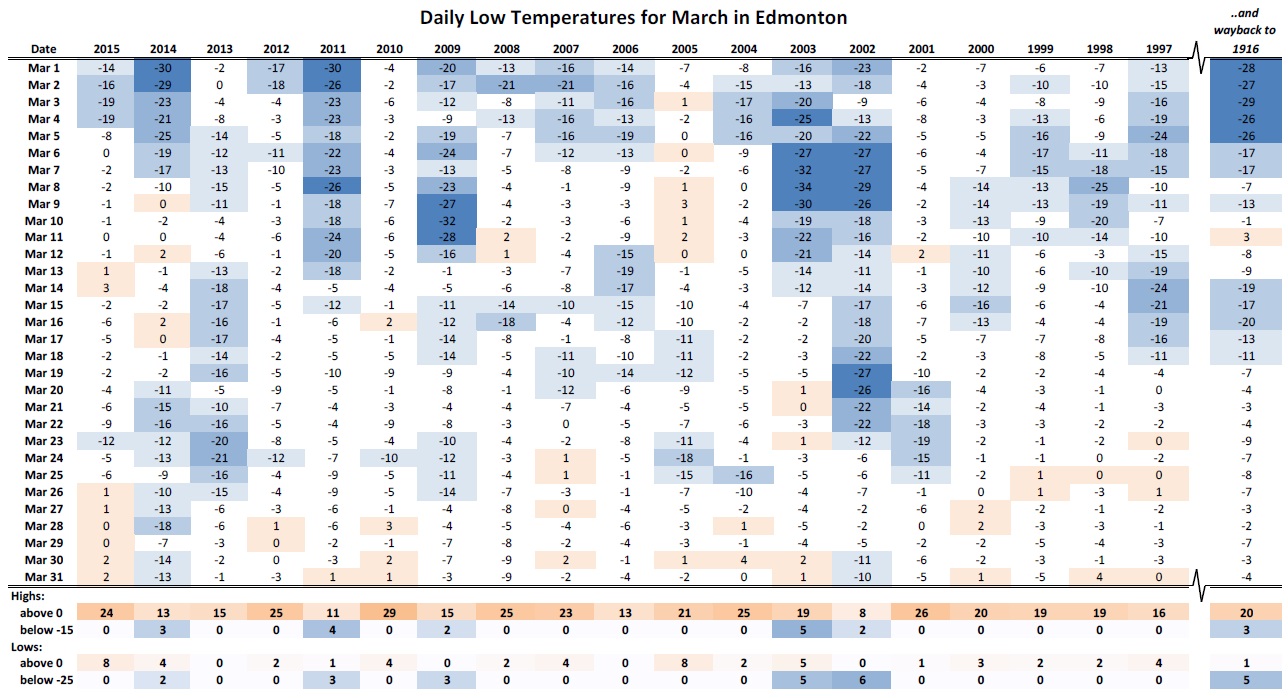
To help me get a better grasp on this variability, I've started putting these together:
This data is also all over the place, but seeing the bigger picture helps me psych myself up for the next month of winter commuting. Because what I really want to know is how many days will probably be warm, and how many will probably be cold, and what's the worst-case scenario for the month, or the best?
And it seems that for most years March will be mild. But every 5 years or so there is a week or two of real nastiness. That's more helpful than a 30 year average.
By the time March rolls around winter is almost over, so I probably don't actually need much of a morale boost at this point.
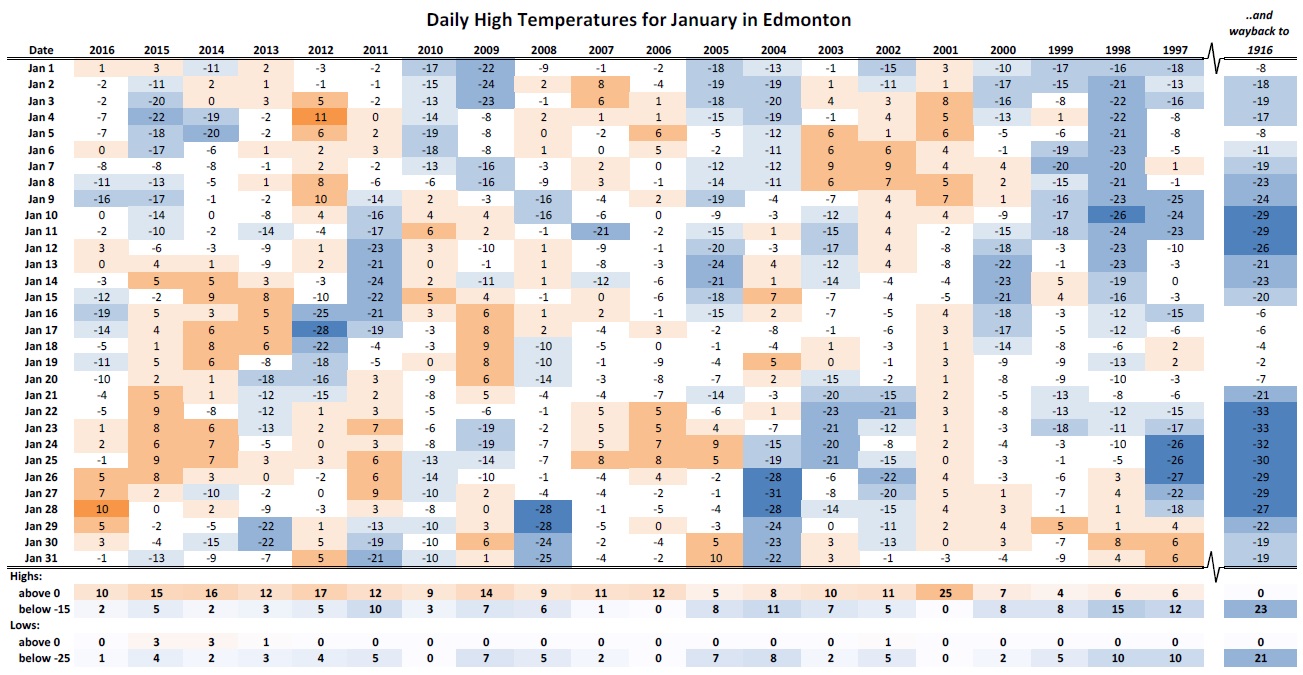
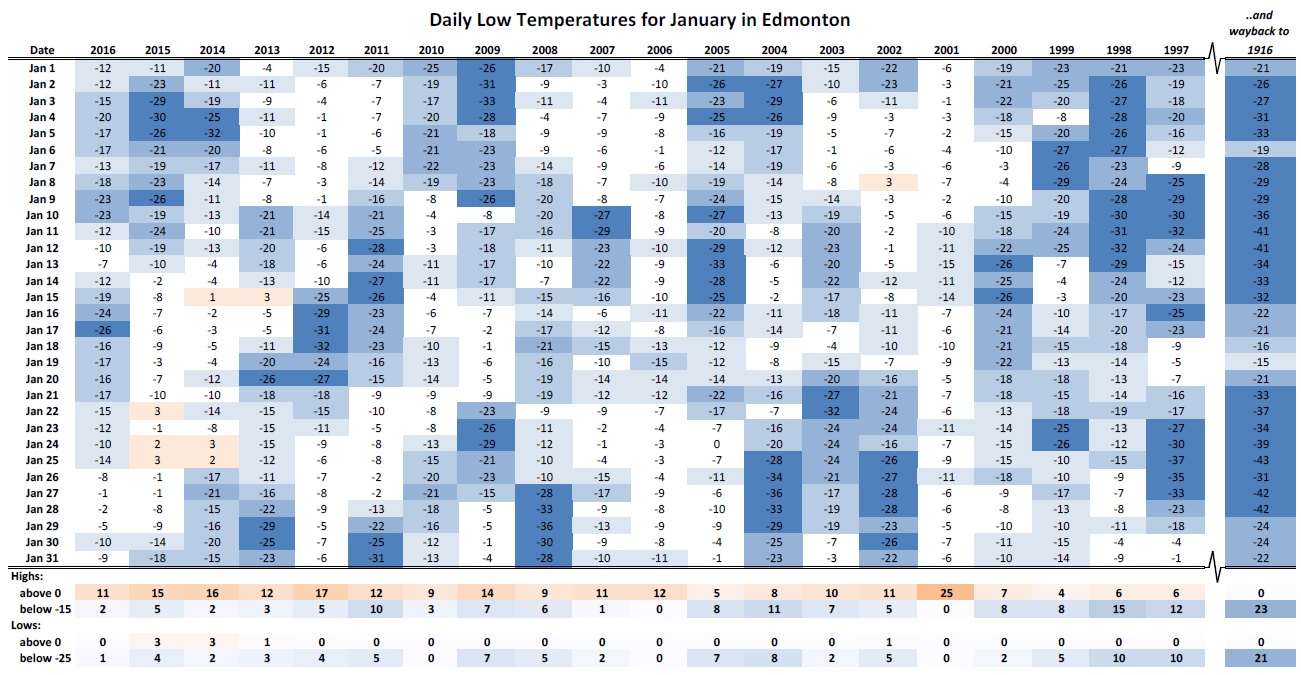
But even during the darkest depths of January it's helpful:
As cold as January can often feel, in the last 20 years we have always gotten at least a week of days above (or at least very close) to freezing. And many January's are much warmer than that. It's just that there are also the occasional, weeklong, extremely painful cold-snaps to contend with.
Subscribe to:
Post Comments (Atom)

No comments:
Post a Comment