2022/12/01

November 2022 Review

It's time for our big look back at Edmonton's November 2022 weather. And after a warm summer and fall, things have taken a bit of a turn...

November 2022's average High of -2.1°C ranked as 107th warmest (or 36th coldest) since 1880. The average Low of -10.1°C was the 96th warmest (or 47th coldest). It was a below-average November, but still warmer than 2017, or 2012-2014.


High Temperatures
November started cold, got really cold, got a little warm, and then was really cold at the end. November 7-9 had our coldest Highs in the last 30 years. We end up with 12 Highs above average and 18 below.

In November we average about 18 Highs above freezing, and 2022 had 15. We also average around 8 Highs of 5°C or more, and 2022 only had 5. Sometimes November doesn't have any Highs below -5°C (like in 2021) but this year we had 9.


Low Temperatures
For November 2022's Lows the 7th-10th were the coldest that we had had in 30 years. Overall only 9 Lows were above average, compared to 21 below.

For 2016-2021 we didn't hit -20°C in November, but that 6-year streak ended with our first -20°C very early on November 9th. November only averages about 1 -20°C, and this year we had 3.


Cold Days So Far
For the past few winters we hadn't hit -20°C until December, and 2020 even held off until January 9th. So the 3 that we got this November were a little bit of a shock, but recently November 2014 & 2010 each had 5, and 2006 had 6.


November Temperatures
This compares the distribution of our November temperatures for the past few years. It got cold in 2022, but not as cold as 2014, 2013, 2011, 2010, 2006... It also didn't get very warm though, with the warmest High as 7.4°C on the 14th.


Warm & Cold Months
After as string of warm, orange bubbles going back to June, with November we finally get a blue bubble. November 2022's average High of -2.1°C was -2.5°C below the 20th century average. The average Low of -10.1°C was -1.7°C colder.


The Horserace
At the end of October 2022 ranked as Edmonton's 4th warmest year overal, but the cool November has pushed that down to the 8th spot. The Highs are the 14th warmest, and the Lows are the 7th.


Across Canada
For November across the country it was cold in Vancouver-Saskatoon, close to the 20th century average in Regina & Winnipeg, and warm further east.


Precipitation
In November we average 21mm of precipitation (rain + snow) For 2022 Blatchford & the Airport were a little above that with 27.2mm & 32.4mm respectively. Stony Plain was basically right on the average with 20mm.

November averages 9 days with precipitation. Stony Plain and the Airport were a little high with 11. Something has been wrong with Blatchford since August, because it's recording way too many days (but the amounts are small, so the totals aren't affected).

By the end of November we average around 420mm of precipitation for the year. Stony Plain has 455mm, the airport is at 419mm, and Blatchford is down at 376mm. For all of the local stations Stony Plain is the highest, and Campsie is the lowest at 320mm.


Precipitation Across Canada
This messy chart has 2022's precipitation for 11 cities. Saskatoon & Regina are at the bottom. Next Edmonton & Calgary are close at around 380mm. At the top Halifax is near 1300mm, and St. John's is close to 1600mm. Winnipeg is having a top-10 year.

For the big storms in November: - 42.8mm in St. John's on the 12th - 39.4mm in Montréal on the 11th - 35.8mm in Halifax on the 12th - 31.6mm in Vancouver on the 4th
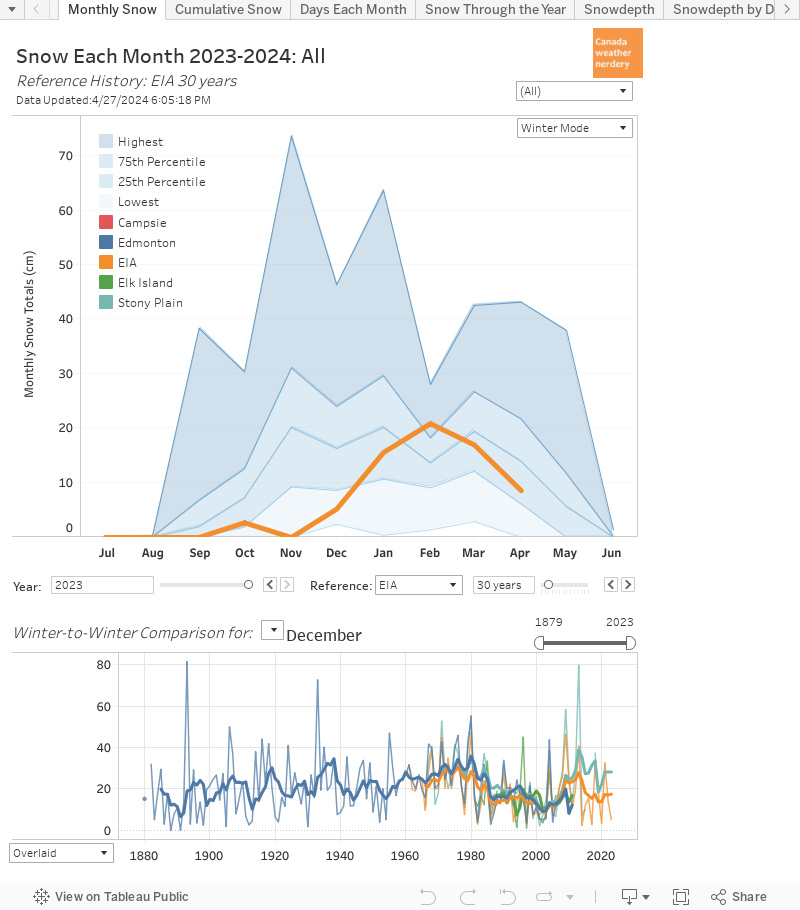


Snow
The only local station recording snowfall is the airport. In November we average around 20cm, and in 2022 we got 31.8mm. That's the 9th highest November for the airport.


First Snow
The airport's first measureable snow for the winter of 2022-2023 was on November 1st. The average date is October 11, so we were a few weeks late this year.


Snowdepth
The airport, Stony Plain, Elk Island and Campsie are all measuring snowdepth this year. At the end of November we average about 10cm of snow on the ground. The airport & Elk Island are around 15cm, and Stony Plain & Campsie are around 9cm.

This is just a comparison of how our snowdepth builds up in the early part of the winter, for the past few years. So far 2022-2023 is typical enough.


Snow Across Canada
An ugly chart again, showing who has had snowfall so far. Calgary is at the top, and then Edmonton. Then St. John's, Montréal, Toronto and Ottawa are all bunched up. We won't have snow measurements for Regina, Saskatoon or Winnipeg this year.

For the big snowstorms so far Montréal had 11.4cm on November 16th, St. John's had 11cm on the 22nd, and Calgary had 10cm back on October 22nd.

For snowdepth Edmonton is at the top, and Winnipeg just jumped up to 7cm. Everyone else is either low, or reading nothing.

It's pretty typical for Edmonton to be the champion for long-term snow. In Ottawa, Montréal and St. John's it usually doesn't start building up for another month or so.


December
In December we average about 10 days with Highs above 0°C. For the Lows, since 1990 there have been 5 Decembers which didn't hit -20°C, and about half of the time December will hit -25°C. December averages 16cm of snow.

2022/10/31

October 2022 Review

It's time for our big look back at Edmonton's October 2022 weather.

October 2022's average High of 15.5°C ranked as 5th warmest since 1880. 1944 has the record with 16.4°C.

The average Low of 3.7°C was the 1st warmest, way ahead of 2.7°C from 1974.

August, September & October all had their warmest average Lows on record in 2022, with July as #3.

For Highs August, September & October were all top-5 (with July as a less impressive #27).


High Temperatures
October's Highs were mostly well above average, with just a few cool days from the 21st-25th. There were no new records, but 6 days were the warmest in 30 years. 

We end up with 25 days above average and 6 below.

In October we average about 2 Highs of 20°C. 2022 blew that away with 12, which tied the record for October.

October also averages 2 Highs below freezing, and 2022 had none. The coldest was 4.1°C on the 24th.


Warm Days
October 2022 had 12 Highs which reached 20°C, which tied 1923 for the record. In recent years the most had been 2006 & 2003 with 6.

For the whole year 2022 had 118 Days reach 20°C. That is the 3rd most on record, behind 1897 & 1898 which both had 122. Recently 2017 reached 111, and just getting to 100 is quite a bit.


Low Temperatures
For October 2022's Lows only 4 were below average, compared to 27 above. October 10th set a new record warmest-Low at 10.4°C.

October averages about 13 Lows below 0°C, and 2022 had 5. 

October also averages 3 Lows below -5°C. 2022 had none, which also happened in 2011, 2007, 1999, 1998.


Frost-Free Days
Blatchford & Stony Plain both set new records for the latest first frost of the fall, on October 23rd.

Blatchford's old record was October 21st in 1975, and Stony Plain's was October 9th in 2020 & 1979.


Warm & Cold Months
October 2022's average High of 15.5°C ends up 4.4°C above the 20th century average. The average Low of 3.7°C was 4.1°C warmer. They're both big orange bubbles here, following a warm September & August.


The Horserace
As winter looms 2022 has moved up to Edmonton's 4th warmest year overall, and 2°C above the 20th century average.

The Highs are the 9th warmest, and the Lows are the 4th. The red line really turned upwards at the start of August, and just kept going.

2022's summer didn't really kick-in until July, but for May 1-October 31st 2022 had the warmest average Highs & Lows on record.


Across Canada
For October across the country Edmonton, Calgary & St. John's were the most above-average for Highs & Lows. Winnipeg was back to average, after finally getting a warm~ish month in September.


Precipitation
In October we average 19mm of precipitation.

October 2022 was low, following a low September & August. Blatchford had 8.8mm, the airport 4.1mm, and Stony Plain 8.4mm.

October averages 8 days with precipitation. 

Blatchford somehow recorded 18, while the other stations were down around 8. For some reason Blatchford had lots of days with precipitation for August, September & October, but that didn't affect its precipitation totals.

By the end of October we average around 400mm of precipitation for the year.

Stony Plain is High with 436mm, while the others are a little low following the below-average August, September & October. The airport has 387mm, Blatchford has 349mm.


Precipitation Across Canada
This messy chart has 2022's precipitation for 11 cities.

Saskatoon & Regina are at the bottom. Next, Edmonton & Calgary are almost tied around 350mm. At the top Halifax is near 1200mm, and St. John's is over 1400mm.

For the big storms in October: 
  • Halifax had 2 40mm+ days on the 19th & 26th. 
  • St. John's & Winnipeg had 30mm+ days on the 17th & 24th.


First Snow
We didn't get snow in October.

Blatchford doesn't record snowfall anymore, but its average first snowfall used to be around mid-October, with the airport a bit earlier. 

2014, 2016, 2017 & 2018 all had September snow, which messed-up our averages. 2021's first-snow was really late at the airport, on November 14th.

This is the recent history of snowfall at the airport. Some years do get started early, but by the time we reach November the bubbles get a lot more frequent.

And this is our snowdepth throughout the winter. We almost always make it to Halloween without "lasting" snow, but after that it's game-on.

In October we average 7cm of snow, but a lot of years get none. Most of our real-winter months from November-March average around 20cm of snow, with February a little below the others at 13cm.

For the big Canadian cities the only snow so far for the winter of 2022-2023 was Calgary (ha-ha) with 10cm on the 22nd.


November
In November we average 18 days with Highs above freezing, but we start seeing Lows of -10°C and -15°C.

We haven't hit -20°C in November since 2015, and let's not talk about the -29.8°C in 2014.

2022/10/29

Halloween 2022

Let's take a quick look back at the weather history for Halloween in Edmonton.

Recent History

In recent years the average High for Halloween is 4.8°C, and the average Low is -3.8°C.

The Highs for 2021, 2020, 2019, 2017 & 2016 were all right on average, while 2017 was a little warm at 8.3°C. Our warmest recent Halloween was 2010 with a High of 12.6°C, and 2013, 2007 & 1997 were all above 10°C.

Recent Halloweens with Highs below freezing were 2012, 2006, 2003, 1995 & 1991. 1991 was the coldest of the "recent" years with a High of -8.3°C and Low of -18.6°C, but in a second we'll take a look at the record for coldest Halloween.

For precipitation 2017 had 6.1mm, but Blatchford doesn't record whether that was snow or rain anymore. Going back to when Blatchford did record snow, we got snow on Halloween in 2003, 1999, 1994 & 1991.


Full History

The record for coldest Halloween was 1984, with a ridiculously cold High of -17.1°C and Low of -23.4°C. The 2nd-coldest Highs were only -12.2°C in 1935 & 1936. The 2nd-coldest Low is -18.6°C from 1991.

1959 has the record for Halloween precipitation, with 4.3mm of rain and 6.9cm of snow, for a combined precipitation of 11.2mm. 1882 was second with 10.2cm of snow.


Snowdepth

The bars here are the years with measurable snow depth on October 31st. (the little dots are the peak snowdepth for each winter, but those usually occur much later).

This data isn't perfect, because it doesn't start until the 1950s, Blatchford stopped collecting for a few years after 2007, and Stony Plain didn't start until the 1980s.

But with what we've got the peak time for snowy Halloweens was 2001-2006, with 4 or 5 years having snow. Outside of those years, having snow on Halloween has been pretty unusual.

This is another look at how our snowdepth builds up in the early part of the winter, and the years with darker-blue are the only ones that had snow on October 31st.


This is another look at it, but showing only the years with snow on the ground for Halloween.