2018/05/27

Edmonton's Hottest Days

On this blog we talk about Edmonton's winter days a lot. But we don't really talk about the summer that much.

Last year we did take a quick look at Edmonton's Heatwaves, and today we're going to dig a bit further into Edmonton's hottest days.

When does Edmonton get 30°C days?

This chart shows when throughout the year we have had days of 30°C or more, from 1880-2017.

The earliest in the year that we've had a 30°C was April 25th & 26th 1977, at 30.1°C and 30.3°C respectively. The only other 30°C day in April was April 29th 1939, at 31.1°C. The latest 30°C was on September 28th 1887 at 30°C, and since 1880 September has had a total of 25 days which hit 30°C.

This year we just had a 30.2°C on May 23rd 2018, and that one isn't shown in this chart. But in recent years getting a 30°C day in May has been fairly common - it also happened on May 31st 2017, May 3rd 2016,  May 6th 2013, and May 18th 2010.


But How Hot Were They?

Here is the same chart, but this time we are looking at the temperatrues as well as the dates.

Edmonton's warmest recorded day was 37.2°C on June 29th, 1937. We have also had one 36.7°C day on July 2nd, 1924, and three 35°C days in 1924 and 1933. Those were all more than 80 years ago, though.

In recent years 34°C is the warmest that we've hit: in 2015, 2008, 2006, twice in 2002, and 1998.


30°C days by Month

This chart shows the breakdown of which months get the most 30°C days.

Not surprisingly July is the clear leader, with 237 days in the last 137 years, or about 1.7 each year.

May's 47 days in 137 years would mean an average of about 0.3 days per year, but we've now had one 30°C day in each of 2016, 2017, and 2018 so we're sitting above average.


Number of Hot Days Each Year

This chart looks at how many 30°C, 32°C and 35°C days we get each year, and also includes 25°C and 28°C days for a bit more context.
  • In terms of 25°C days, 2014, 2015, 2016 and 2017 were all quite high ranging from 40 days to 52 days. And 2018 is off to an impressive start with 12 (as I write this) and it isn't even the end of May yet. That's way up from the last few years, where 2000-2013 only had 3 years with more than 40 25°C days, and there were 5 years (2000, 2004, 2005, 2010, 2011) which were down around 20 days. Looking at the 5-Year average for 25°C days right now we're at 42 days which is well above recent years, although way back in 1894-1898 the average actually hit 47 days.

  • For 28°C days right now our 5-Year average is 12 per year. That's up a bit over the last few years, because around 2013 it was down at 10 days per year. But the average has been as high as 14 days a few times: 2010, the mid-1980s, the mid-1960s, the late-1930s, etc.

  • For 30°C right now we average about 4 days each year, and that matches Edmonton's long-term average. In 2010 it was up at 6 days though, and in the late-1930s it was 8 days.

  • 32°C days in Edmonton are pretty rare, and going back to the 1880s we've averaged about 1 per year, and that's where we sit right now. Edmonton's peak period for 32°C days was the mid-1930s, with 1933 recording 5 of them and 1936 recording 6. In recent years 2002 is the big standout with 6 32°C days.

  • And as we saw in an earlier chart, all of Edmonton's 35°C days were recorded more than 80 years ago, with three in 1924, one in 1933, and one in 1937. (now is a good time to mention that I'm always a bit suspicious of the extreme readings from Edmonton's earliest 1880-1937 weather station.)

So are we seeing more hot days now than we used to? It doesn't look like it. Just in the last four years from 2014-2017 we've seen almost twice as many 25°C days as we did 5 years ago, and that puts us at the high end of Edmonton's range. But for the really hot days - 28°C, 30°C, 32°C - we're either at Edmonton's long-term average or a little below.

I've said many time before that Edmonton isn't necessarily getting warmer, but it is getting less-cold. And so this Hot-Days chart is an interesting comparison to the Cold-Days chart where we've seen the number of -20°C and -30°C days drops substantially since 1880. And even though our hottest days haven't changed much, our average temperature each year has been steadily increasing.


Hottest Day of Each Year

As we experience scorching May temperatures you might wonder: is that all there is?

This chart shows the date of the warmest day of each year (on the right axis), as well as the corresponding temperature (on the left axis). I normally try to avoid charts with 2 axes, but in this case I think it's useful to graph the temperature and the corresponding date together.

The earliest hottest-day was just two years ago on May 3rd 2016 at 30°C. And that's where the "Is that all there is?" pessimism comes from, because when we get a really warm May you have to wonder if this is as good as it gets for the year?

But then last year in 2017 we had a pretty late hottest-day on September 7th at 32.2°C. The very latest was on September 25th in both 1952 and 2011, and recently 2009 also peaked really late on September 23rd.

Of the 137 years here there were 15 which didn't have any days that hit 30°C: 1880, 1881, 1893, 1907, 1914, 1916, 1943, 1944, 1947, 1953, 1962, 1989, 1999, 2000, and 2005. The coldest hottest-day was technically 1881 at 26.1°C, although it's missing data for July and August so that's not correct. The 2nd coldest was 1916 at 27.2°C, and it isn't missing any data so we'll trust that one.. In recent years 1999, 2000 and 2005 didn't have any 30°C days, but their hottest-days were 28.8°C, 29.1°C and 29.6°C respectively.

Last week when we looked at Climate Hardiness Zones we saw that Edmonton's coldest temperature each year has been increasing fairly steadily. This chart shows how Edmonton's hottest temperatures each year have changed, and it isn't so dramatic. Right now our average hottest day is 32°C, and that's up from 31°C a century ago, but it's down a bit from 34°C in the suspiciously-hot 1930s.

The average date of the hottest-day (which is a bit of a weird concept) has bounced around between the beginning and end of July.

The animated version of this chart is nice for following the connection between temperature and date, but it's also a little crazy, so here's a non-animated version:


And that brings us to the end of our look at Edmonton's Hottest Days.

2018/05/22

Climate Hardiness Zones

In the last few weeks we've taken a trip into the garden with:
Today we're going to look at climate hardiness zones which are a guide to which plants can be grown in which areas. Canada and the United States use very different approaches to calculating hardiness zones, and we'll be looking at both.

Most of the background information today is sourced off of wikipedia; the United States government site planthardiness.ars.usda.gov; and the Canadian government site www.planthardiness.gc.ca. I could certainly never claim to be an expert on this subject.

USDA Minimum Temperatures Zones

In 1960 the United States Department of Agriculture (USDA) apparently (according to wikipedia) created the first modern horticultural zones, which are geographically defined areas in which a specific category of plant life is capable of growing.

Here is a very pretty map which is the result of that:
Source: wikipedia

The USDA uses one simple trick to determine these zones: the minimum temperature experienced each winter. And so here are the minimum temperatures each year for the Blatchford weather station in Edmonton:


Because the USDA Zones are American the data for Canadian locations is a little bit spotty. The Canadian government site has interactive maps for the USDA zones for 1961-1990 and 1981-2010, and both of those appear to show Edmonton as 3b for both timeframes. But the big, colourful map we just looked at shows Edmonton as 3a? So for the "official" zones in this chart we've chosen to use 3a from 1961-1990 and 3b from 1981-2010, and those sections are highlighted in orange.

The hardiness zones are relatively recent, and so we don't know what Edmonton's "official" zone would have been 100 years ago. But up to 1950 we fairly frequently had lows down into the 1b and 2a range. Since 1950 we've only dropped to 2b once, with a minimum of -41.1°C in 1972. And since 1972 we've only dropped into 3a once, with a minimum of -37.8°C in 1996.

Recently our official zone has been 3b, and since then we've only had 5 years that got that cold: the previously mentioned 1996, as well as 1997, 2004, 2008 & 2009. The other 17 years have been a mix of 4a, 4b, and 5a, with 2001 as an outlier up at 5b. And going a bit further back, 1987 was a major outlier up at 6b.

The dotted line in this chart shows the 30-year average yearly minimum temperature, and in the last century it has increased by 10°C from -41°C to -31°C. But, as we've seen before (most recently in Frost-free Days: Part 2)- the Blatchford station is often milder than the rest of the region. These climate zone maps are very broad, so how well does it match some rural stations?

USDA Zones - Outlying Areas

This chart has the yearly minimum temperatures for Blatchford, for my 3 favourite rural stations Calmar, Campsie & Sion, and for the Edmonton International Airport.

There is undoubtedly too much going on in this chart, but I didn't want to spend a lot of time separating it out, so lets just focus on the important parts:
  • We just saw that since about 1950 Blatchford has pretty solidly been in the 3b and 4a range. And its 30-year average minimum yearly temperature increased -41°C to -31°C from 1910 to today.
  • Calmar in red is mostly in the 2b or 3a range, but in the 1970s and late-1990s it had some years that dropped into the 2a and even 1b range. It's 30-year average increased from -43°C to -38°C from 1945 through 2007.
  • The Edmonton International in orange is right next to Calmar. It is also mostly in the 2b or 3a range, and also had some much colder years. As recently as 2009 it dropped into the 1b range with a low of -46.1°C. It has less data than the other stations here, and its 30-year average has only increased from -39°C to -38°C from 1990 through 2017.
  • Campsie in green is the furthest of the stations at 100km northwest of Edmonton, and it's also the coldest. From 2000 to the end of the data in 2013 it had 3 years in the 1b range with lows below -45°C: 2004, 2008 and 2009. More typically it's in the 2a and 2b range. From 1940 through 2013 it's 30-year average increased from -45°C to -41°C.
  • Sion in purple is fairly similar to Blatchford, sitting mostly around 3a and 3b. A -41°C in 1996 dropped it into the 2b range though. From 1940 through 2004 it's 30-year average increased from -43°C to -35°C.

The climate zone map that we looked at above has broken North America up into very broad areas. But here we've see that even within a small area like the Edmonton region there is significant variation. The "official" USDA zone of 3b is probably a pretty good match for Blatchford, although it might be a bit on the conservative side of things. But at the International Airport 3b is maybe a bit optimistic, because since 2000 there has been 1 year in the 2b range, 2 in 2a, and 1 in 1b.


USDA Zones - Calgary, Winnipeg and Montreal

Here we're taking another look at the USDA Minimum temperatures zones, by adding Calgary, Winnipeg and Montreal.
  • Calgary's official USDA zone is 4a, although in 1997 it dropped to -39.7°C which is in the 3a range. Over the last century its 30-year average yearly minimum temperature increased from -37°C to -31°C, compared to Edmonton's shift from -41°C to -31°C. So right now the averages are close, although Edmonton has had a few more recent 3b years than Calgary.
  • Winnipeg's USDA zone is 3b, which is the same as Edmonton. It has had a few recent years - 1996, 2004, 2007 - down in the 2b range. Its 30-year average has increased from -41°C (where Edmonton started) to -36°C compared to Edmonton's current -31°C.
  • Montreal's USDA zone is 4b, although its minimum temperatures are more often in the 5a or 5b range. Its coldest recent year was 1994 which dropped to -31.8°C right at the bottom of the 4b range. Its 30-year average has increased a bit from -29°C to -26°C.

One thing to keep in mind here is the stations which are being used: Edmonton's is downtown~ish; Calgary's is on the edge of the city; Winnipeg's is on the edge of the city~ish; and Montreal's is the furthest from downtown, but it is surrounded by city, and it is near the St. Lawrence.

We saw that temperatures within the Edmonton region vary greatly, and that might explain why Edmonton and Winnipeg officially share the same 3b zone, but the data here makes them look quite different. And also why Calgary is a zone higher than Edmonton, but the data here looks quite similar.

One other thing to remember is that this chart just shows the single coldest day each year. And so while those very-coldest days have been getting less cold, this isn't necessarily indicative of overall warming. Overall warming was something we looked at a bit recently in the Winter City Showdown, most notably in this chart.


Canadian Plant Hardiness Zones

While looking at the USDA zone data you might wonder if the coldest temperature each year really provides enough information to determine whether a plant will survive in a location? The Government of Canada apparently doesn't think so, and so it uses a much more elaborate calculation.

It's easiest to let them explain it:
Source: www.planthardiness.gc.ca

The short version of all of that is that the Canadian zones use a score based on 7 different factors - cold winter temperatures, frost-free days, summer rainfall, hot summer temperatures, January rainfall, snowdepth, wind gusts - and that score corresponds to a zone. Here is the result:


The Canadian zones are calculated very differently from the USDA zones, and for our example cities there are some similarities and some differences:
  • Edmonton: USDA 3b - Canada 4a
  • Calgary: USDA 4a - Canada 4a
  • Winnipeg: USDA 3b - Canada 4a
  • Montreal: USDA 4b - Canada 6a

We'll dig into this a bit starting with Edmonton:


This chart shows the Canadian Hardiness Index calculated each year for Edmonton. The official zones are averaged for 1961-1990 and 1981-2010, and the yearly line nicely crosses through the middle of them.

The numbers behind this chart are not straightforward, so lets take a look at where the scores come from, referring back to the big, 7-part formula that we saw earlier:


From 1910 through 2010 the calculated index increased from 28 (which would be zone 2b) to 44 (4b), and this table shows how much each of the 7 factors contribute to that score. We don't want to get too hung up on the individual numbers (like the Mystery Coefficient of -67.62) because those are just part of the formula that Oellet and Sherk developed. What's more interesting is where the score come from, and what has changed.

Edmonton's score has increased by 16 points, and that is almost all due to 2 factors: the Cold Winter Temperatures (gained 10 points), and the Frost-Free Period (gained 6 points). The other factors are flat, or they don't have much of an impact. And for Maximum Snowdepth and Wind Gusts the data doesn't go all the way back to 2010, so for those I've used modern data, but either way they don't have a huge impact on the total.

With all of that said, the chart seems to be a pretty good match for the official numbers. The yearly line passes right through the middle of the 1961-1990 and 1981-2010 ranges, and it seems like Blatchford is on its way up into Zone 4b.

Lets take a look at a few other cities:

Canada Zones - Calgary, Winnipeg and Montreal

This chart shows the calculated Hardiness Index for Blatchford and the International Airport in Edmonton, as well as for the Calgary, Winnipeg and Montreal airports.

  • For Blatchford we've seen that this calculation is a pretty nice match for Edmonton's official zone of 4a, but for the Edmonton International (in orange) it isn't even close. The International's line sits way down in the 3a range. The official zone for Leduc is 3b for both 1961-1990 and 1981-2010, and even compared to that the calculation is still low. 

  • For Calgary the calculation is a bit below the official 3b zone for 1961-1990, but for 1980-2010 it's into the official 4a range.

    Calgary's yearly line actually drops from 1945 to 1980, and the two factors which cause that are the Monthly Mean of the Daily Minimum Temperatures of the Coldest Month and the Monthly Mean of the Daily Maximum Temperatures of the Warmest Month. The other 5 factors - snowdepth, rain, etc - stayed relatively stable.


    This chart shows the cooling of Calgary's warmest and coolest months (which isn't necessarily reflective of an overall cooling - this chart covers that), which is something that we didn't see in Edmonton. In the past I've mentioned that Calgary's weather station probably moved to its current location at the airport sometime around the 1950s, and this might be evidence of that? That's just a theory though.

  • For Winnipeg the 1961-1990 zone of 3a is close to the calculation. But for 1980-2010 Winnipeg's official zone took two steps up to 4a, and the calculated values do not move along with it. The numbers for the Winnipeg International are about the same as the Edmonton International, down in zone 3a.

  • And for Montreal the calculated numbers are reasonably close to the official zones. For 1961-1990 the calculation is a little bit above the official score, and for 1980-2010 it's a bit behind. Like we see with Calgary, Montreal's calculated score also dropped from about 1940 to 1985. For Montreal the two factors which caused this drop were Monthly Mean of the Daily Minimum Temperatures of the Coldest Month and the Frost-Free Days (which we saw here).

    It's also worth noting that for Edmonton, Calgary and Winnipeg the official zones are fairly close for both the USDA and Canada calculations. But Montreal jumps from 4b for USDA all the way up to 6a using the Canadian zones.

Just a few finale caveats for this chart before we wrap up for the day:
  • The Canadian calculation needs data for all 7-factors to work, but snowdepth records only go back to about the 1950s, and Wind Gust data is incredibly spotty. So just to get any result means making some approximations and substituting in a bit of modern data.

  • When the numbers don't add up - as with the Edmonton International and Winnipeg - it's tough to identify which of the 7 factors is causing the discrepancy. I've checked and double-checked the data for those stations, and I can't get anything close to the official 1981-2010 Zones.

    And for Blatchford, Calgary and Montreal, even though the calculations look pretty good I can't be sure if that's because it is actually correct, or if the 7 factors just combined in a way that doesn't look spectacularly wrong.

  • The formula for these climate zones was introduced in 1967, and it's possible that it was never intended to be used with earlier data? Regressions can be finicky, and if Oellet and Sherk didn't originally include 1880-1940 then the coefficients might not be calibrated for those years.

  • And I'm also not sure that this formula is really meant to be used with data for individual stations. The government has created zone maps for each of the individual factors - X1, X2, X3, X4, X5, X6 & X7 - and using those would smooth out the discrepancies between Blatchford and the International. But it's still interesting to see how the data from the individual stations compares to the official results.

Summary

Today we looked at the 2 main methods of determining Climate Zones in North America. The USDA zones are very simple to calculate because they just use the coldest temperature each year, while the Canadian approach is much more complicated and uses 7 different factors.

Using both types of zones we saw that Edmonton Blatchford has been increasing: by 1 or 2 zones in the last 50 years, and by 2 or 3 in the last century. But we also saw that the Edmonton International is 1 or 2 zones below Blatchford. So if you live near Blatchford the official zones are probably a little conservative, which should give you some room for gardening experiments. But if you're closer to the International Airport (which is really cold) the zones might be giving you a false sense of security - many years will be fine, but occasionally a -46.1°C will come along like in 2009.

With today's post, as well as Frost-Free Days Part 1 & Part 2 we now reach the end of our trip into the world of gardening. It's been fun, but these have all gone really long, and it will be nice to get back to talking about plain, old, boring, weather again.

2018/05/21

Victoria Day 2018

And so we reach the end of a really lovely Victoria Day weekend.


This actually makes 2 very warm Victoria Days in a row, because 2017 was very similar to this year. The last time that we had 3 fairly-warm Victoria Days in a row was back in 1998, 1999 and 2000.

Depending on where the official numbers for Monday come in our average temperature for the weekend will be just about the same as 2017, and a bit below 2008 which was the warmest recent Victoria Day.

All four days this weekend hit 20°C, and that technically didn't happen last year because the Friday was only 19.9°C. The only other years here that did have all four days at 20°C were 2013 and 2008.


We didn't get any rain this year or last year, and so here we're just reusing the precipitation chart from the exceptionally rainy Victoria Day 2016.

When we had first looked at Victoria Day in 2016 I'd said:

  • It's almost never above 25°C (4 times since 1995, including 2017)
  • It's almost never below 0°C
  • It's above 20°C less than half of the time
  • 75% of the time there's at least one genuinely rainy day, and 90% of the time there's at least a little rain.

In 2018 we might have one day which breaks 25°C (it depends on the official numbers for Monday), we've now had 2 years that were basically all above 20°C, and also two years with no notable rain.So fingers-crossed for 2019.

2018/05/07

Frost-Free Days: Part 2 - versus Round

A few weeks ago in Frost-Free Days: Part 1 we looked at the length of the frost-free season in Edmonton: from the last frost each spring through the first frost each fall. In Part 1 we used data from the Blatchford weather station near downtown Edmonton, and in Part 2 we'll be comparing that to some other stations.

Today will be another marathon, but I don't think that we'll be coming back to this topic again anytime soon, so we might as well get it right the first time.

We're going to start with a quick review:

Previously, in Edmonton weather nerdery...

In Part 1 we saw that Edmonton's frost-free season is currently more than a month longer than it was a century ago. More specifically from about 1940 through 1980 the average date of the last spring frost moved from the end of May to May 7th, and the average first fall frost moved from the start of September to September 24th. Since 1980 though, things have been pretty stable.

The results from Part 1 raise a few questions that we're going to try to dig into today:
  • how does Edmonton's frost-free season compare to other areas?
  • was the dramatic shift during the 1940s-1980s just because of Edmonton's growth as a city?
  • what was going on from 1975-1981? There was a string of 7 straight years with unusually long frost-free seasons.
  • why did things level off after 1980?

I've read ahead and I know that (spoilers) we aren't going to find all of the answers today. But these are still useful questions to keep in mind as we work through the comparisons.

One other thing to note in the above chart is the lines labelled "25% Chance" and "10% Chance." Frost-free days are typically tracked using a 30-year average, but that average is just the halfway point - some years will be early and some will be late. In Part 1 we added the "25% Chance" and "10% Chance" lines to indicate the likelihood of late spring frosts or early fall frosts.

For the location comparisons today we won't be worrying about the probabilities, and will just focus on the 30-Year average. That's just to keep things simple, but for all of these charts today it's good to remember that using a 10% probability of frost would shorten the season by about 2 weeks at both the spring and fall ends.


Calmar, Campsie & Sion

One of the earliest posts on this blog was Rural Alberta & the Heat Island Effect where we compared the change in Edmonton's winter temperatures to the changes at some nearby, rural stations:  Edmonton is currently warmer than its surroundings; but that was also true a century ago; and over the last century the surrounding stations have warmed up by about as much as Edmonton.

Calmar, Campsie and Sion might seem like random location choices, but they were selected because they each had long, unbroken sets of data. Environment Canada has a lot of Alberta weather stations, but many of them only have 5, 10, or 20 years of data. Calmar, Campsie and Sion have 87 years of overlapping data from 1915 through 2003 which allows us make long-term comparisons.


Here we have the 30-Year average dates for the first and last frosts at the Calmar, Campsie and Sion stations.

For the years which we are looking at Edmonton's frost-free season has always been longer than for the other stations. And while Edmonton's season has gotten longer over the years, so have the other stations'. In Part 1 we saw that on-average Edmonton has gained 20 more frost-free days in the spring and 18 in the fall, and here we see:
  • Calmar gained 22 days in the spring and 16 in the fall.
  • Campsie gained 9 days in the spring and 18 in the fall.
  • Sion gained 23 days in the spring and 18 in the fall.


This is another way of looking at how the total length of the frost-free season from spring to fall has changed for Edmonton, Calmar, Campsie and Sion.
  • Over the last century Edmonton's frost-free season increased by 38 days, with almost all of that occurring between 1940-1980.
  • Calmar's season also increased by 38 days, and like Edmonton its line starts to flatten out around 1980.
  • Campsie only increased by 25 days, but that continued through to the late 1990's.
  • Sion increased by a whopping 61 days, and that was also fairly continuous through to the early 2000's. That is skewed a bit by some very short (~20 day) seasons, which drag down the average early on.

Going back to our questions from earlier:

Was the dramatic shift during the 1940s-1980s just because of Edmonton's growth as a city? 
  • It doesn't look like it, with Calmar experiencing a very similar change, and Sion seeing an even larger increase.
What was going on from 1975-1981?
  • In these charts the jagged lines show the yearly data for these stations, and both Calmar and Sion also had some long seasons during those years. Whatever was going on, it wasn't just Blatchford.
So that's all good information, because now we know that the increased number of frost-free days that we saw in Part 1 wasn't just because heat island effect or other activity around Blatchford.


The International Airport, Fort Saskatchewan & Stony Plain

Calmar, Campsie and Sion are good comparisons because they have almost a century of data, but they're also a little obscure. In this chart we're looking at some better known locations, with the Edmonton International Airport, Fort Saskatchewan, and Stony Plain. For these stations the data starts between 1955-1965 and continues to today.

Looking at the 30-Year averages we see:
  • the International Airport's frost-free season is about a month shorter than Blatchford's. Its last spring frost is 16 days after Blatchford's, and its first fall frost is 14 days before. And those average dates haven't changed much since 1990
  • Fort Saskatchewan's last spring frost is 14 days after Blatchford's, and its first fall frost is 10 days before. It's spring average hasn't changed much, but its fall frost date has moved from September 8th in 1990 to September 14 today.
  • Stony Plain's season is quite close to Blatchford, with its spring frost 5 days after Blatchford's, and its fall frost 4 days before. Those also haven't changed much since the 1990s.

It shouldn't be any surprise that Edmonton has a longer frost-free season than the outlying areas. But as we just saw with Calmar, Campsie and Sion the outlying areas changed by about as much as Edmonton. If more data were available for the International Airport, Fort Saskatchewan, and Stony Plain we might see similar changes there as well.

Environment Canada has a few more nearby weather stations, so lets expand this to include all of them:


Many of these stations only have a few years of data, and so for this chart the timeframe has been reduced to show 1980 to today. The dashed lines indicate stations which don't have enough data to calculate a 30-year average.

For stations in the Edmonton region, the average frost-free season from longest to shortest is:
  • Blatchford: 140 days - May 7 to September 24
  • Stony Plain: 131 days - May 12 to September 20
  • U of A: 126 days - May 15 to September 18
  • Namao: 118 days - May 19 to September 14
  • Fort Saskatchewan: 116 days - May 21 to September 14
  • Edmonton International Airport: 110 days - May 23 to September 10
  • Woodbend (near the Devonian Botanical Gardens): 104 days - May 29 to September 10

There is a difference of a month from Blatchford at 140 days and Stony Plain at 131, down to the International Airport at 110 and Woodbend at 104. And just between Blatchford and the station at the Univeristy of Alberta there is a two week difference.

And as mentioned earlier, these are just the average dates. If we apply the safety factor for 10% probability of frost that shortens all of these seasons by about a month.
And now is a good time to warn everyone that these calculations are not a perfect match for the dates published by Alberta Agriculture & Forestry. The dates from the Alberta Government were last revised in 1998, and they are generally close to what we're seeing today, but there have been some small shifts.
So now we have a pretty good sense of how things work around Edmonton. But what about our favourite neighbour?


The Calgary Region 

This chart shows the frost-free season for three of Calgary's Environment Canada weather stations: the International Airport which is about 9km north of their downtown; Canada Olympic Park 12km northwest of downtown; and Springbank Airport 23km northwest of downtown. The records for their International Airport go back to 1885, while the other two stations start in the 1980s and 1990s.

The main point of interest here is Calgary's International Airport which is in red, so lets start there:
  • A century ago Edmonton had a longer frost-free season than Calgary, by about 10 days. The difference now is 17 days.
  • Calgary's last spring frost has moved by 13 days compared to Edmonton's 20. And Calgary's first fall frost has moved by 17 days compared to Edmonton's 18.
  • With Edmonton we've seen that the change of the frost-free season occurred mostly between 1940-1980, but Calgary's change was much more consistent - starting in 1915 and continuing to today.
  • Because of those different patterns, the average frost-free seasons in Edmonton and Calgary briefly lined up in about 1930 and then again in 1945.
(One caveat with the Calgary data is that I believe that at some point the station moved from a more central location to its current location. Environment Canada is not clear on this, but it was possibly as early as WWII, or maybe in the 1950s? Nothing really jumps out of the data.)

Looking at Calgary's outlying stations, the average length of the frost-free season at Canada Olympic Park is the same as at their airport: Canada Olympic Park's final fall frost is 2 days later than the airport, but its first spring frost is also 2 days later.

When you travel 11km further down the highway to Springbank things are very different. Its average season is 39 days shorter than the Calgary International. That is a big change in a relatively small distance, and it is larger than anything that we saw in the Edmonton region.

We've looked at Edmonton, and we've looked at Calgary, and if you are a regular follower of this blog you might be able to guess what comes next:


Edmonton, Calgary, Winnipeg & Montreal

Here we have the frost-free seasons for Edmonton-Blatchford, the Calgary International Airport, the Winnipeg International Airport, and Montreal.

To recap what we've seen so far:
  • Edmonton has had a pretty dramatic increase in the length of the frost-free season.
  • That increase wasn't just limited to the city of Edmonton, but it affected the outlying areas as well.
  • Calgary also saw a large increase, but it wasn't quite as large as Edmonton, and it followed a different pattern.
What about Winnipeg and Montreal?

For Winnipeg, a century ago its frost-free season was longer than Edmonton's or Calgary's. And since then Winnipeg's season has gotten a bit longer - on both the spring and fall ends - but not by nearly as much as the Alberta cities.

A century ago Montreal started with a much longer frost-free season than any of the prairie cities - with the last spring frost in late April and the first fall frost well into October. But then over the last 100 years it didn't change much - it actually shortened a bit in the 1960s and 1970s before increasing again recently. For Montreal we've done several previous comparisons in the past - herehere and here - and I think it's fair to say that the weather in Edmonton and Montreal don't have a lot in common.


This chart shows how the total length of the frost-free season has changed for these cities. There is a lot of information in the animated version of this chart, but the main thing to focus on is the solid lines for the 30-Year averages.
  • Edmonton's average frost-free season lengthened by 38 days, but that mostly occurred between 1940 and 1980. 
  • Calgary gained 32 days, spread fairly evenly across the years.
  • Winnipeg gained 17 days, a lot of which actually occurred between 1910 and 1950.
  • Montreal is off on its own, losing frost-free days and then regaining them, for an average of 1 additional frost-free day over the last century.

A century ago Winnipeg had a longer average frost-free season than Edmonton or Calgary - 4 days more than Edmonton and 15 more than Calgary. But because it has remained relatively flat compared to the Alberta cities, Calgary is now tied with Winnipeg, and Edmonton's season is 17 days longer.

And Montreal used to have a huge gap over the prairie cities - from 64 more days than Winnipeg to 79 more than Calgary. But now that gap has shrunk to 31 days more than Edmonton, and 48 more than Calgary or Winnipeg.

One thing to keep in mind here is the stations which are being used: Edmonton's is downtown~ish; Calgary's is on the edge of the city; Winnipeg's is on the edge of the city~ish; and Montreal's is the furthest from downtown, but it is surrounded by city, and it is near the St. Lawrence. So the absolute numbers that we're seeing here will vary throughout these regions, but as we saw with Blatchford, Calmar and Sion, theoretically the long-term trends will be similar throughout each region?

It's all a bit weird, though: Winnipeg goes up while Edmonton goes down and Montreal is level; then Montreal goes down while Edmonton goes up and Winnipeg is level; and then Edmonton is level while Montreal and Calgary go up. We can speculate about the cause of these differences -  proximity to the ocean, proximity to the mountains, elevation, etc. - but there doesn't seem to be much of a common pattern for these cities.


Summary

We started today with 4 questions, so now lets see what's we've learned:

How does Edmonton's frost-free season compare to other areas?
  • Blatchford's frost-free season is longer than any of the outlying stations. A station like Stony Plain is 9 days shorter than Blatchford, while the International Airport is a month shorter.
  • Blatchford's frost-free season is 2 weeks longer than the Calgary or Winnipeg airports, and its a month shorter than Montreal. But obviously that will vary depending on where you are in the Edmonton region, or in the other regions.

Was the dramatic shift during the 1940s-1980s just because of Edmonton's growth as a city?

I feel like we can say that the answer to this one is "no."
  • We saw that the rural stations in Calmar, Campsie and Sion also had large increases in their frost-free seasons during this time period.
  • We saw that other big cities - which also would have seen development during this timeframe - didn't follow Edmonton's pattern.
Whatever was going affected Edmonton's urban and rural areas, while not affecting the other cities in the same way. So this one is a mystery, but it's not simply due to the urban heat island effect.


What was going on from 1975-1981?

From 1975-1981 Blatchford had a string of 7 straight years with unusually long frost-free seasons. Those long seasons - and particularly the late fall frosts - also occurred at Calmar, Sion, the International Airport, and Stony Plain. This is another mystery, but it also seems to have affected both the urban and rural regions around Edmonton.


Why did things level off after 1980?

Part of the reason that the average length of our frost-free season leveled off after 1980 is just math, and it's related to those abnormally long seasons in 1975-1981.

With this chart we are pretending that those 7 years didn't exist, and the green line shows what our 30-year average would have hypothetically looked like without them. We're not saying that 1975-1981 didn't exist, or that they were errors, because several of the neighbouring stations had long seasons too. But these seasons were so unusually long that they boosted Blatchford's average upwards by almost 10 days. And because we're using a 30-year average those seasons hang around in the calculation until 2010.

When we look at the orange line for the 30-Year average it dips during 2005-2010, but that is really just a reflection of when those seasons are no longer included in the calculation. If we pretend that 1975-1981 didn't exist and use the green line instead, then from about 1995 onwards we see a steady increase. In particular, from 1990-2017 the slope of the Hypothetical Edmonton line is a really close match to Calgary's

So this is all just fun-with-numbers, but the point is that 1975-1981 were very unusual - they had never happened before, and they haven't happened since. From the original orange line we might assume that Edmonton's frost-free season has stopped changing over the last 40 years, but 1975-1981 heavily skew the average. Without their influence it looks like we've probably still been seeing a slow and steady increase of about 8 days since 1995.

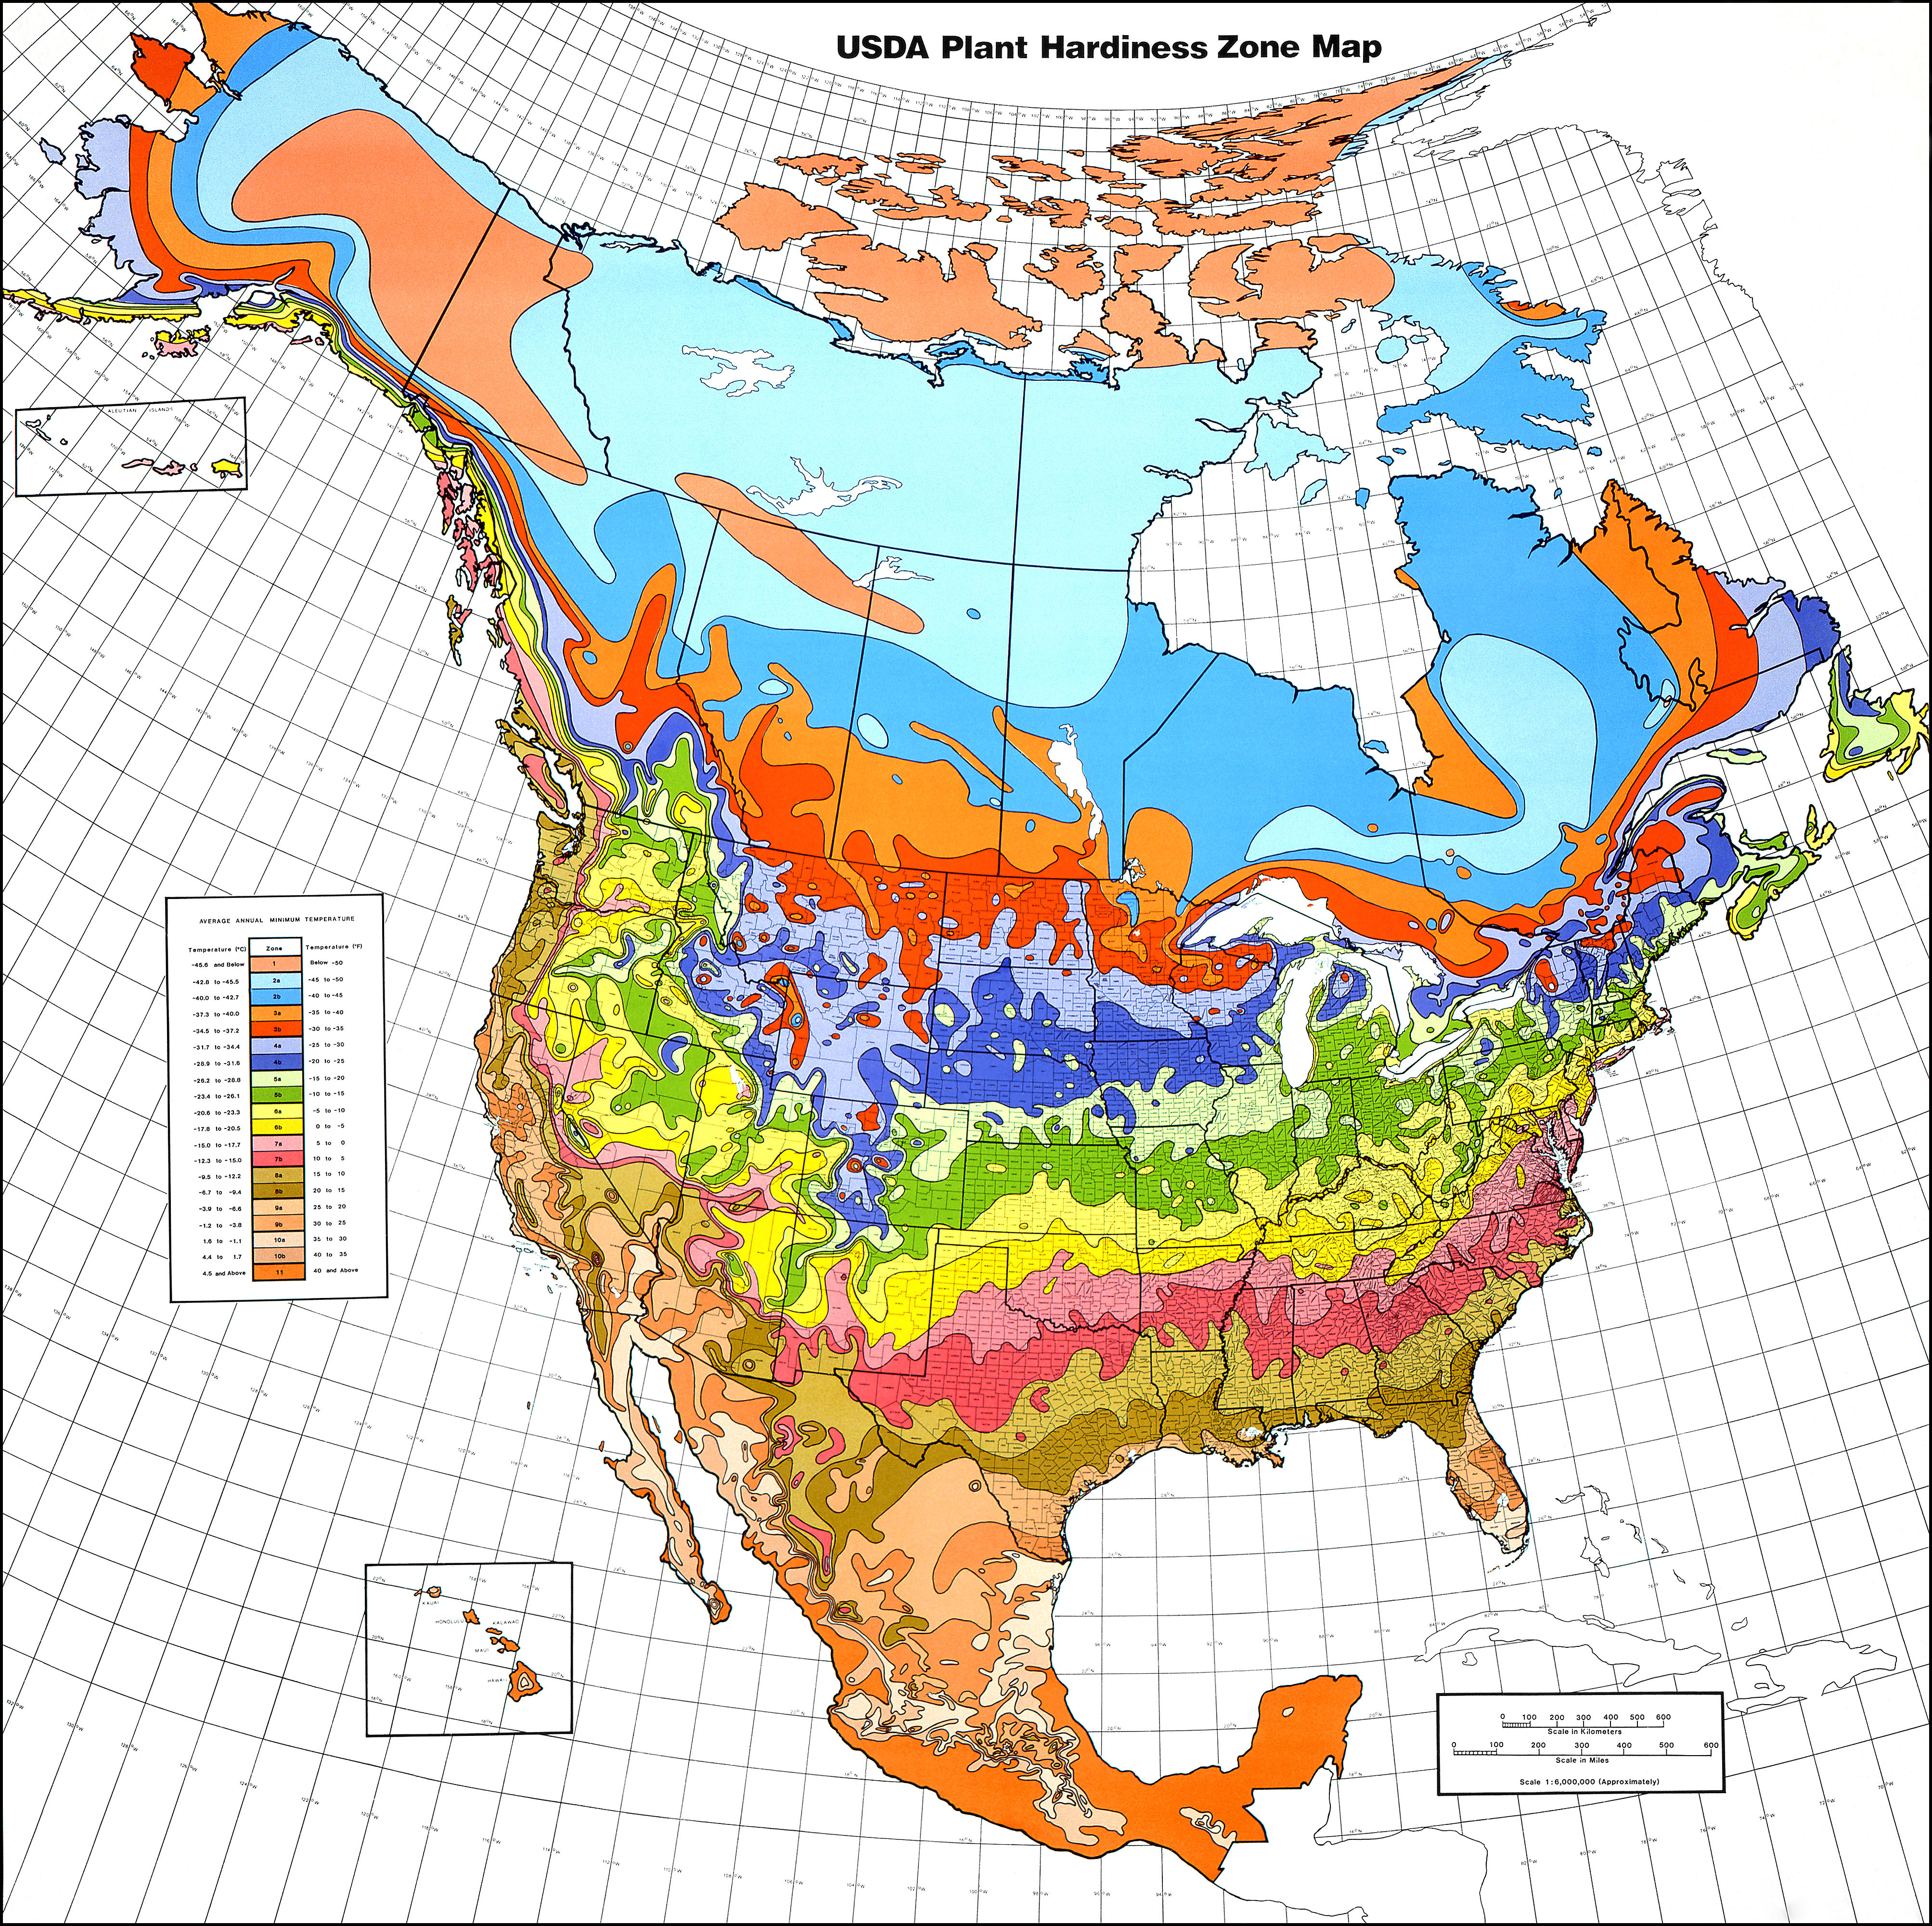
And that brings us to the end of Part 2. There was a tonne of information today, but I feel like we've now pretty much exhausted the topic of frost-free days. In a few weeks we'll be back with Part 3 of our series on gardening, where we'll look at the confusing world of climate hardiness zones.