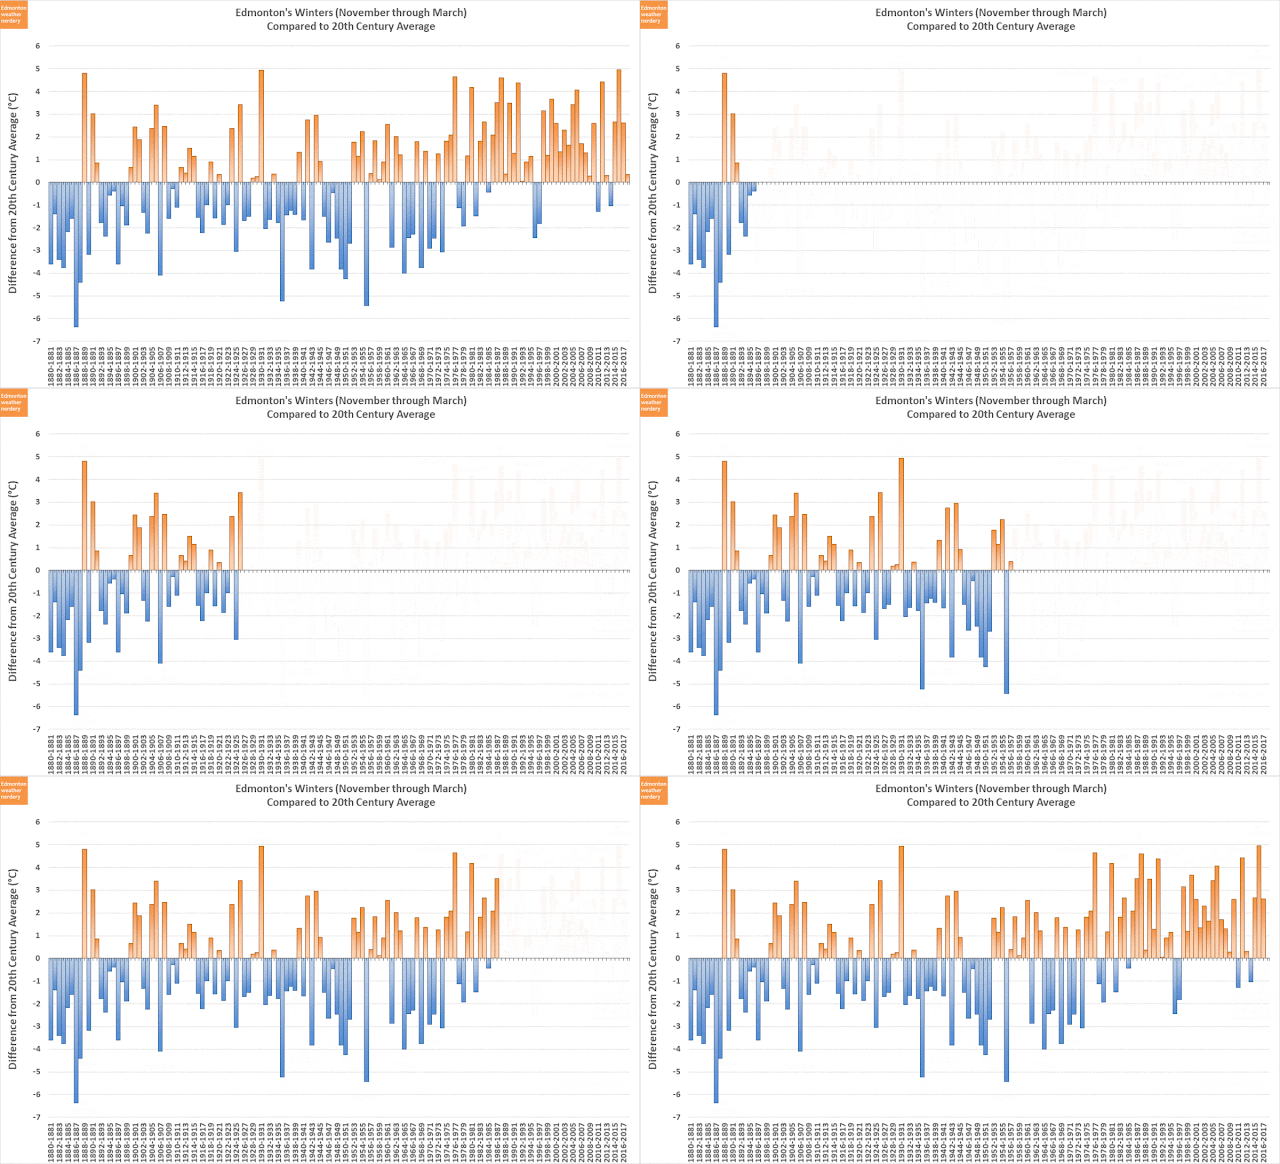
But in the last two years I've used November-March as the boundaries for "winter," and for the sake of consistency I'm going to continue with that again this year. Here are the reviews of the previous two winters:
March makes a nice endpoint because when we look at the average temperatures they mirror November::
The average Highs at the start of November and end of March are both about 5°C, and the average Lows are both about -4°C. And so even though this year is a bit of an outlier, we're going stick with the end of March as the unofficial end of winter. If that isn't working for you this year, just think of this post as the late-winter review.
(Although we definitely shouldn't think that we've seen the end of snow...but we'll talk about that in a few days in Part 2 of our 2017-2018 Winter in Review.)
High Temperatures
Here we have our High temperatures for the winter of 2017-2018:
- November started really cold, but then warmed up at the end.
- December was really warm, before entering a deepfreeze around Christmas.
- January had two separate, warm, chinook-y weeks but then it ended cold.
- February was mostly just cold.
- March was mostly pretty average, before getting really cold at the end.
We didn't break any all-time High temperature records this winter, but we did come close a couple of times: 10°C on December 12th compared to a record of 10.6°C, and 8.6°C on January 18th compared to a record of 9°C.
In terms of recent records (since 1996) we set 3 for warmest-Highs, which were all in December. We also set 10 for recent coldest-Highs, mostly during the November and December coldsnaps, but with a few more in February and March.
Looking back to last year, the winter of 2016-2017 was the opposite with 11 recent warmest-Highs (which included 3 all-time records), and 3 recent coldest-Highs.
Low Temperatures
For the Lows we can see the early-November and late-December coldsnaps again, but we can also see that February's Lows were well below average, as was the very end of March.
There were no all-time records records for Lows, but 4 recent warmest-Lows compared to 14 recent coldest-Lows. And again in comparison to last year, 2016-2017 had 14 recent warmest-Lows (including 3 all-time records) and 4 recent coldest-Lows.
One other thing about this winter was that it started really early with a -18°C in the first week of November, and it ended March with a really late -20°C.
For a full explanation of this chart it's easiest to refer back to the original discussion of it in How warm is 2016? (September Edition).
Generally though, this tracks how much warmer each day of the year was compared to the 20th century average - warm days get points and cold days lose them. The blue and orange background is the range of all the winters going back to 1881-1882, They are all grouped together like that because showing each individual year gets too messy, and so to keep things simple only the last 10 years are shown here as a reference.
So how did this winter score? Using this metric 2017-2018 was Edmonton's 67th warmest winter out of 138, and it was just a bit warmer than the 20th century average. Compared to recent years it was just basically tied with 2008-2009 & 2012-2013, and it was well above 2010-2011 & 2013-2014.
When we follow the red line we can see the warmspells and coldsnaps: a deep dip at the beginning of November; a recovery for the warm December; a bumpy January; then pretty flat through February and March; and then the line takes a dive right at the end of March.
Warmest & Coldest Winters
When we use that scoring for all of Edmonton's recorded history of temperatures, this is what we get.
The warmest November-March was 2015-2016, in 2nd place was 1930-1931, and then 1888-1889 is a surprise in 3rd. For those warm winters the daily temperature averaged about 5°C above the 20th century average. For 2017-2018 in 67th spot we were at 0.4°C above the 20th century average.
Earlier we saw that this winter was warmer than 2010-2011 & 2013-2014, and those both appear here as the blue lines. Winters colder than the 20th century average have been relatively rare in recent years, and before those we need to go back to the pair of winters in 1995-1996 & 1996-1997, and before that to 1984-1985.
Warm & Cold Months
This chart takes what we've already looked at, but breaks it down by month. The full explanation of this chart was in How Warm is 2017 - the Months.
Our colder-than-average months were November at -3°C below the average, February at -2.2°C, and March at -0.5°C. December and January were warmer-than-average at 3°C and 4.2°C.
This animation shows the winters since 2000-2001, and compared to some of those other years 2017-2018 was a little quiet. Last winter November and January were both 5°C above the average; in 2015-2016 February was 9°C above average, and in 2014-2015 January and March were both 5°C above the average.
Coldsnaps
We looked at this winter's cold days a week ago in 2017-2018 Winter in Review - The Really Cold Days and so we won't say too much here today.
But of course the late-March coldsnap has provided us with one more -20°C Low, bringing the total for the winter up to 31 days.
Warmspells
This charts shows how many days through the winter had High temperatures that hit 0°C, and also how many days we had to wait without a warm day.
The total number of warm days for 2017-2018 was 58, and there are 151 days between November and March, so that works out to about 38% of the time. Looking at the 8 years in this chart 58 days is on the low side of things. Warm winters like 2011-2012 & 2015-2016 were up over 90, and the coldest like 2010-2011 & 2013-2014 were down at 50 and 52.
The longest that we went this winter without a day above freezing was 20 days in late January, and that's a pretty typical gap.
This chart shows the same thing, except this time it's for days of 5°C or more.
This year we had 21 5°C days, which is about half of what we saw in chinook-y years like 2011-2012, 2014-2015, 2015-2016, and 2016-2017 which were all up over 40.
The longest that we went without a 5°C day was 49 days, and that usually happens once in most winters.
Breakdown
And this is what it all comes down to - the distribution of the High temperatures for this winter. The most interesting part of this chart is probably at the extremes:
- We had 58 Highs of 0°C or more.
- We had 6 Highs between -20°C and -25°C, and that was more than any winter since 2010-2011.
- But we didn't have any Highs of -25°C or colder, so that's something? The years in this chart that had at least one extra-cold High were 2007-2008, 2009-2010, 2011-2012 & 2013-2014.
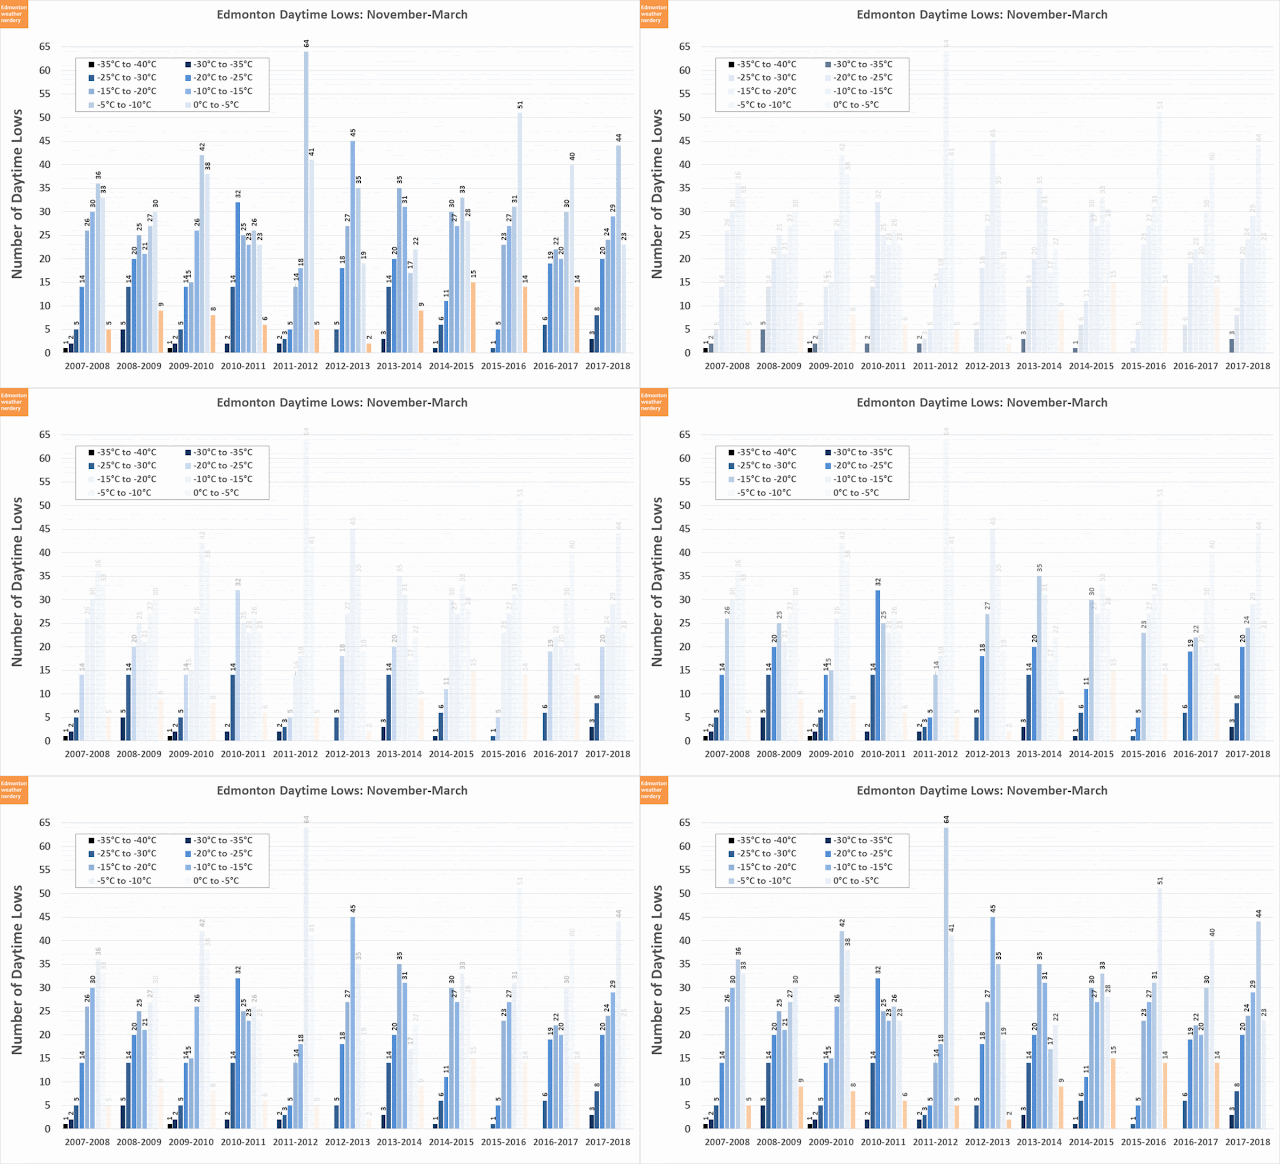
And here we have the breakdown of the Low temperatures for this winter.
- We had 3 Lows of -30°C, after going 2 winters without any.
- We've now gone 8 winters without a -35°C. The last time that we dropped that low was December 16, 2009 at -36.7°C.
- This was one of the rare winters that didn't have any Lows above freezing. 5-10 isn't uncommon, and in the last 3 winters we'd had 14 or 15. Looking back through the data the last November-March with no Lows above freezing was 1973-1974. The winters of 1982-1983 and 2003-2004 both came close, but missed it by a day or two. (this doesn't have any great significance, and is mostly because early-November and late-March were both much colder than usual)


No comments:
Post a Comment