
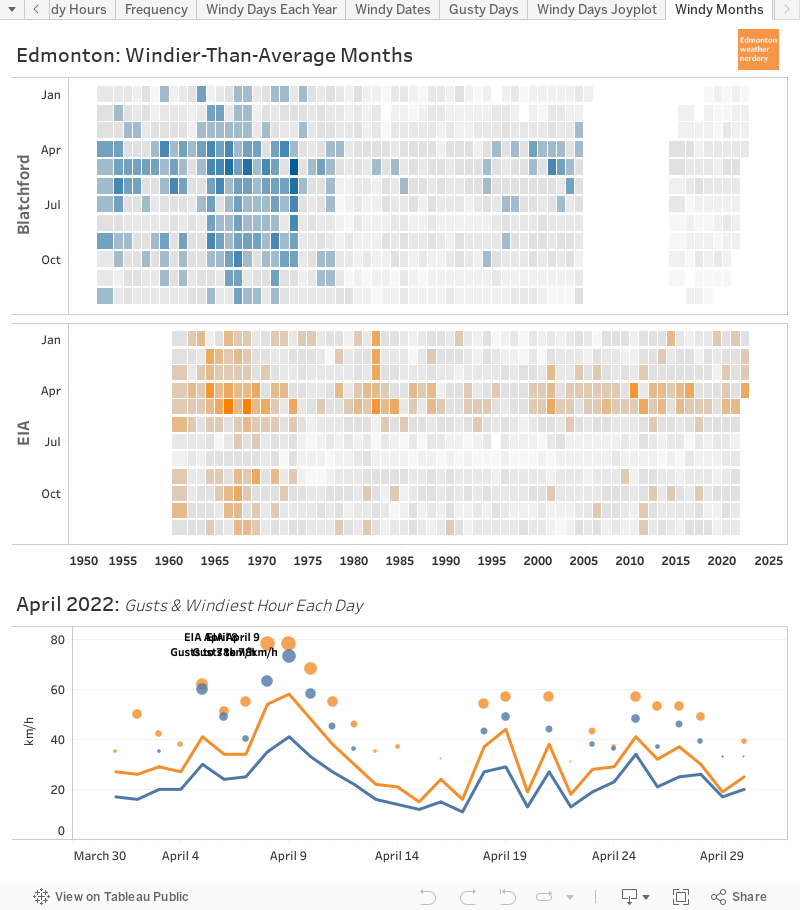
In this chart each of the colourful blobs represents a month that was windier than average. That is calculated based on the average windspeed for each hour of each day during the month.
Blatchford's windiest overall month was May 1973 with an average windspeed of 21.2km/h, while the International was a bit lower at 18.1km/h.
The International's windiest month was May 1968 at 22.3km/h, and for Blatchford that ranks as #2 at 21km/h.
2 things to take from this chart are:
- the big clump of colourful months in the 1960s, which reinforces the windy '60s which we have seen throughout this series.
- the smaller clump of colour for the windy months of April & May.
It doesn't tell us anything that we didn't already know, but it works as a nice high-level summary.

May 2020 actually ranked as the International's 23rd windiest month (out of about 720), with an average windspeed overall of 17.7km/h. April 2020 ranked as #87 at 16.1km/h.
At Blatchford April & May were unremarkable, with windspeeds of around 14km/h. Ever since Blatchford restarted recording again in 2015 the windspeeds have been way down from where they used to be. And it's not missing data, because all of the hours are recorded, they are just really low. This change might be due to all the construction there, including the giant hill which has been built at the north end of the former airport?
In the final posts of this series we will be looking at something new: wind direction.
No comments:
Post a Comment