
And today we are going to throw wind direction into the mix.

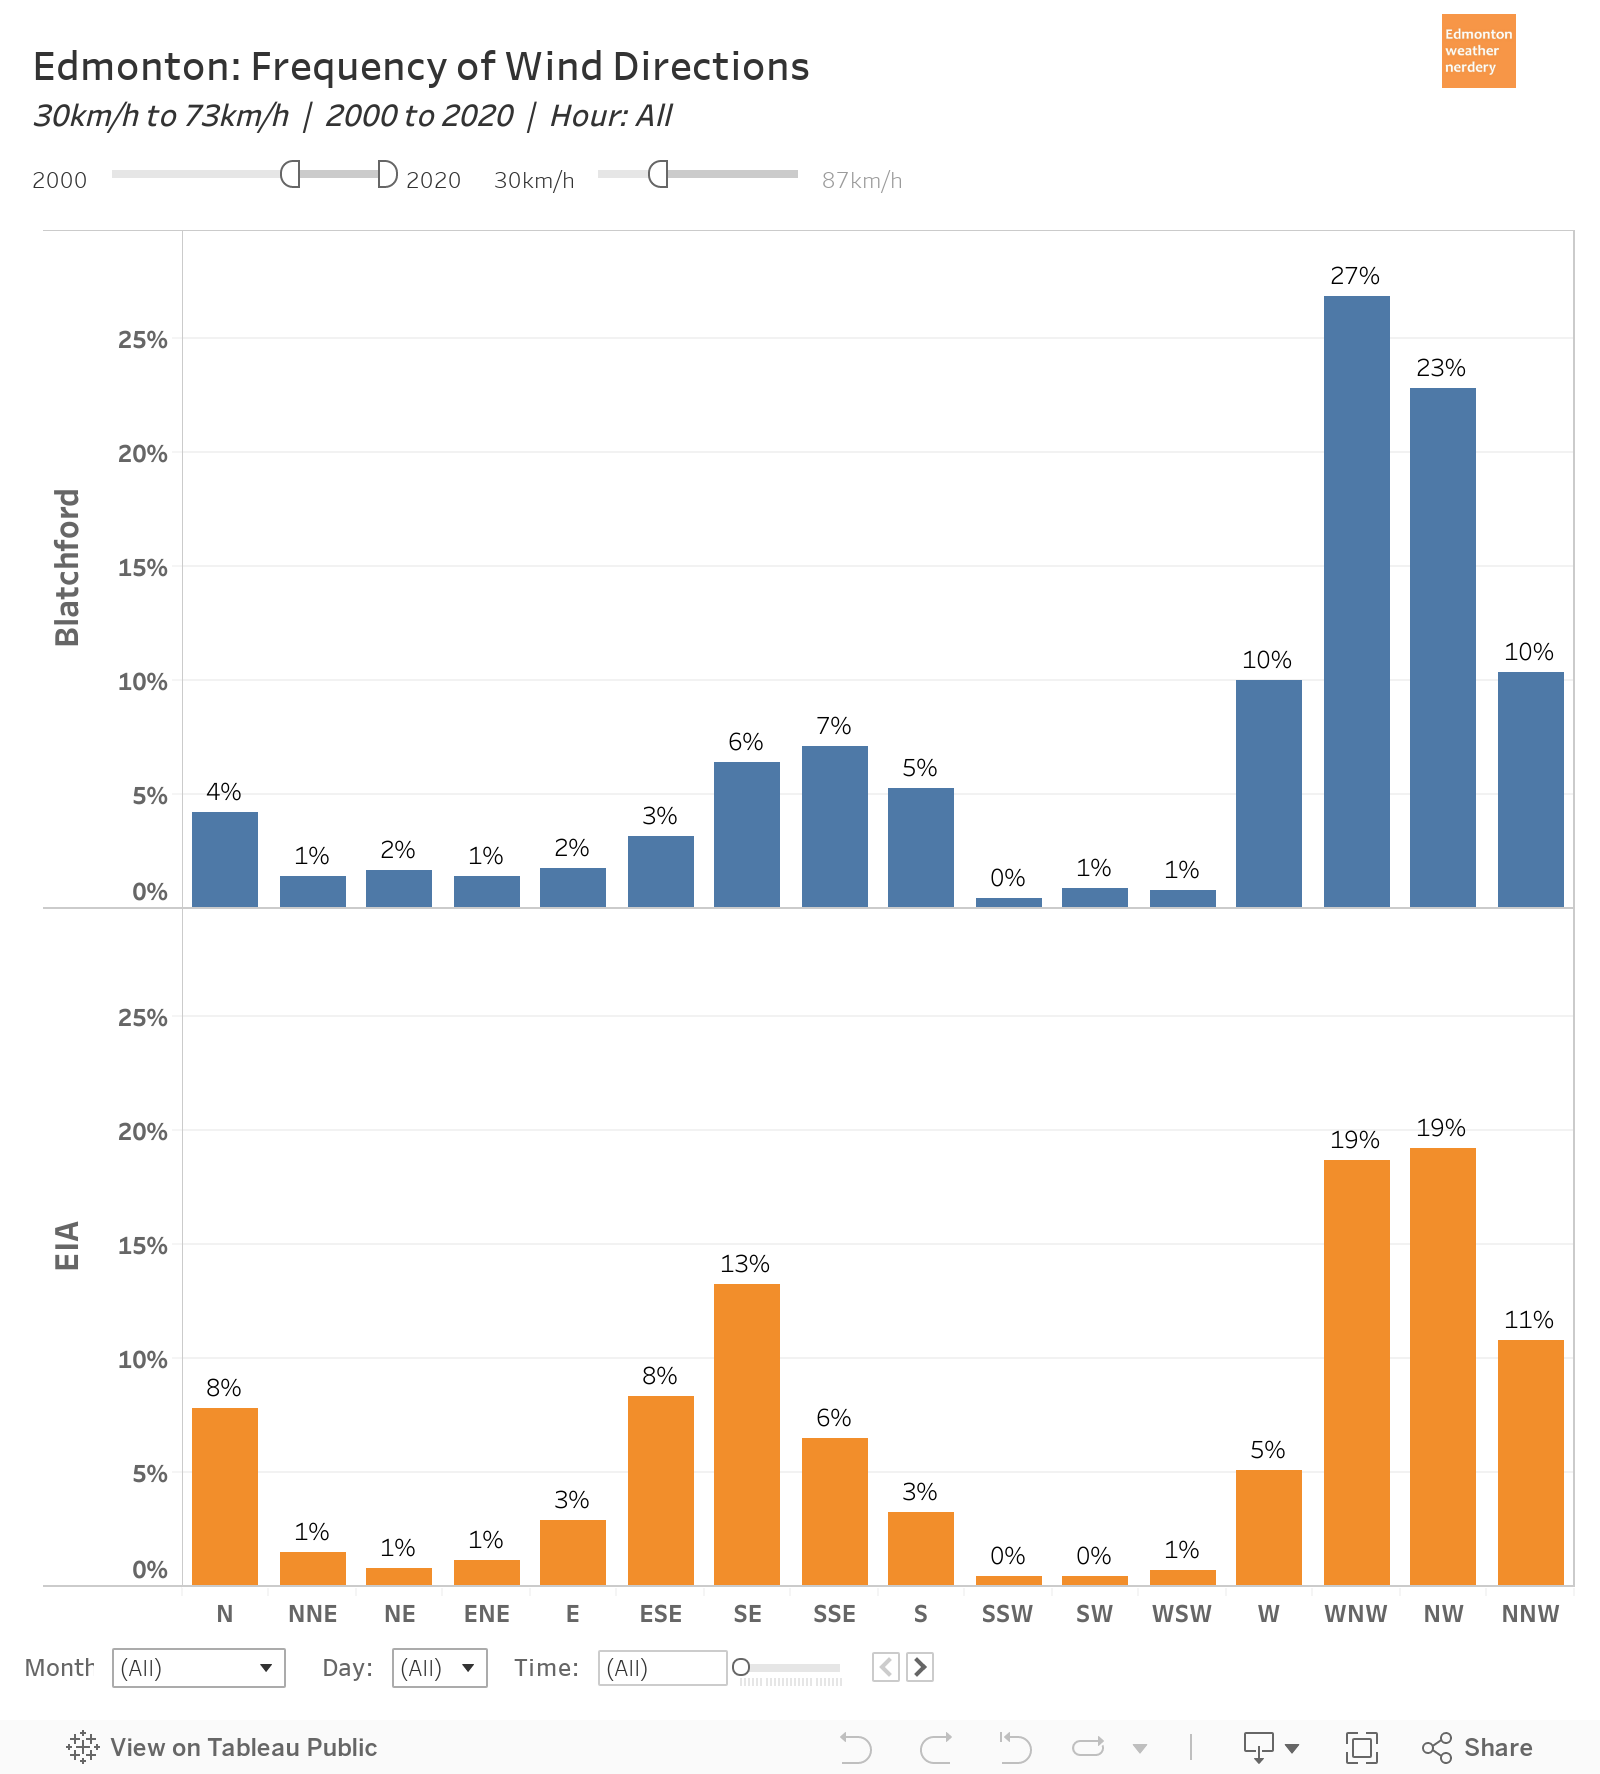 When we filter to just show high winds and recent years the wind from the S mostly disappears, while the NW quadrant takes over.
Wind Direction Total Hours
This dashboard does not fit well into the blog format, so I recommend following the link to see it in full-size in tableau. For most of today we will be using gifs as examples instead of the dashboard, because they show up better.
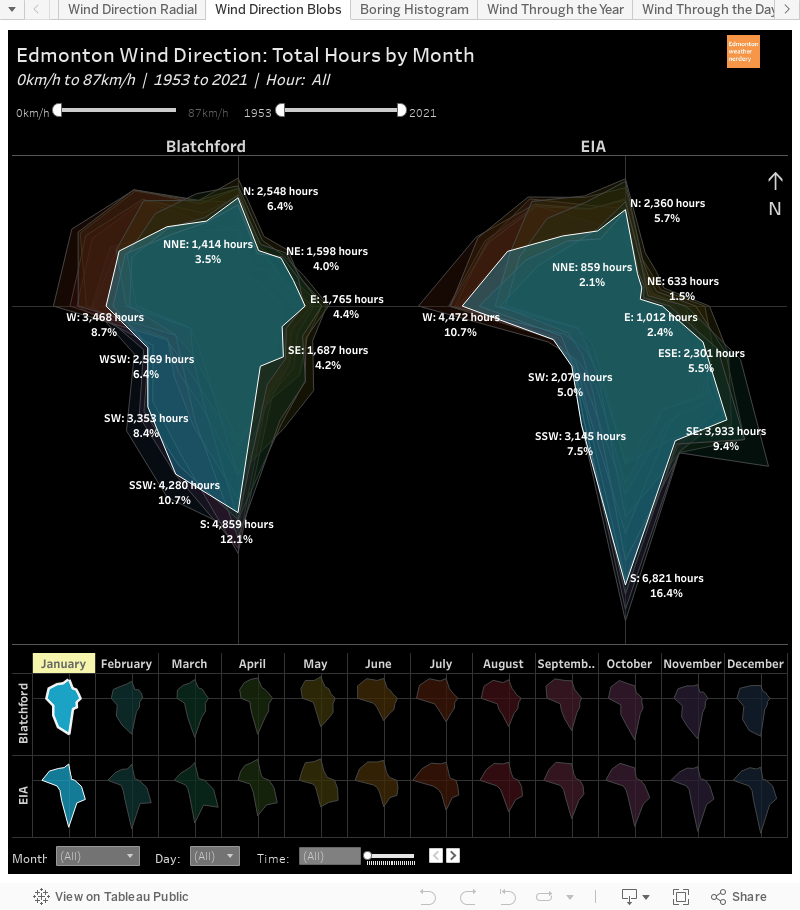
The blobs in this chart represent the proportion of the time that the wind comes from each direction. The size of these blobs does NOT correspond to windspeed - we will talk about that later.
In this chart a big blob to the north means a lot of hours of wind from the north. It doesn't actually tell us how windy things were, though. Right now we are looking at any hour with a windspeed of 0km/h+, which works out to over 500,000 hours per station.
Let's take a look at what this chart does tell us:
Monthly Wind Blobs
Here we are cycling through the wind profiles for each month of the year.
I did not normally think of Edmonton as having winds from the South, but in terms of overall hours it is actually quite common. As we move through the year though the South winds are much less common in the summer months of June through September.
Wind Blobs: High Windspeeds
In this version of the chart, instead of cycling through the months of the year we are cycling through windspeeds: 0km/h+, 10km/h+, 20km/h+, etc.
As the windspeeds increase the south winds disappear, and by the time we reach 50km/h almost everything is from the NW quadrant. So while Edmonton records a lot of hours of wind from South overall, those are mostly for low windspeeds. When we just look at high windspeeds the direction is from NW, which is what we would typically expect.
Once we hit 60km/h there isn't very much data to play with, and so the chart melts into abstract art.
Monthly Wind Blobs: 30km/h+ for Recent Years
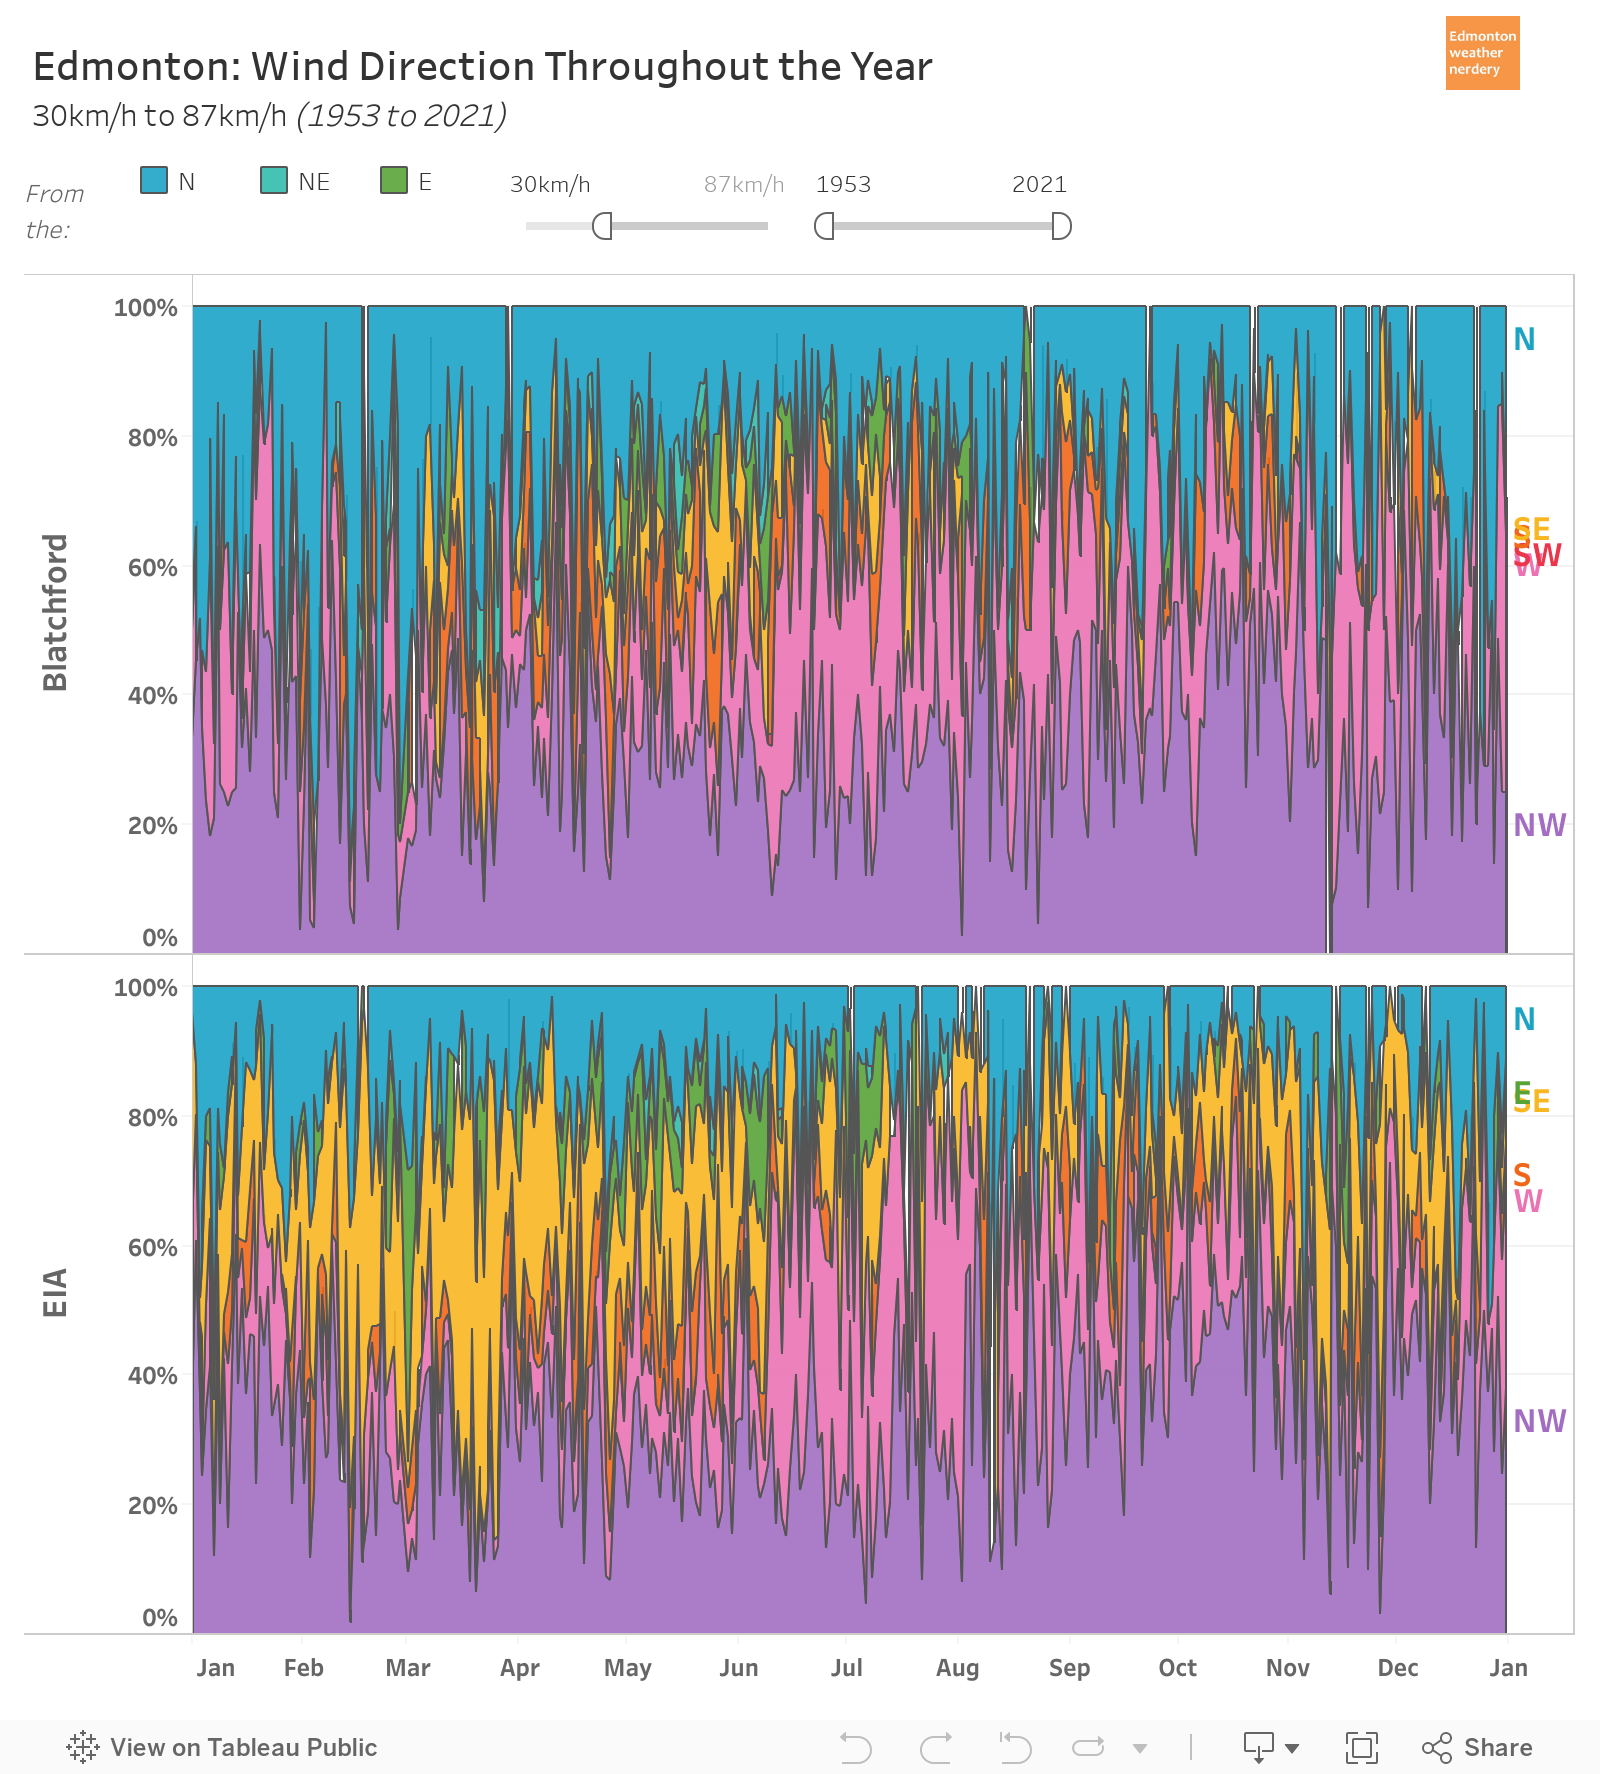
The previous charts included all years from 1953+, but here it is filtered down to only show 2000+, and windspeeds of 30km/h. We saw in Part 3 that windspeeds of 30km/h+ only happen about 5% of the time, and so these represent the fairly "windy" recent hours. Again we see mostly winds from the NW, although the SE is prominent through a lot of the year, and moreso at the International than at Blatchford.
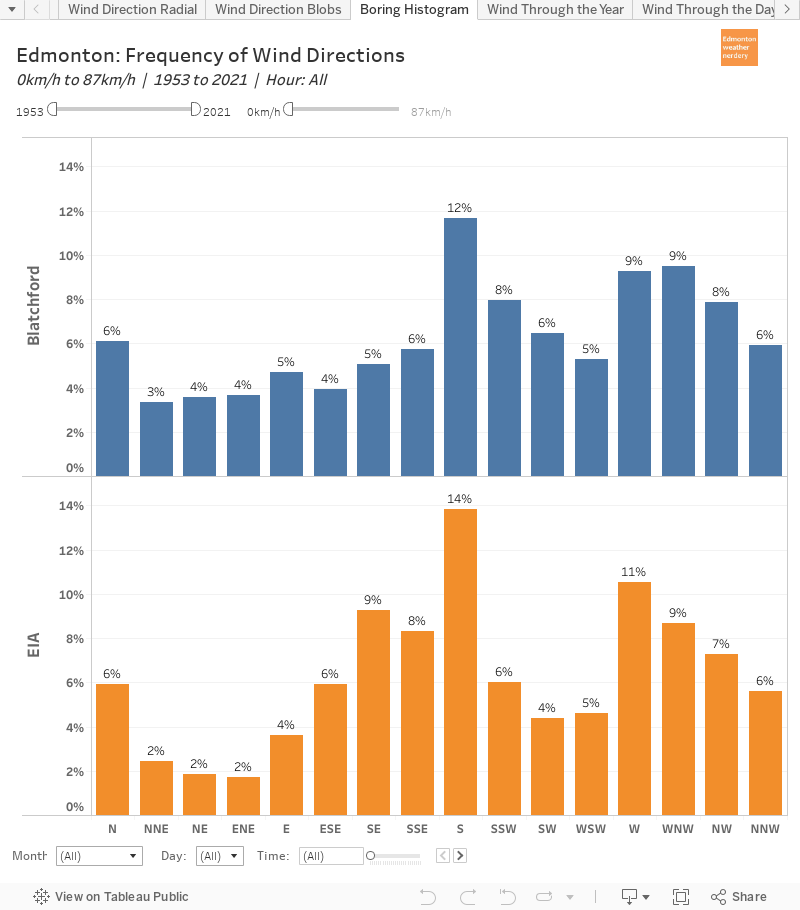
A Bar Graph
The blob chart is fun, but here is a more straightforward breakdowns of wind direction. This is for all the years from 1953+ and all windspeeds from 0km/h+. And as we saw with the blobs winds from the South are surprisingly the most common overall.
A Bar Graph Again: 30km/h+ for Recent Years
Hourly Wind Blobs

Here is one more version of the blobs chart which shows how the wind direction changes through the day. This is using the data for all years and all windspeeds again, and the NW winds grow from 6AM through 6PM, and then vanish (relatively) overnight.
There are a million different ways to play with this chart, and these were just a few examples.
Wind Direction During the Year
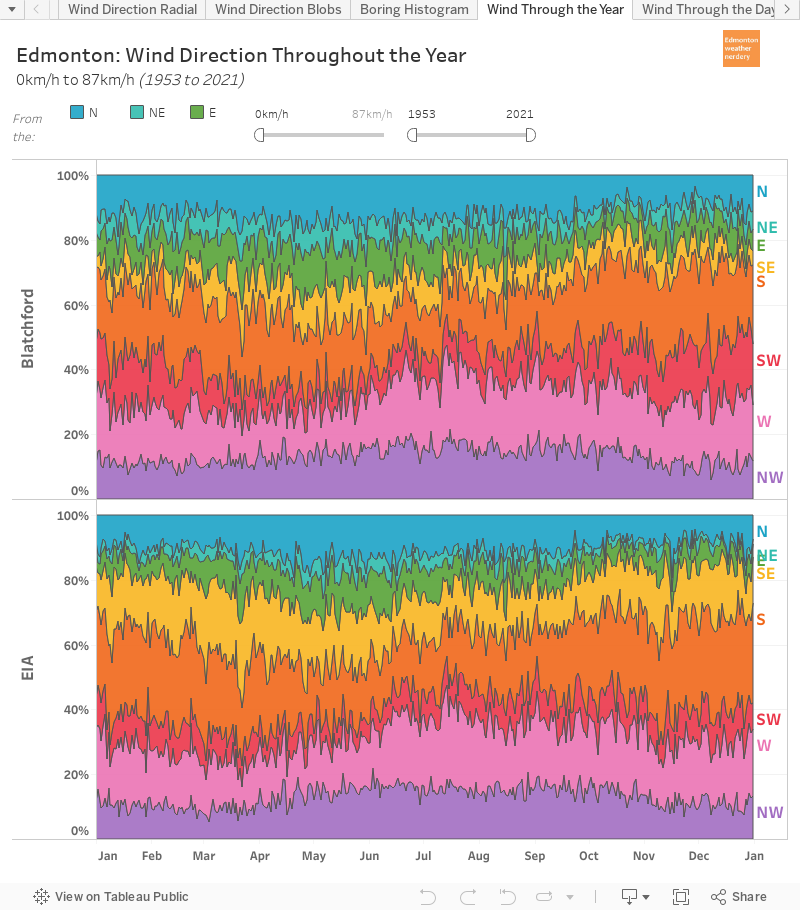
The orange band the wind from the South is narrowest in the summer months from June through September, and at the same time that is when the West and NW bands are largest.
Wind Direction During the Year: 30km/h+
Wind Direction During the Day
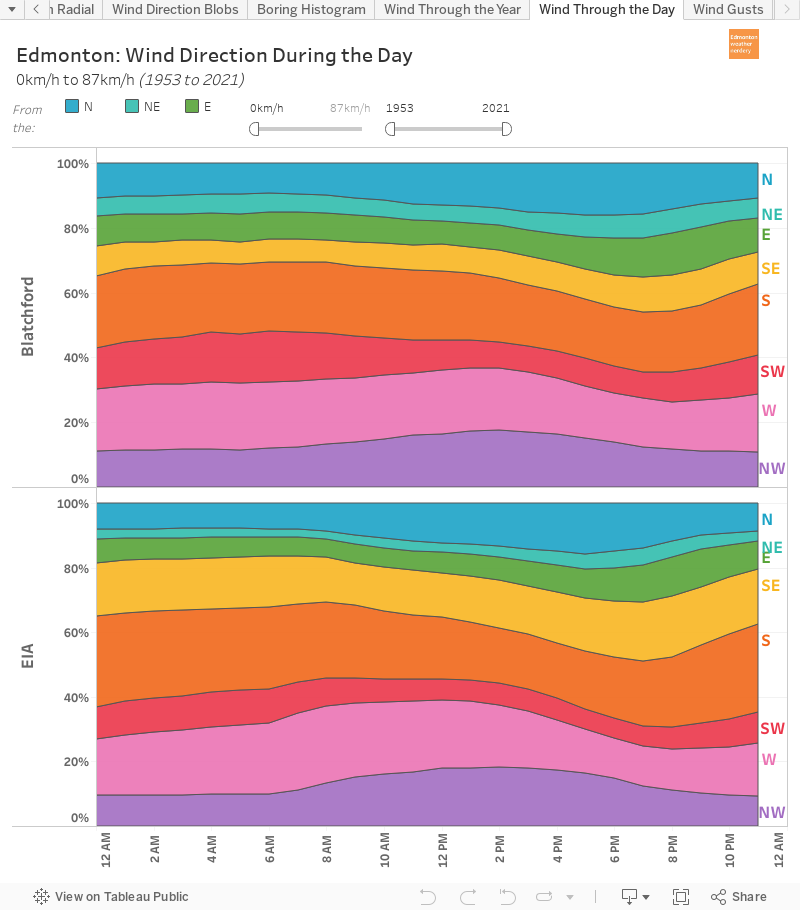
We are going to end things today with this very soothing looking chart, which shows how the wind directions shifts throughout the day. This is for all the years from 1953+ and all windspeeds from 0km/h+.
It's pretty complicated, and there is also variation between the Blatchford and International. Generally the bands for N, NW & W grow from 6AM-6PM, and fade in the evening and overnight, and the other directions all shift around to make up the gains for those other directions.
This last chart is fun if we filter it for windspeed:

Here we are increasing the windspeeds: 0km/h+, 10km/h+, 20km/h+...all the way to 80km/h. As we get into the higher numbers it runs out of data an collapses in on itself.
But as we initially increase the speeds up from 0km/h the band for winds from the South disappears, and the N, NW & W really take over. For windy hours the W & NW are big during the daytime hours, while strong winds from the N are more common during the evening and overnight.
And that's the end for today.
Just one final reminder that all of these charts have been about the proportion of time that the wind is from one direction or another. So everything adds up to 100%, and if one one direction has more hours then one of the other directions has fewer. And it's also important to remember that when we go from looking at all windspeeds (0km/h+) to windy hours (30km/h+) we are going from 500,000 hours down to only about 25,000 hours.
In Wind Part 8 we will take one final look at wind directions and gusts.
No comments:
Post a Comment