
Wind Direction & Speed
 This is another dashboard which does not fit into the blog well, so I would recommend following the tableau link to view it in all its glory. And for today we will be using some animations to show what it can do.

In Part 8 we looked at some dashboards which showed how often the wind is from each direction, but which didn't address the windspeed.
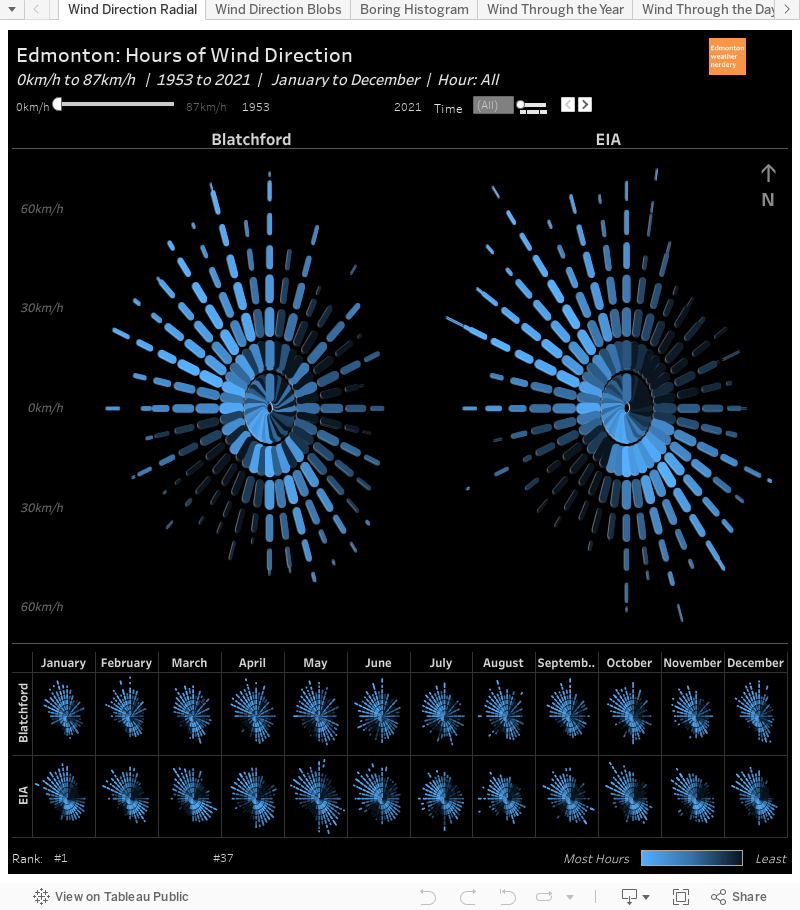
With this chart though we have got it all. For each little line segment:
- the length represents the windspeed: from 0-9km/h, 10-19km/h, 20-29km/h...all the way to 80-87km/h.
- the colours represent the relative number of hours for each windspeed range.
- the thickness of each line segment represents the total number of hours, going back to 1953. This is logarithmic, and the thickest lines in the innermost rings are for tens of thousands of hours, while the further out rings represents hundreds or dozens of hours.
In the example above we see the most and least common wind directions for windspeeds of 20-29km/h. At both Blatchford & the International winds from the SW (or 220°) are the least common for the range of 20-29km/h, with 132 & 141 hours respectively. For Blatchford the most common direction for 20-29km/h is from the WNW (290°) with 7,248 hours, while for the International it is from the SE (140°) with 6,308 hours.
So there is a lot of information in here, and hopefully that one example helps to give some idea of what is going on.
Wind Direction & Speed Each Month
Here is another example of how the shape of the winds change from month to month.
Winds from the NW & SE are prominent all year, but the size of circles changes from the large and windy May, to the small and calm August.
Wind Direction & Speed Each Hour: 2000-2020

Here is another example of data from recent years for 2000-2020, showing how the wind changes with each hours of the day. (Blatchford is missing data for 2005-2015, so its records here area less complete).
I find that it's tough to see much of a pattern in this one, although the circles do start to get larger from about 10AM-6PM, and then shrink overnight.
Strong Winds: 2000-2020

And here is one more example for 2000-2010, showing where our strongest winds come from.
For the ranges of 30-39km/h, 40-49km/h & 50km/h the NE & SW quadrants are mostly empty because our strong winds usually come from the NW and SE.
Wind Gusts
And finally we arrive at our final dashboard, which is also best viewed at the tableau link.
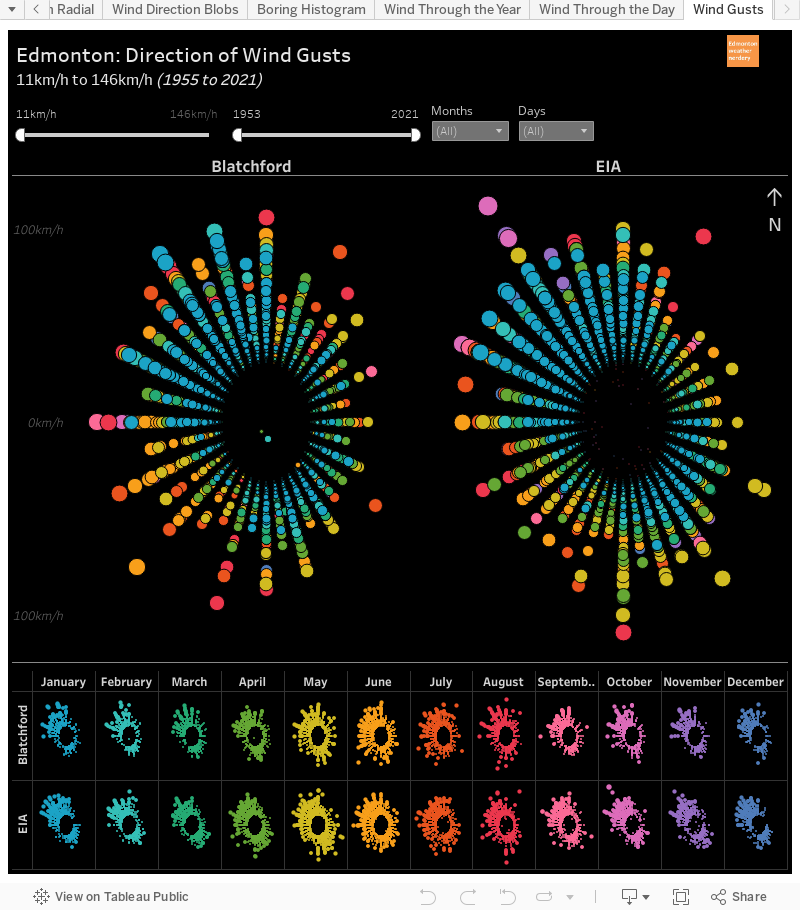
In this chart each bubble represents a peak, daily wind gust going back to when records began.
Strongest Wind Gusts

This example highlights the strongest windgusts ever recorded at the two Edmonton stations:
- for the International it was 146km/h from the NW on October 1, 1965
- for Blatchford it was 117km/h from the W on September 11, 1973, and 117km/h from the SW on June 6, 1960.
Strongest Wind Gusts: 2000-2020

Here we have the strongest windgusts going back to 2000 (although Blatchford data is missing for 15 of those years, from 2000-2015).
- the International's gustiest recent day was 115km/h from the NNE on August 15, 2015
- Batchford's gustiest recent day was 105 km/h from the NNE onf July 20, 2015
Wind Dusts Each Month

Here is an example of how the wind gusts change from month to month. Looking at the little profiles along the bottom May, June & July are much more circular, while the other months tend to mostly have gusts from the NW, with a bit from the SE too.
Strong Wind Gusts

And finally, here we emphasizing the strongest wind gusts. For speeds above about 70km/h almost all of our gusts are coming from the NW quadrant, with just a few from the SE.
And that brings us to the end for today. This was mostly just an excuse to play with some fun new chart types, but hopefully it has provided a bit of insight into our windy todays.
Tomorrow we will be back with the final entry in our epic series on Wind in Edmonton.
No comments:
Post a Comment