
At long last we reach the end of our 2020 Year-in-Review with Part 4: Snow. In Part 1 we looked at Edmonton's temperatures, Part 2 looked at temperatures in cities across Canada, and Part 3 was about Precipitation.
A caveat for today is that the Blatchford weather station in central Edmonton does not record snowfall anymore. Many of the charts today will include Blatchford's snowfall history for 1880-2007, but the 2020 numbers are from the International Airport. Blatchford does still record the depth of snow on the ground, and so 2020 snowdepth data will include both Blatchford and the International.
Also, snowdepth data can be a little odd. There doesn't seem to be anything glaringly wrong with the 2020 numbers, but generally snowdepth is the Environment Canada measurement with the most wiggle-room.
Snowy Months

The charts today are usually used to show the snowfall during each winter, from roughly September to the following May. Today we are talking about calendar years though, and so the charts will look a little strange with the end of one winter, a gap for the summer, and then the start of the next winter.
Most of our main winter months of November-April average around 18cm of snow. January's average is on the higher end at 22cm, and February is lower at 15cm. For the shoulder season October averages 9cm and May averages 5cm. While we do get snow in September and very occasionally in June, those months are pretty hit-or-miss.
So for the main winter months of 2020 January, February, March & November were all above average in the 23-31cm range. April was low at 5.4cm, and December's 3.4cm was a bottom-5 for the International. The shoulder-season months of May and October were both below average, and there was no snow in September.
Total Snow

This chart looks very strange for calendar years, but what it shows is that for January-May we had a total of 84cm of snow. Then there's a plateau for the summer until things picked up again in October. From October-December we received another 39cm, and that pushed the total for 2020 up to 123.7cm.
On average we get 125cm of snow each calendar year, and so 2020 was right on the average.
Snow Across Canada

This chart is pretty messy, but it shows the total snowfall for 9 cities across Canada. To clean things up a bit you can turn off cities from the dropdown on the upper left, but having them altogether is good for context.
The totals:
- St. John's averages 343cm and got 370cm in 2020
- Ottawa averages 223cm and got 173cm
- Montréal averages 203cm and got 168cm
- Calgary averages 140cm and got 162cm
- Toronto averages 118cm and got 140cm
- Winnipeg averages 119cm and got 137cm (there is some missing data there, though)
- Edmonton averages 125cm and got 124cm
- Vancouver averages 31cm and got 45cm
Just as a fun comparison, here are the 2020 monthly snowfalls for St. John's compared to Edmonton's 30-year range:

Last & First Snowfalls
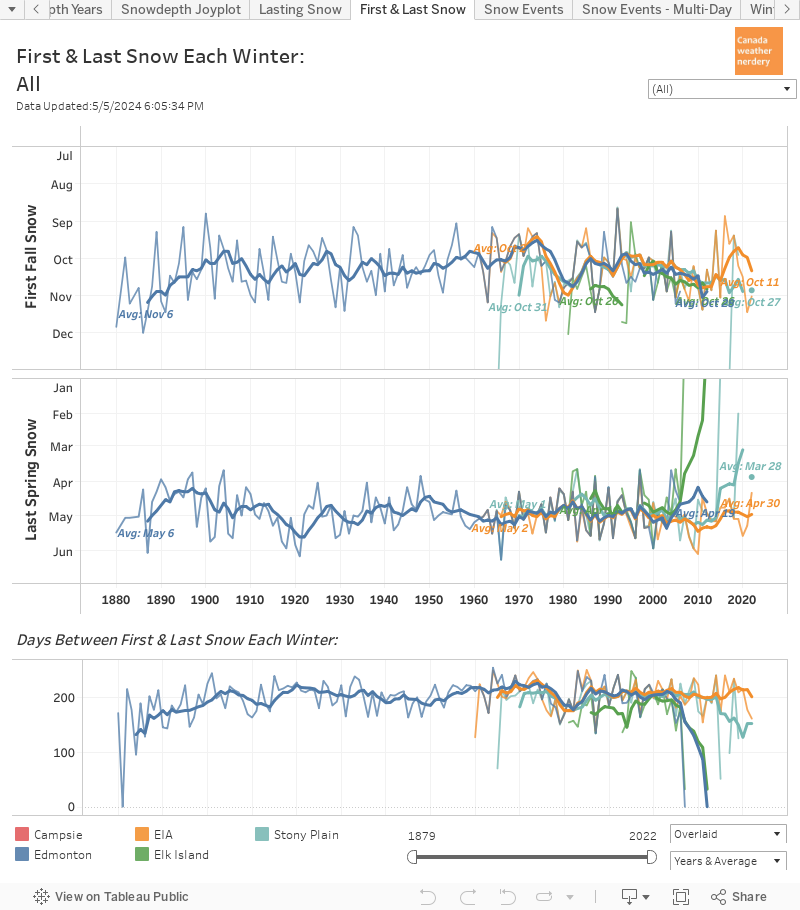
Edmonton's final snowfall of the spring of 2020 was May 4th, which is a week later than the average of April 26th. The first snowfall of fall was on October 16, which is a pretty typical first snowfall looking back over the long-term. It was quite late compared to recent years though, because recently 2014, 2016, 2017 & 2018 all had really early September snowfalls.

This chart has the spring and fall snowfalls for the Canadian cities. To keep it clear only Edmonton, Vancouver & Montréal are shown, but the other cities can be selected from the dropdown on the upper right.
The averages for the cities are interesting, with Edmonton's final spring snowfall typically coming 2 weeks after Montréal's, and the first fall snowfall possibly a month before Montréal's. Vancouver isn't a fair comparison for any other city, but when it gets snow it might happen between December & February.
The Spring Melt

Spring came late in 2020. For January & February the snow on the ground was a bit above average, but by the end of March the snowdepth at the Airport was the highest that it had been in 30 years. The big melt didn't really start at either Edmonton station until around the 2nd week of April, and Blatchford hit 0cm of snow on April 16, with the International following a week later.
And how did things look across the country?

This is another messy chart where turning off some of the cities makes things easier to see.
Everything here is dwarfed by St. John's which had a massive storm in January which pushed its snowdepth up over 120cm for a few days. Ottawa and Montréal saw spikes in early February, but had mostly melted-off by mid-March. Winnipeg was down to 0cm by the first week of April, and St. John's and Edmonton both took an extra week.
Fall Snowdepth

For fall snowdepth both Edmonton stations took off in the first week of November, and were above average for most of the month. The warm weather in December cut the snowdepth at the International in half, but Blatchford stayed fairly flat at around 15cm.

In the fall the snowdepth data is pretty spotty, because nowhere except Edmonton has any snow. That makes this chart difficult to read, but what we have is:
- a blue line for Edmonton's fairly constant snowdepth through November & December.
- a bouncing orange line for Calgary which had several big storms, which quickly melted away.
- a brown line for Winnipeg which wasn't showing much show until the last week of December.
- one cyan spike for a storm in Ottawa
Snowdepth Through the Years

For one final look at snowdepth here we have a comparison of recent years in Edmonton, Calgary, Winnipeg, Ottawa & Montréal. St. John's isn't shown because it dwarfs everything, but it can be selected from the dropdown on the upper-right.
- 2020 was a low-snow year for Ottawa, but it will often have a big spike up to 50cm or more in snowdepth in January or February.
- Montréal also sees February spikes, but usually not above about 30cm of snow on the ground.
- Winnipeg's snowdepth usually peaks between 20~30cm, and hangs out there for a few months. But in spring it disappears a week or two before Edmonton, and in the fall it shows up several weeks after.
- Calgary has lots of early spikes, but also lots of melts.
- Edmonton usually gets started in mid-November and hangs on through the end of March.
2020 Snowstorms

This chart shows all of Edmonton's 10cm+ storms that occurred over 2 days. Why 2 days? Often a storm rolls in at night and continues through the next morning, so 2-day-totals are probably a better representation of the big storms. This chart is organized by winter rather than by calendar year though, so to talk about 2020 we need to use a bit of imagination.
In 2020 Edmonton had two storms which crossed the 10cm mark: 10.5cm on January 22nd, and 15.6cm on November 7th. In a given winter we average about 3 10cm storms, and about 6 5cm storms.
2020 Snowstorms Across Canada

And here we have one final messy chart with big storms for Calgary, Ottawa, Montréal & St. John's. The Edmonton chart was showing 10cm+ storms, but here we have moved up to the big leagues with 25cm+ over 2 days.
- Calgary had 1 25cm+ storm on December 12th at 27.2cm
- Ottawa had 1 on February 7th at 26cm
- Montréal had 1 also on February 7th at 35cm
- St. John's had 2, on January 6th at 43cm and then on January 18th at 78cm(!)
Finally, for some context here is how often throughout history Edmonton, Calgary, Ottawa, Montréal and St. John's have had 25cm+ 2-day storms:

And that brings us to the end of our look at snow in 2020, and to the end of our 2020 Year-in-Review.
No comments:
Post a Comment