
30°C Heatwaves Across Canada
 Here are the longest 30°C heatwaves for cities across Canada. (normally we would also include Vancouver and St. John's, but they have so few 30°C days that they're not worth it. They can still be accessed from the dropdown at the upper right, though).
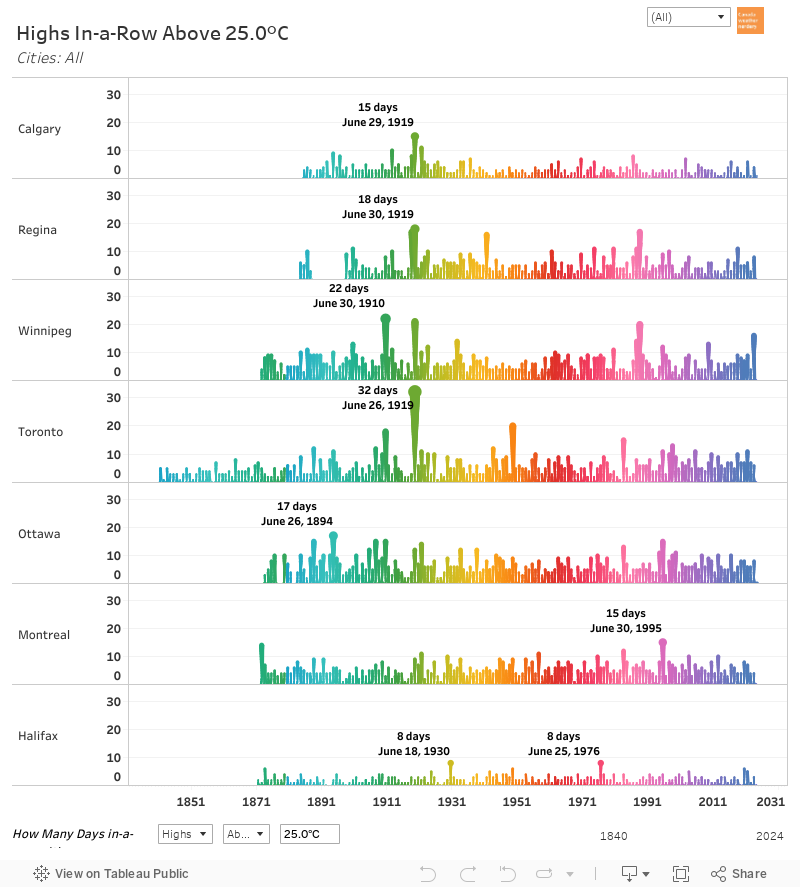
Days Without Hitting 30°C
As we saw in Part 1 Edmonton's longest 30°C heatwave lasted 6 days in 1961. For Calgary the record was 8 days back in 1917. Winnipeg, Toronto, Ottawa and Montréal are all in the range of 10-13 days, with Ottawa's happening last summer in July 2020.
This isn't much of a contest though, because the city here with the longest heatwave by far is Regina, with a 24 day run of Highs at 30°C or warmer from June 22 through July 15th 1886. That basically doubles any other city here. It is so long that it seems suspicious, but if you are curious about the data it is available here.
If we ignore the all-time records and look at more typical years, for Edmonton and Calgary most of the 30°C heatwaves aren't more than about 3 days long. For Winnipeg 4 days would be pretty common. And for the other cities 6 or even 7 days are not unusual.
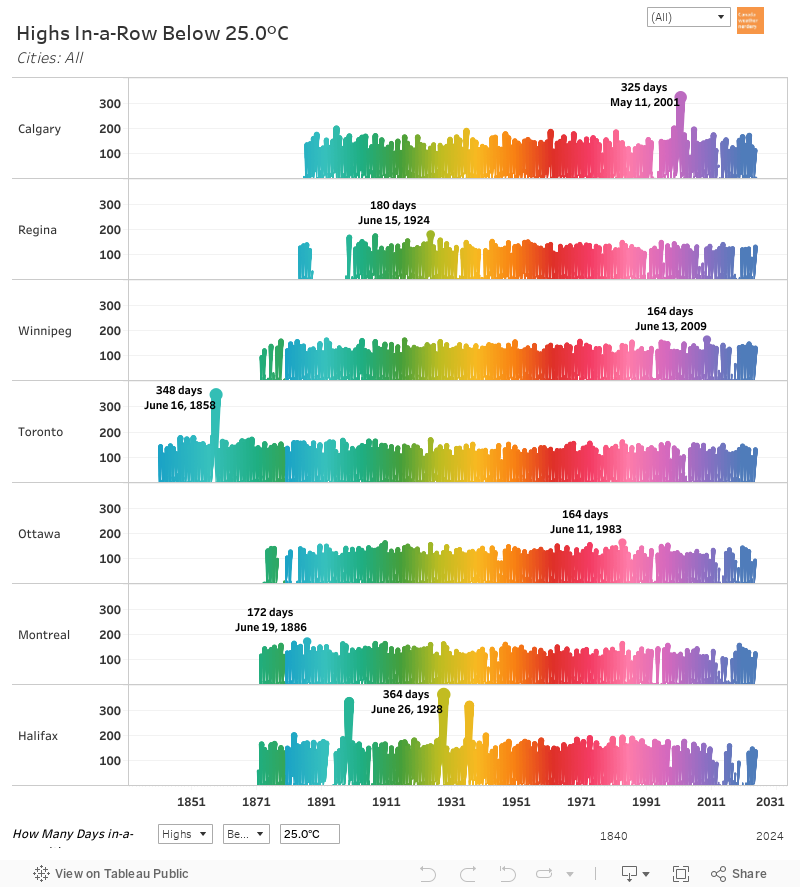
Most of the cities here will hit 30°C each summer, so they don't go more than about 350 days.
Edmonton and Calgary are the exceptions though, with Calgary going 1,449 days from September 1900 through July 1904 without hitting 30°C. For Edmonton the record was 1,063 from August 1998 through July 2001. And in this chart any of the other peaks which are extra-tall are going to be years which missed hitting 30°C. 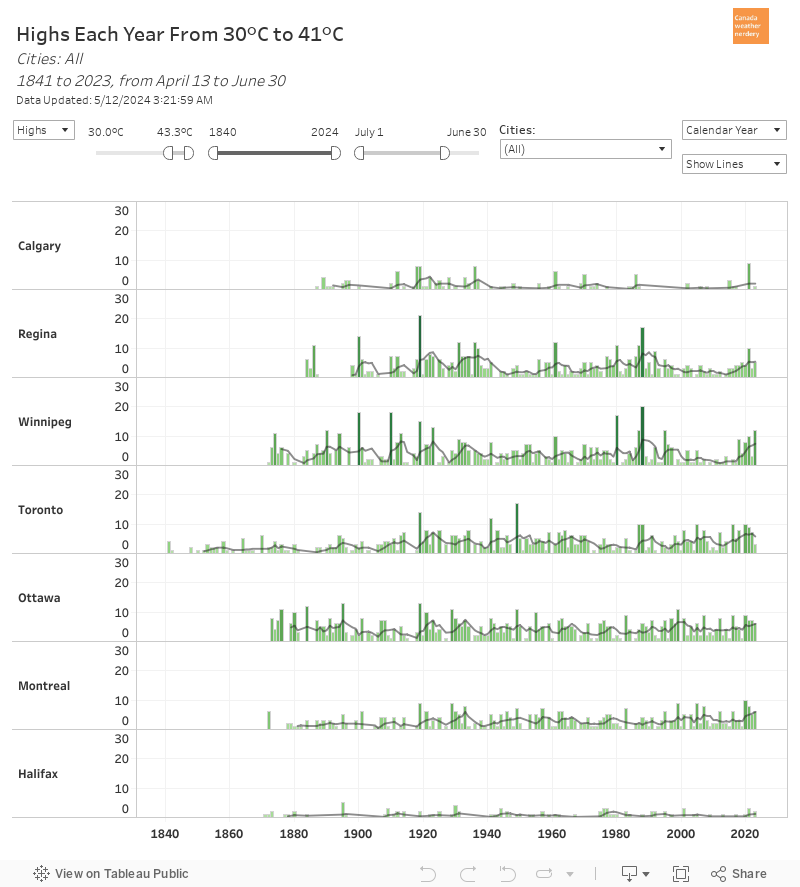 Here we have the number of 30°C days each year, back through history.
Edmonton is down at the bottom averaging 3~4 each year, while Calgary gets 5~6. On the warmer side of things Montréal averages 11~12, while Regina and Winnipeg are at 13~14. And at the top Toronto and Ottawa average 15~18 30°C days each year.
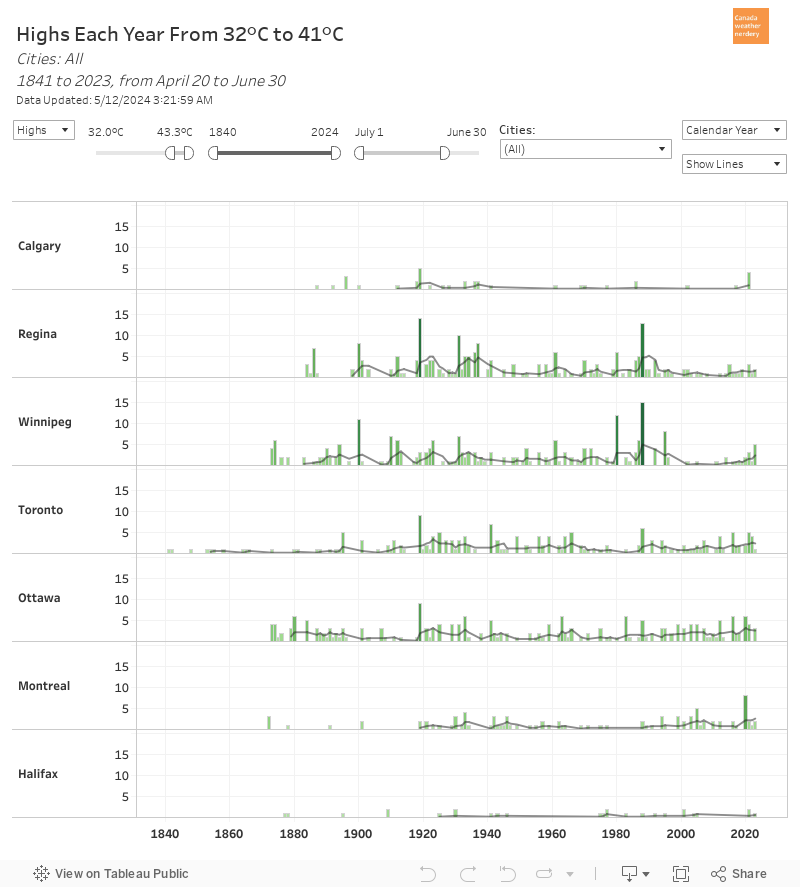 Here we have the number of 32°C each year. Edmonton barely registers, while Calgary averages 1~2 each year. Montréal is next averaging around 5, although it had a record 13 in 2020. Winnipeg gets around 5, Regina around 6, and Toronto and Ottawa around 8.
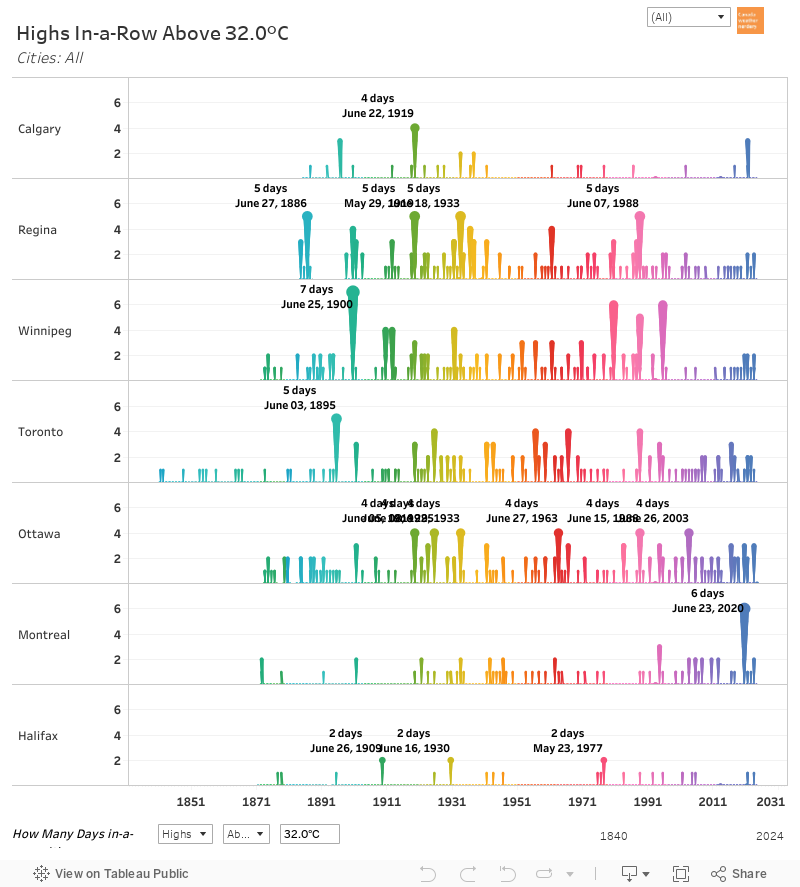 These are the longest 32°C heatwaves for these cities.
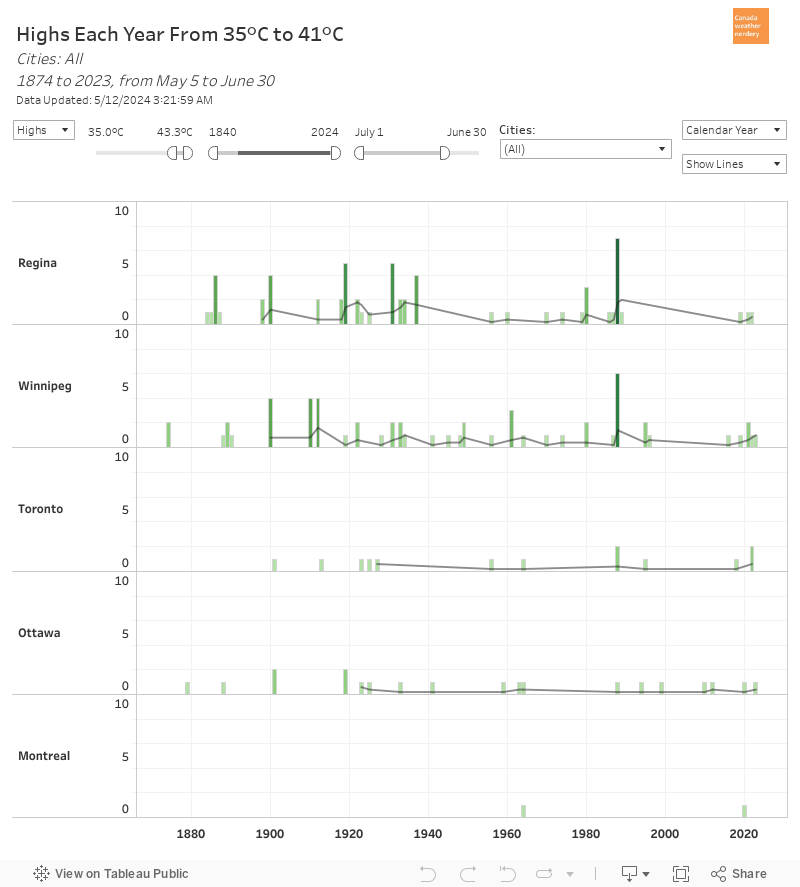 And finally, here we have the super-hot 35°C Highs.
For Edmonton, Regina and Winnipeg the number of 30°C days was highest around the mid-1930s, and for Calgary it was around 1920. For Toronto, Ottawa and Montréal there has all been a slight uptick in recent years, but the level is not too different from where it was in the 1940s or 1920s.
- For Edmonton the record was 4 days, back in 1961 again.
- Calgary had 5 days back in 1914, but hasn't gone more than 3 days since 1941.
- Montréal has had two 6-day 32°C streaks, in 1963 and last summer in 2020.
- Toronto has had two 7-day streaks in 1921 and 1936. The last time it went more than 5 days was 1948, though.
- Ottawa went 7 days in 2018, and 8 days in 1944.
- Regina went 7 days in 2003, and 8 in 1920 and 1937.
- And Winnipeg also went 7 days in 2003, and 10 days 1936.
Montréal barely registers, with about 21 of them over 140 years. In Ottawa, Toronto, and Winnipeg it's a little more frequent, hitting 35°C every few years. And Regina is the most reliable city to hit 35°C with many years getting 1 or 2, although there was a gap from 2008-2016. 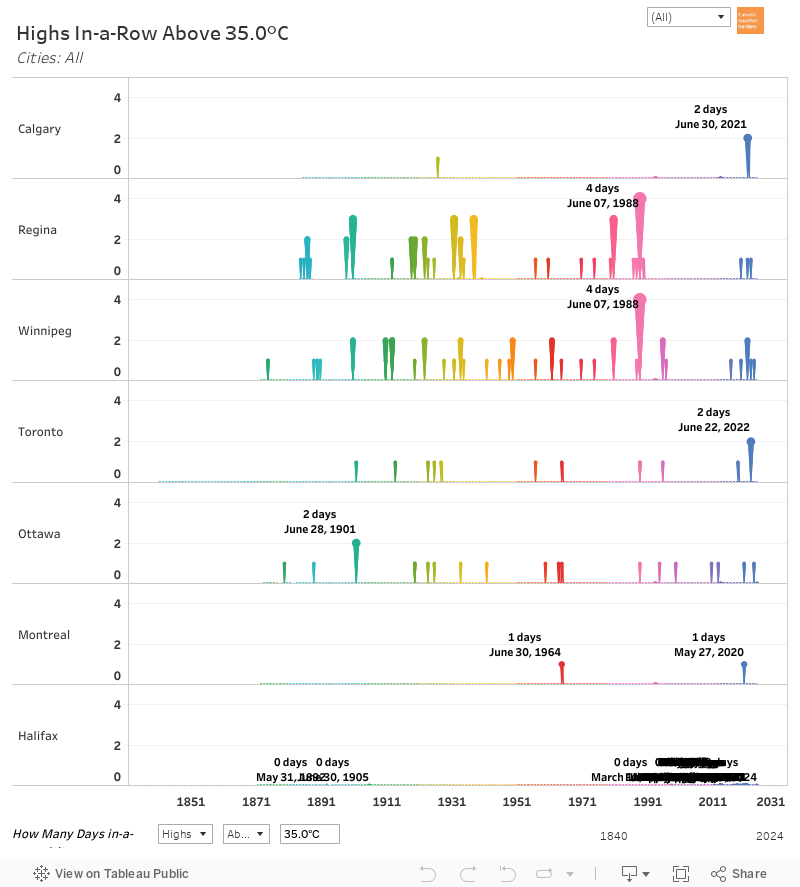 And finally-finally, these are the longest 35°C heatwaves for these cities.
Even though Edmonton has barely had any 35°C days, we did have a 3-day heatwave back in 1924. That is longer than either Calgary or Montréal, which both topped-out at 2 days in-a-row. Winnipeg and Ottawa have both gone 4 days. And Regina and Toronto both went 5 days, in 1931 and 1911 respectively.
Hopefully this has been an exhaustive and trivia-filled look at heatwaves in Canadian cities. We will be back with a Part 3 to look at how the number of hot days doesn't seem to have changed much over the years. And in a week or so we will see how this latest heatwave compared for Edmonton and the other cities.
No comments:
Post a Comment