This is Part 3 of our primer on heatwaves. In
Part 1 we looked at Edmonton's previous heatwaves, and in
Part 2 we compared those to other cities around the country.
(if you are reading this in the distant future some of the dashboards below may have updated to reflect new data or formatting, or they may be broken, or they may no longer make sense. To see the original images for this post refer to this twitter thread.)
If your read Parts 1 & 2 (they're super interesting) you might have noticed something strange: heatwaves don't seem to be more frequent today than they were 50 or 100 years ago. What's the deal?
We will not be able to solve that mystery - it will be left to the real climate scientists out there. But we are going to point out a few interesting bits of data, and why a laser focus on heatwaves and broken records misses some of the other stuff which is going on.
We won't recap all of Parts 1 & 2 again here, but this chart from Part 2 gets to the heart of the question:
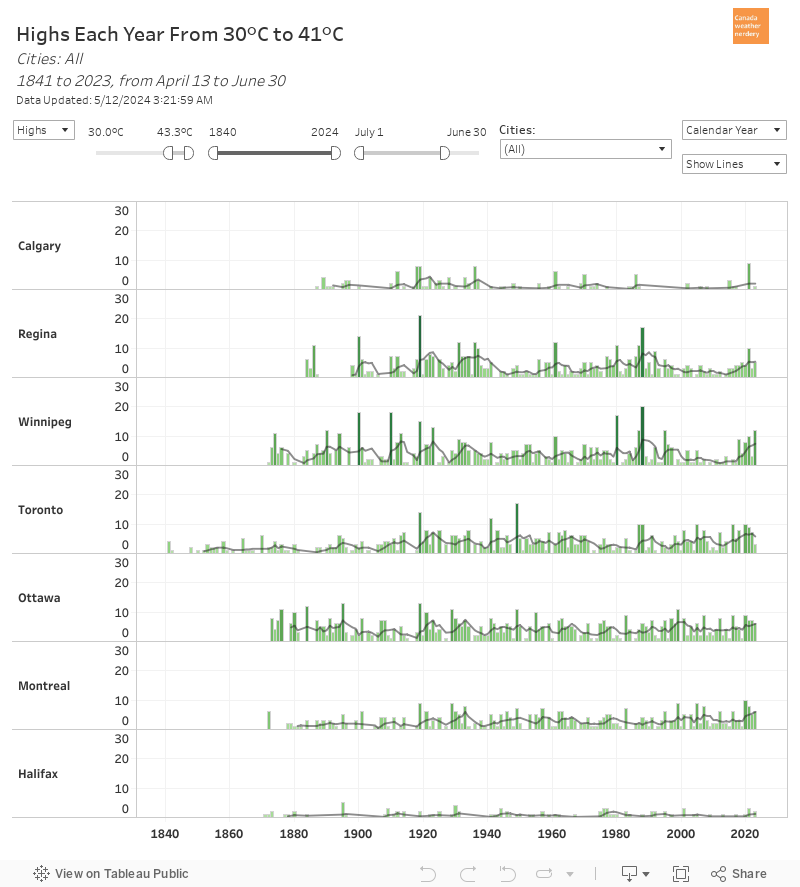
30°C Days Each Year
Here we have the number of 30°C days each year for 7 Canadian cities, going back to 1880.
(Vancouver and St. John's don't get enough to bother including here, but they can be accessed from the dropdown on the upper right)
And the thing is...they're pretty flat, huh? Edmonton, Regina and Winnipeg all had a bit of a peak in the mid-1930s for some reason. For Calgary that peak was around 1920, for some reason. And for the central Canadian cities there was a bit of a lull around 1980 for some reason, and then recently things have climbed back up again.
This is just the 30°C days, but we see something similar at 32°C, 35°C, and even 28°C. There hasn't been a huge increase in hot or super-hot days each summer.
So does that mean that summer is not getting warmer? Let's take a look...
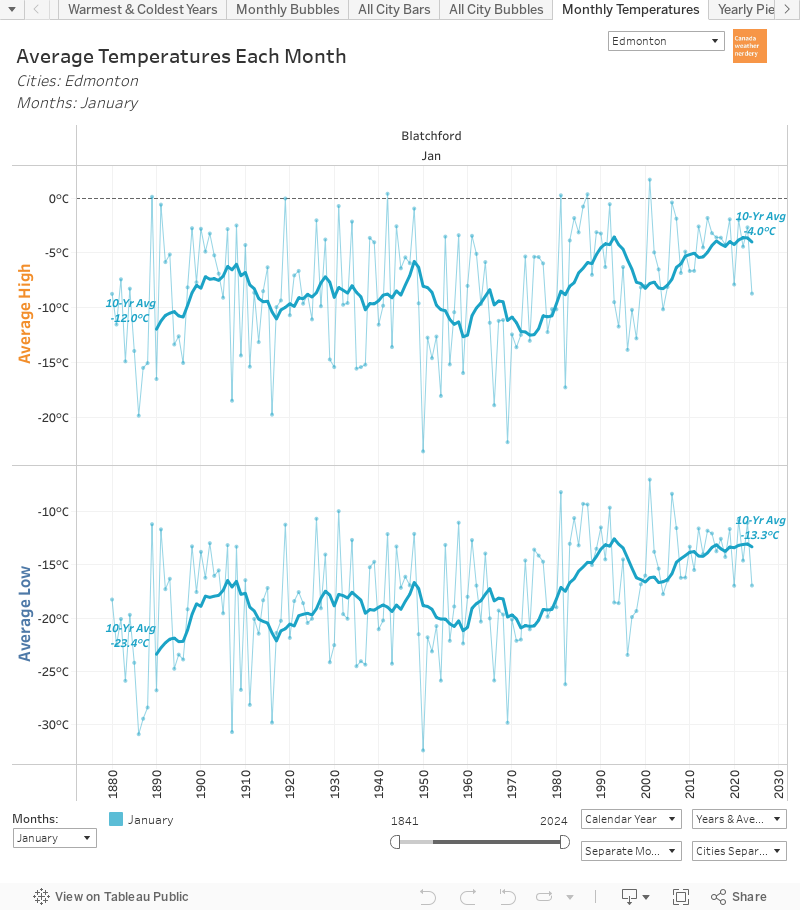
Average Summer Temperatures in Edmonton
Here we have the average High and Low summer temperatures for June, July, and August in Edmonton. Since 1880 our summer High have been fairly flat: up by 0.7°C in June, 1°C in July, and 1.2°C in August. In comparison the Lows for June are up by 3°C, and for July and August they're up by 4°C.
A 1°C change in Highs over 140 years isn't nothing. But when that 1°C is spread over an entire month it hasn't been enough (so far, anyway) to push average ~23°C days up into 30°C heatwave territory.
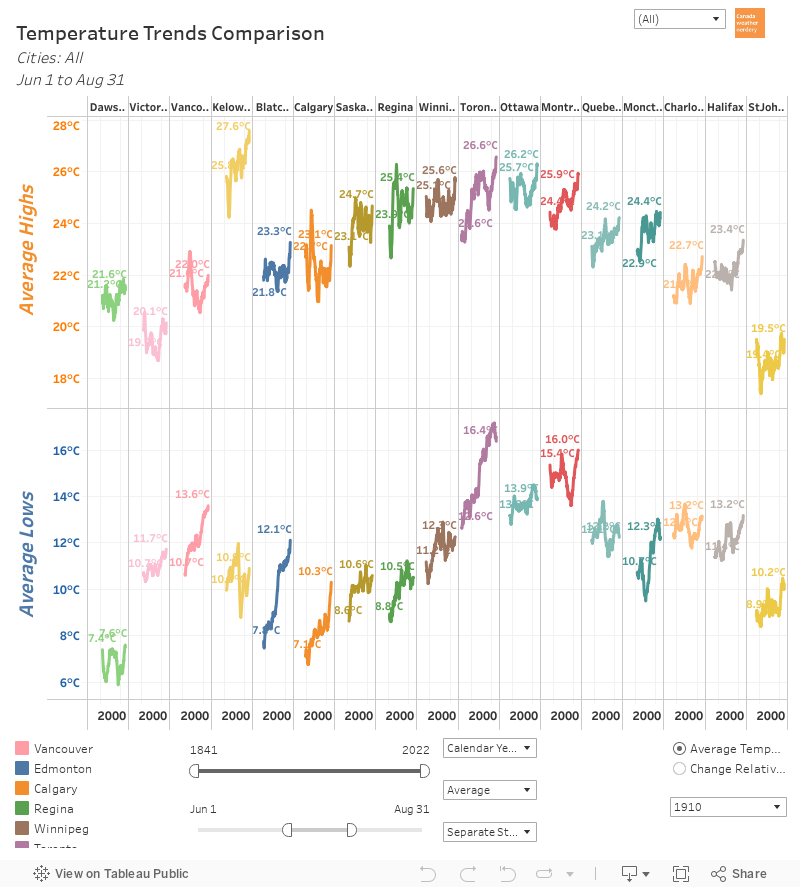
Average Summer Temperatures Across Canada
Here we have the same idea, with the average temperatures for June, July and August combined for each of these cities.
For all of these cities the Highs have been fairly flat:
- Vancouver had a weird spike around 1930, but is now at the same level as a century ago.
- Edmonton is up by 0.9°C.
- Calgary had a weird spike around 1920, but is flat over the century.
- Regina had a weird spike around 1940, and is up by 1.1°C.
- Winnipeg also had a spike around 1940, and is up by 0.4°C.
- Toronto has 40 years more history than most of the other cities, and is up by 3°C.
- Ottawa is up by 0.5°C.
- Montréal is up by 1.4°C.
- St. John's is flat overall.
Of all of these cities Toronto and Montréal are the only ones which have had a reasonably consistent increase in their Highs. And then Regina and Edmonton are next with more wobbly paths to their 1°C increases.
For the Lows Vancouver, Edmonton, Calgary and Toronto are all way up, by 3~4°C. Below that Regina, Winnipeg, and St. John's have warmed by 1~2°C. And for Ottawa and Montréal the Lows have been fairly flat.
So the point of all of this is that during the summer everyone always wants to talk about the High temperatures, with their heatwaves and new records. But for a lot of Canada (especially western Canada) the Low temperatures are the real news.
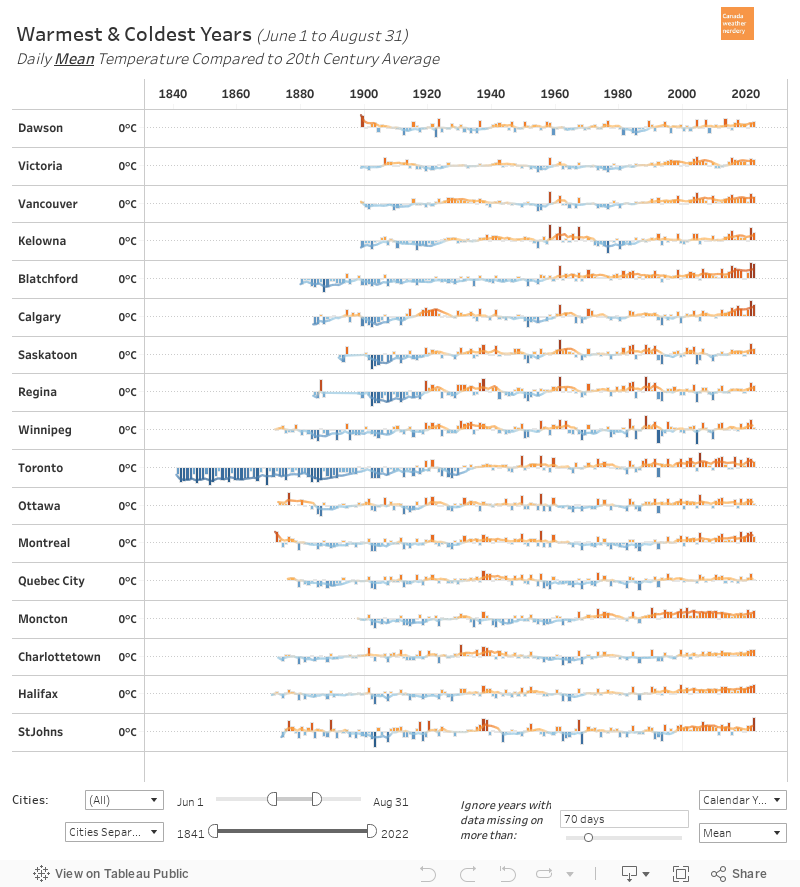
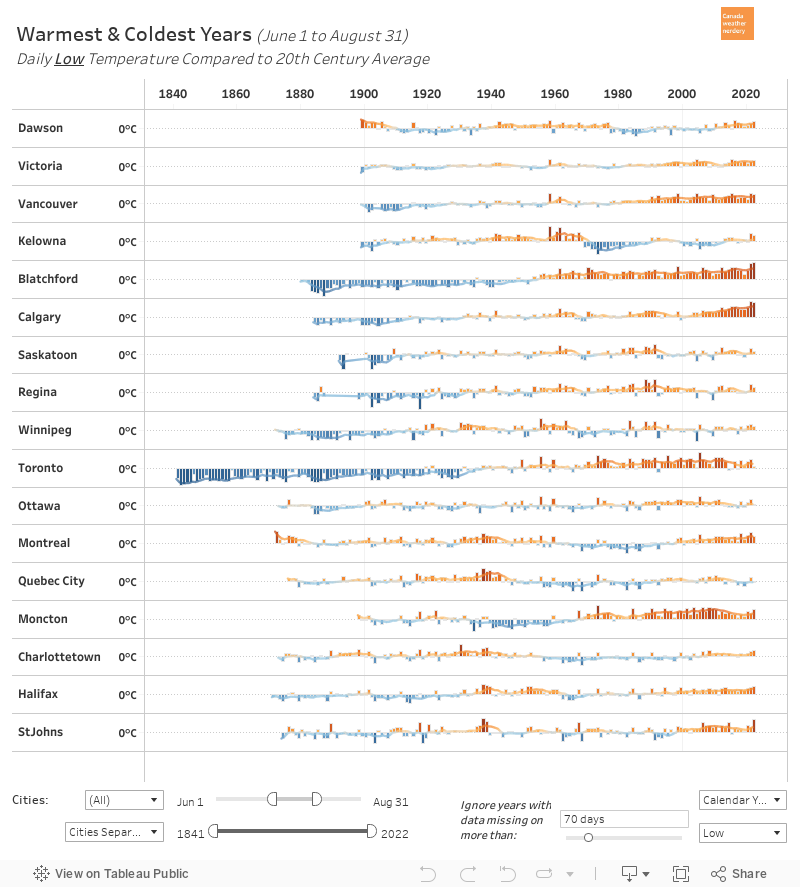
Warmest and Coolest Summers
This is another way to look at it, with the history of the warmest and coldest average High temperatures during the summer, compared to the 20th century average. Cities like Edmonton, Calgary, Toronto, Ottawa and Montréal have seen a number of warm summers in recent years, but generally the warm/cold mix is fairly all over the place.
But meanwhile for the Lows...
For the average summer Low temperatures Regina, Winnipeg and Ottawa haven't really seen anything special recently. But all of the other cities have had lots of orange bars since 2000.
It's just cities though, right?
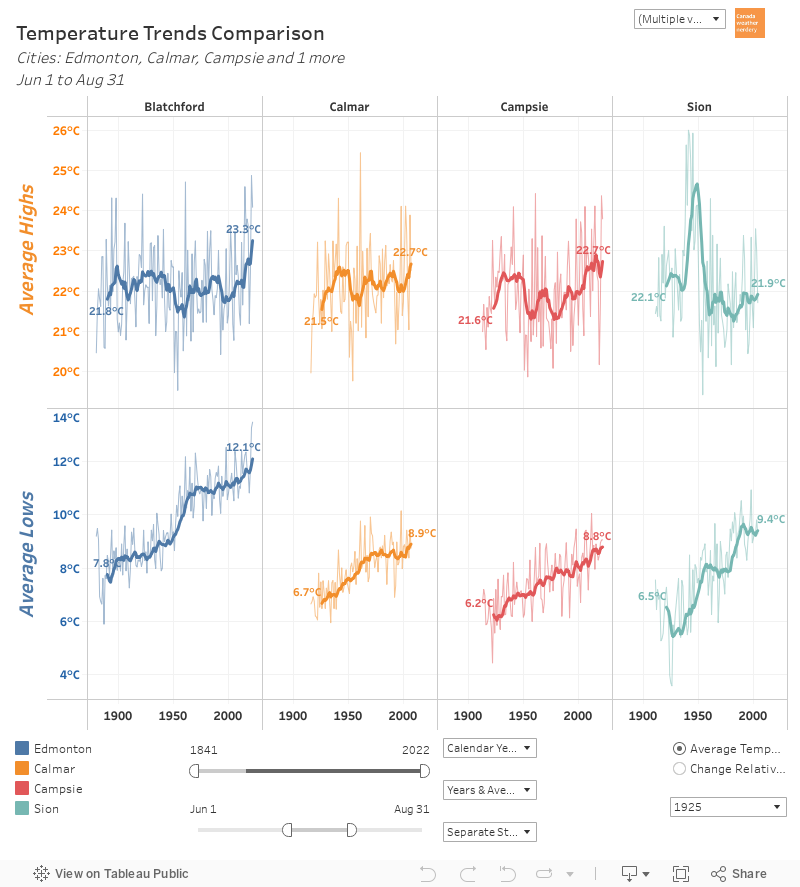
A reasonable assumption is that the reason the Highs and Lows have increased is because Toronto, Vancouver, Edmonton and the others are cities, and cities are warm. And so here we have the average Highs and Lows for June, July and August again, but this time it is for Edmonton and 3 nearby rural stations.
Again we see Edmonton's flat~ish Highs, and a big increase in Lows. But we see something similar for the rural stations as well.
(What was going on with Scion's High temperatures around 1950? No idea. It only happened to the Highs and not the Lows, and it's only at that station, and it's a mystery.)
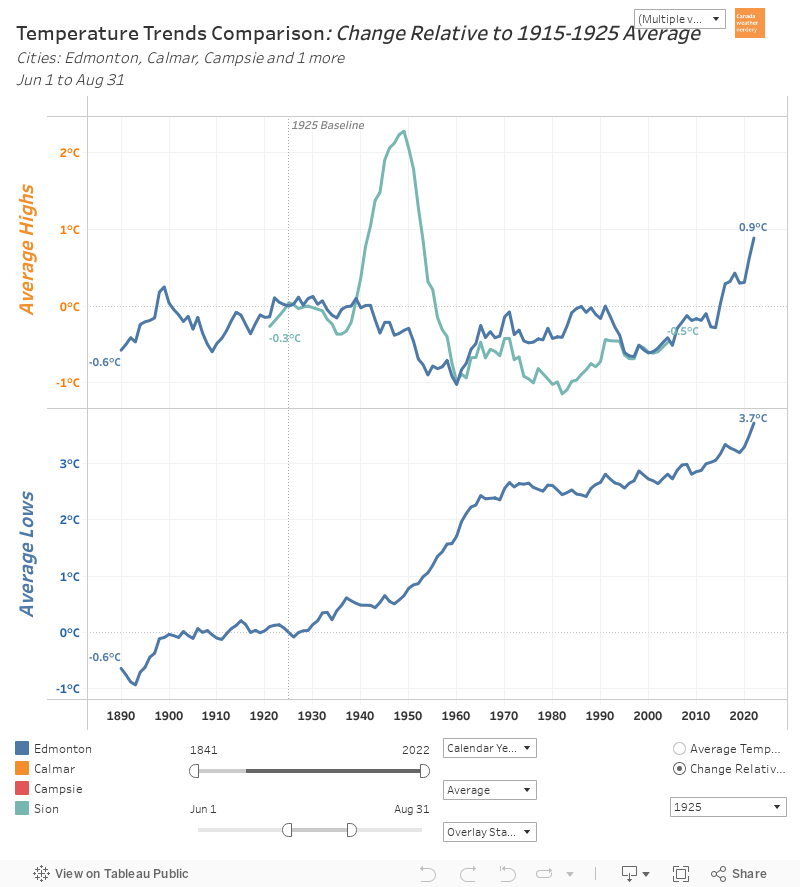
This chart has the same data as the previous one, but to make it easier to compare here the temperature changes are relative to 1915-1925, when the recordings for the rural stations all started.
Viewed this way Blatchford's Highs warmed a little bit less that Campsie and Calmar, and its Lows warmed a little bit more. Scion is all over the place, and its Highs were similar to Edmonton's, while its Lows were the warmest of the batch.
The point of all of this is just to show that Edmonton's warming isn't only because it is a city. The rural stations aren't a perfect match to Edmonton, but they are not flat and have warmed along with the city.
Rural versus Urban Across Canada
And finally, here we have one more example of urban and rural stations across Canada. It's tough to find rural stations with long temperature histories, and these 5 are some of the best that Environment Canada has got.
There is a lot going on here, but the point again is that cities do not warm only because they are cities. The Lows for the rural stations in BC, Alberta, Saskatchewan and Ontario all look very similar to their big city neighbours. And for the Highs for the BC, Alberta and Quebec stations all look like their cities.
Again, these definitely aren't a perfect match. But warming also definitely is not limited to the big cities.
One day here at Edmonton Weather Nerdery we will do a giant series of writeups on the heat island effect, and the temperature differences between urban and rural stations. Today is not that day though, and so we will leave things with this quick comparison of a few cities and their neighbouring stations.


No comments:
Post a Comment