
High Temperatures

The High temperatures started the month right at the bottom of the 30-year range, with 3 30-year-coldest Highs on the 1st, 2nd and 12th. And we finished the month with 12 days above average, including a 30-year-warmest High on the 29th at 21.5°C.
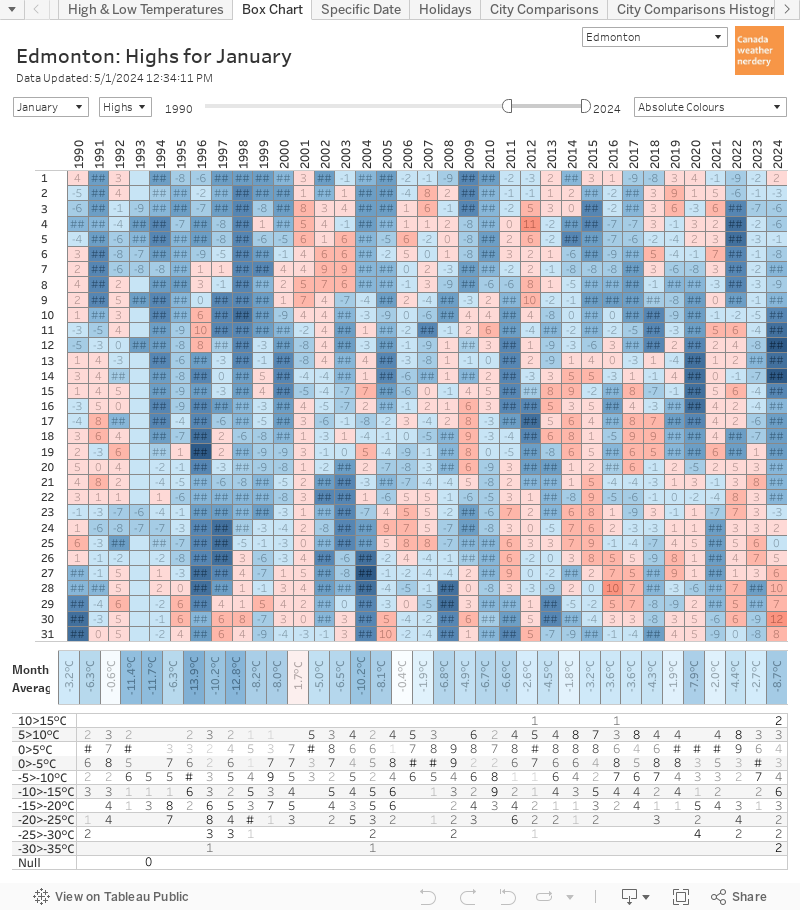
Looking at the numbers, we had 1 High below -10°C with a -10.9°C on April 1st. The last time that we had a High below -10°C in April was almost 40 years ago, with a -12.4°C on April 2nd, 1982. We also had 3 other Highs below -5°C, compared to the April average of about 1.
On the warmer side of things we had 2 Highs hit 20°C, with 20.3°C on April 20th & 21.5°C on April 29th (and the 21st came very close, with 19.9°C). April averages about 2 Highs at 20°C, and recently 2015, 2016 & 2018 also had 25°C days.
April's average High of 8.1°C wasn't as cold as recent years like 2002's 4.3°C or 2013's 5.2°C, but it was still on the cooler side of recent years.
Low Temperatures

The Lows also started the month right at the bottom of the range, with 3 30-year-coldest Lows on the 1st, 2nd & 12th. Things warmed up to above average at the end of the month, and the Low of 7.1°C was a 30-year-warmest Low.

The Low of -20.8°C on April 2nd was the first -20°C in April since -21.7°C way back on April 3rd, 1982. We also had two more Lows below -15°C, and since 2000 only 2002 and 2018 had any temperatures that cold. In total we had 6 Lows below -10°C, and on average April on has 1.2 of those.
On the warmer side of things we had 12 Lows above freezing, compared to an average of about 14.
April's average Low of -2.7°C was warmer than the -5°C in 2002 or -3.5°C in 2013 & 2018. but it was still cooler than most recent April.
Warm & Cold Months

Here we have a history of the average of the High temperatures for each April. April is one of the few months (along with October) where the average temperatures have stayed fairly constant over time.
2020's 8°C was below the recent average and the longterm averge. But it was above recent cool years like 2002 & 2013. It was also far above our coldest April's like 1920, 1948 & 1954 which averaged around 2°C, or almost 6°C cooler than April 2020. Overall it the Highs ranked as #107 warmest since 1880.
If you flip this chart to show the Lows, 2020's -2.7°C was again below average, but was similar to 1997, 2008, 2013 & 2018. And then years like 1887, 1948 & 1954 were down below -7°C. The Lows ranked as #103.

When we add up the Highs & Lows, April 2020's mean temperature of 2.7°C was -1.9°C cooler than the 20th century average, which makes it a medium-sized blue bubble on our chart here. March 2020 was similarly cool, at -1.5°C below the 20th century average.

And April wasn't just cool in Edmonton. All 9 of the cities which we have data for came in cooler than the 20th century average. Regina's very cool April was -2.9°C below their average, which followed a warm March for them at 3.9°C above their average.
And for some trivia, two years ago April 2018 was another month of mostly blue bubbles, with Vancouver as the only city above its average.

As always, this chart is more about looking cool than being readable.
But the circles down at the bottom do a nice job of showing our progression through the year so far. The orange & blue spikes of the 20th Century Average circle show when we were warmer or colder than normal. And the blue of the Compared to 0°C circle shows our long stretch of below-freezing average daily temperatures, and the recent shift to above-freezing days.
Snow
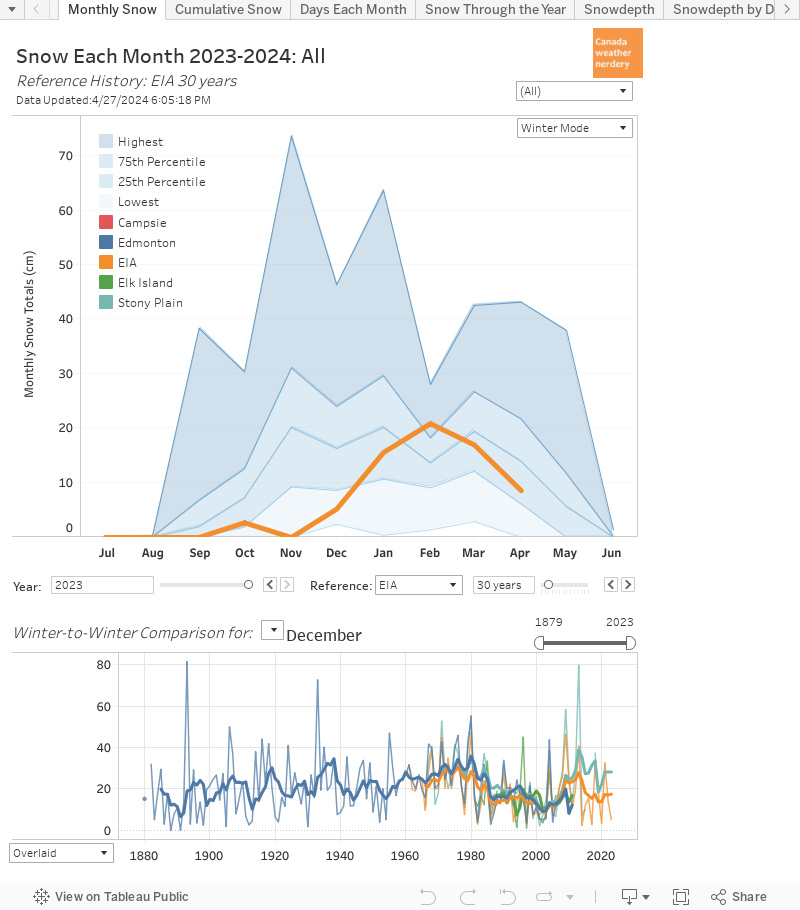
If you are curious about snow we already looked at that in exhaustive detail in:
The gist of that was that we had a fairly unremarkable year in terms of snowfall: most months were pretty average, with February & March a little bit high, and now April fairly low at 5.5cm. So far the total snow of 125.6cm for the winter of 2019-2020 is basically a perfect match for our yearly average.
Snowdepth

If snowfall this winter was sortof boring, the snowdepth was a bit more interesting...if only because it lasted so very long.
Blatchford's last day with snow on the ground was April 15th, and at the International it was April 21st. Since records began in 1955, only 4 years had melts later than April 21st: April 25th 2013, April 22nd 1974, April 24th 1967 & April 23rd 1965.
And we talked about all of that, and took a look at some of the other Canadian cities in the big Winter-in-Review.
Precipitation

We haven't looked at this chart for Total Precipitation (Rain + Snow) in forever, but both Blatchford and the International were well below April's average of 29.5mm.

For 2020 so far the International's 77.2mm of Precipitation is close to the average, while Blatchford's 55.5mm is a little low. But mid-May is when our monsoon season usually starts and the rain really ramps up.
May Temperatures


Looking ahead to next month, May has not had a High below freezing since 1959. But last month I said that April hadn't hit -20°C since 1982, so who knows how things will go? About one third of the time we will have a few days that stay below 5°C.
On the other side of things we should probably see a week or two of days above 20°C. And May 2015, 2016 & 2017 all had almost a week of 25°C days, while 2018 had almost 2 weeks. And we have hit 30°C in for 4 May's in-a-row, from 2016-2019.
For Low temperatures, about a quarter of the time our final frost will be in April, and so May will have no Lows below 0°C. More typically though, May will have a handful of frosty nights.
And no one want to hear this, but the International records snow about half of the time in May. Recently May 2016, 2017 & 2018 were snowless, but 2014, 2015 & 2019 all had sizeable snowfalls.
No comments:
Post a Comment