
Today is the start of what will be a multi-part look at wind in Edmonton. We have never really talked about wind before, but we are going to make up for that right now with an epic odyssey of posts and charts.
Hopefully at the end of it we will have answered a whole bunch of questions about wind...or at least provided some pretty dashboards to dig further into the data.
For this we are using two types of data for both Blatchford & the International Airport:
- Hourly windspeed
- From Environment Canada: "The average speed during the one-, two- or ten-minute period ending at the time of observation."
- Daily speed of maximum gusts
- From Environment Canada: "The gust is the maximum or peak instantaneous or single reading from the anemometer (the instrument used to observe wind speed) during the day. The duration of a gust typically corresponds to an elapsed time of 3 to 5 seconds."
- At Blatchford the Hourly windspeed data is missing for 2005 through 2015, and the Daily gust data is missing for 1995 through 2015. That's unfortunate, but what are you going to do?
There is a lot to talk about here, and so we are going to break it down into bite-sized chunks.
To get things started we will look at what is perhaps the most important question:
Is it windier than it used to be?
The short answer is: No.
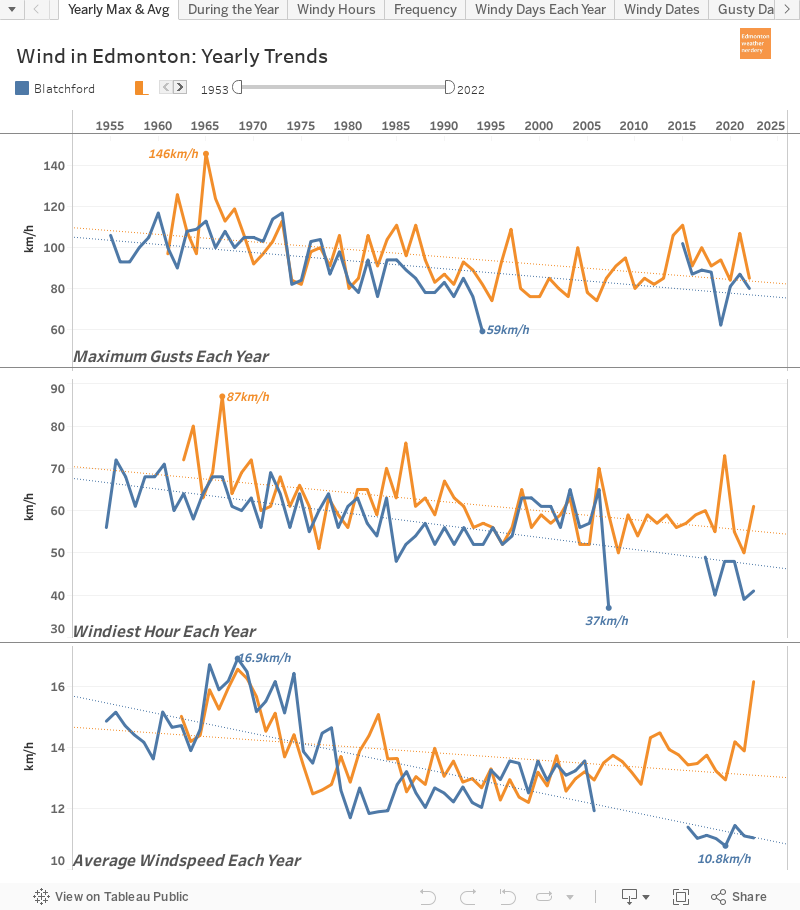
This chart shows three things:
- the maximum daily wind gust each year
- the windiest hour each year
- the average windspeed each year
And all three of those metrics are down from when records began in the 1950s & 1960s.
Blatchford's Lost Years

One thing to point out is the gaps in Blatchford's data, and that when recordings resumed in 2015 things were quite a bit lower than they used to be. We will look at how these gaps affect the Blatchford data in later parts of this series. But generally:
- The average windspeed was very high in the late 1960s at 16-17km/h, and by 1980 had fallen to 13km/h. It hung out there until the readings stopped in 2005, and since 2015 it has been below 12km/h.
- The windiest hour each year was around 60-70km/h in the late-1960s, dropped to 50-60km/h for the 1980s and early-1990s, and then bounced back up a little bit for 1995-2005. But since 2015 it's been way down around 50 km/h.
- The strongest gust each year was on a slow decline from about 110km/h during the 1960s to 90km/h by the 1990s. And since 2015 it's been in the 90km/h range again.
The International Airport

For the International:
- The average windspeed was also very high in the late 1960s at 16-17km/h, and by 1990 had fallen to 13km/h. Focusing on the range from about 2000-2020, it is fair to say that the average windspeeds have maybe edged up a bit.
- The windiest hour each year was around 60-70km/h in the late-1960s, but since 1990 it has typically been in the 50-60km/h range.
- The strongest gust each year was in the 100-120 km/h range in the 1960s, but dropped to the 80-100km/h range from about 1980 onward. And in the past few years there's maybe been a tiny bump, but it's below the 1980s and well below the 1960s.
"Is it windier than it used to be?" is a complicated question, because new construction and development can definitely create localized windtunnels in certain areas. But if you are standing in the middle of an airport, a soccerfield, a golfcourse, or in the rivervalley, theoretically it is less windy now than it used to be.
Continued in Part 2: When is it windy?
No comments:
Post a Comment