
We will start with the big news: 2019 was Edmonton's 54th warmest year since 1880, with an average temperature 0.4°C warmer than the 20th century average.
Warmest & Coldest Years
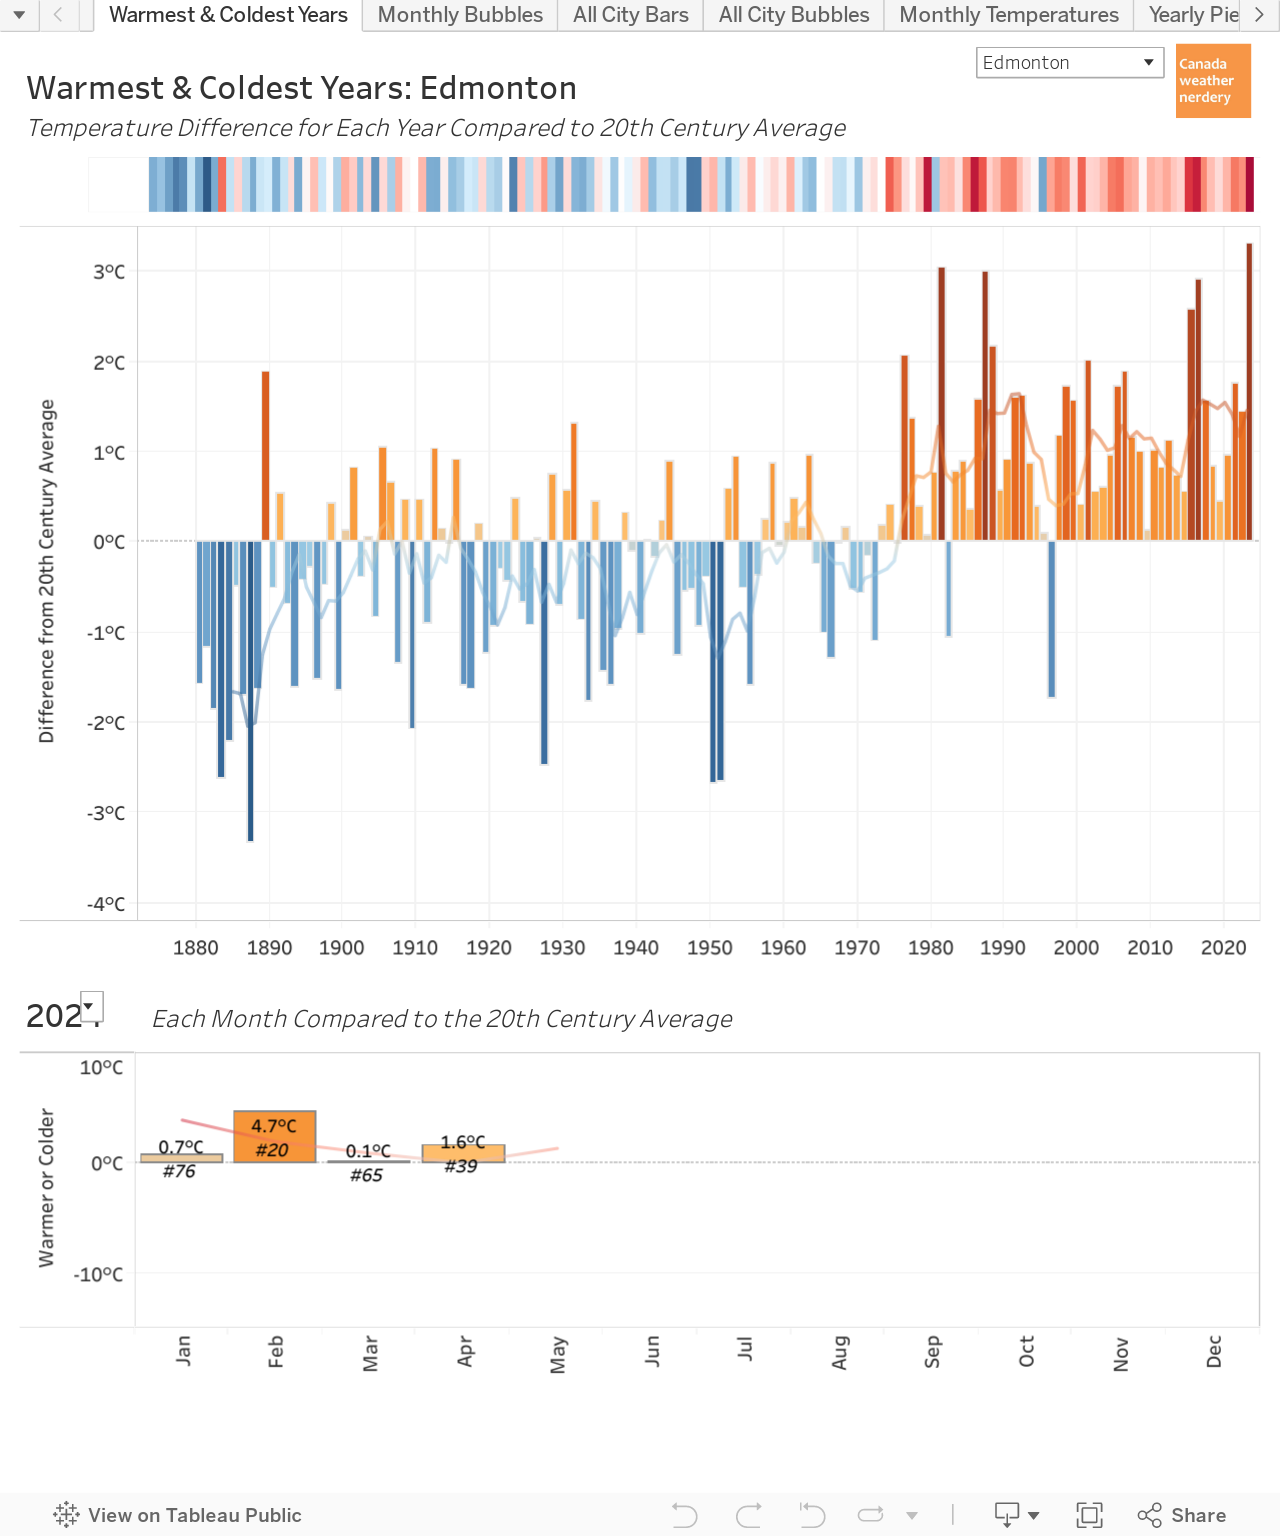
This chart lets us compare all of Edmonton's warmest & coldest years, going back to 1880. The explanation is in Edmonton's Warmest Years, but it essentially averages all the temperatures for an entire year, and then compares that to the average for the 20th century. The National Oceanic and Atmospheric Administration use the 20th century average as their baseline, and that is why we are using it here.
2019 appears in the top part of this chart as the bar furthest to the right, and while it was warmer than the 20th century average it was the coolest year since 2009.
The bargraph at the bottom of this chart shows how warm or cold each month of the year was. And the story of 2019 was:
- Fairly warm January
- Very cold February
- Slightly warm March & April
- Very average May, June, July & August
- Slightly warm September
- Cool October
- Warm November & December
Overall 2019 was the coldest year since 2009, which was only 0.1°C warmer than the 20th century average. Since 1976 Edmonton has only had two "cold" years: 1982 at -1.1°C below the 20th century average, and the most recent was 23 years ago in 1997 at -1.7°C below.
Today we will be focusing on Edmonton, but all of the dashboards here also include data for 8 other Canadian cities: Vancouver, Calgary, Regina, Winnipeg, Toronto, Ottawa, Montréal & St. John's. And for those cities 2019 was warmer than the 20th century average in Vancouver, Edmonton, Montréal, with all of the others having a cool 2019.
Here is how things looked across the country:

Update your climate scarves accordingly:

The Horse Race
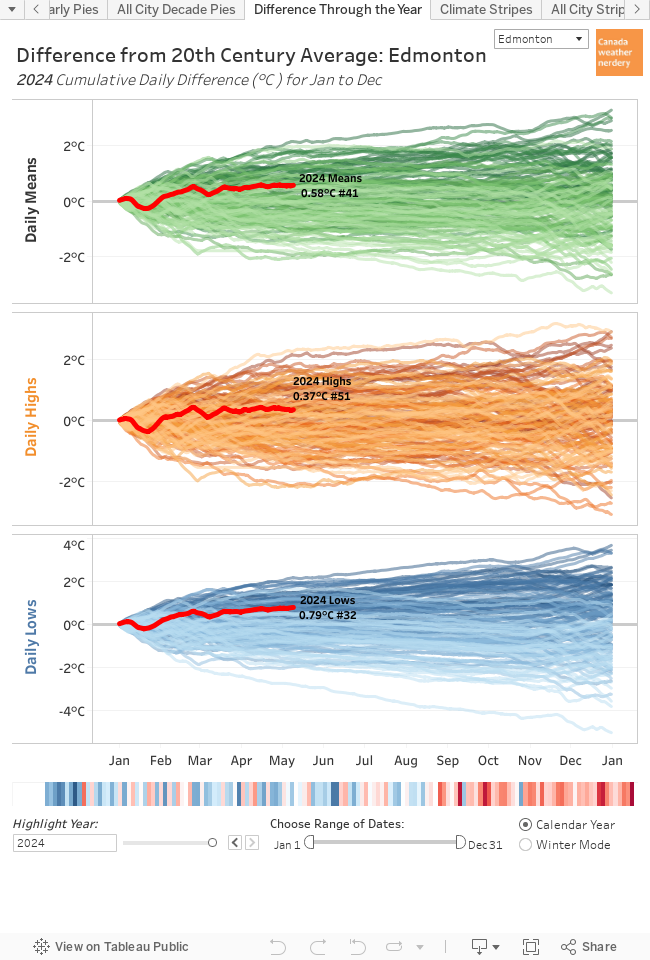
This chart is a little complicated, but it helps to explain where that "54th warmest year" and "0.4°C warmer than the 20th century average" actually come from.
On a day-by-day basis this tracks how much warmer each day was compared to the 20th century average. Warm days get points and push the red lines upward, and cold days lose points and drop the lines down. Things climbed through the warm January, took a dive during the cold February, and then were fairly flat until the end of the year when November and December pushed it up again.
This is broken into Means, Highs, and Lows because the Mean temperature for 2019 was 0.44°C warmer than the 20th century average, but the Highs were actually -0.01°C colder, and the Lows were 0.9°C warmer. 2019 was below average for most of the year until December gave it a final push up to the "warm" side, and the only reason that 2019 counts as a warm year is because of the Low temperatures.
Every year takes its own path, and all of them are available in the dashboard above. Here are the last 5 years as a quick example of the differences:

Warm & Cold Months

In this chart each month for the last 20 years appears as a bubble. Orange bubbles were warmer than the 20th century average, and blue bubbles were colder. The size of the bubble represents how warm or cold it was, and if you hover over them you will get a bit more information. Here we are back to using the Mean temperatures again, but with the dropdown on the lower right you can switch to look at the Highs or the Lows.
So we know that 2019 was warmer than the 20th century average, and we know that that was mostly because of the Low temperatures and not the Highs. And we also know that in general 2019 was colder than most recent years, with the exception of 2009. The bubbles here give us a way to compare them:
- January was warm, but so are most recent January's. In the last 20 years our average January temperature has been 4.5°C warmer than the 20th century average. 2019 was even warmer than that at 6.7°C.
- February was a giant blue dot, and was -9.4°C colder than the 20th century average. To find a similarly below-average month you need to go back 40 years to February 1979.
- In the summer months of May, June, July & August there were no particularly warm months. That was very different from the last 5 summers which all had lots of orange bubbles, and most summers have at least 1 above-average month. To find a similarly un-warm summer we need to go back to 2010, 2005 or 2004.
- Getting both a warm November & December has happened 7 times in the last 20 years. But 2019's November & December were not actually as warm as 2018's were.
High Temperatures

Now that we have a sense of how 2019 went, here we have the specifics with the High temperatures for each day of the year. This chart is a little messy when looking at the whole year, but we did set a record for warmest-since-1880 High on January 3rd at 8.6°C. And June 7th was a record coldest-since-1880 High at 8.4°C (0.2°C than January 3rd).
Low Temperatures

And the Low temperatures are also messy. We set records for warmest-since-1880 Low temperatures on January 2nd, June 12th & 13th, and December 3rd.
Really Hot Days (or, the Summer that wasn't)

Here we are taking a closer look at the High temperatures for May through September.
From mid-June through the beginning of September - the summer, basically - there were no long stretches of above-average temperatures. Normally during the summer we will have a warm week or two, but in 2019 when we had a hot day the temperatures immediately dropped backed down to 20°C or even 15°C.
As a comparison, here we have the Highs for the last 5 summer from 2015-2019:

For 2015-2018 we can see a lot more time spent above the average line, and more stretches of 5 or 10 warm days in a row.
So how cold was the summer of 2019?

This chart shows the number of really hot days each year. Right now it is counting days of 25°C or warmer, but that temperature can be changed using the slider.
- 2019 had 20 days which hit 25°C. That's less than half of what we had in the summers of 2014-2018, but it's similar to 2011, 2010, 2005, 2004, 2000, etc. Overall it ranked as #127 out of 140, so it was definitely near the bottom, but it was not unprecedented.
- For 28°C days 2019 had 5 for #108 spot overall. That number bounces around from year-to-year. In recent years 2018 had 19, 2017 had 17, 2016 only had 9, and 2015 had 21. Going back a bit further 2010 only had 2 days which hit 28°C.
- And for 20°C days 2019 had 82, and ranked as #109. 2015-2018 had all been up over 100 days, but in recent years 2004 & 2005 were both down at 72.
So the summer of 2019 was colder than average, but we had seen similar things a few other times since 2000. The cool summer of 2019 followed really warm summers for 2014, 2015, 2016, 2017 & 2018 though, and so we might have gotten used to those warmer years, and that made 2019 feel like more of a shock.
Here is a comparison of the cool summer of 2019 to the even colder summer of 2010:

The Highs for May-September of 2019 ranked as the 98th warmest out of 140, but 2010 was actually in #133 spot.
Really Cold Days

We have looked at 2019's warm days (or lack of warm days), and now we will take a look at the really cold ones. This chart has the Low temperatures for January, February & March.
At the beginning of February the temperatures plunged right to the bottom of our 30-year range, and they hung out there for almost the whole month (with a minor warmup around the 20th).
This was nowhere near as bad as the giant deepfreeze of January 1969, but it was colder than anything we had seen in 40 years and we wrote about it here and here.
It was Edmonton's 5th coldest February, and the coldest since 1979. The average High was -14.3°C and the average Low was -24.4°C.
Across the west it was also Vancouver's 2nd coldest February, Calgary's 4th coldest, and Regina's 5th coldest. In Winnipeg it was also cold (19th coldest), but they just call that February.

This is a version of the monthly bubblechart which we saw earlier, but it is filtered to only show our most extreme months. The bubbles here are for any months since 1880 which were 9°C or more away from the average.
Our very cold February 2019 appears in blue for -9.4°C, January 2006 is in orange at +9.1°C, January 2001 was very warm at +10.8°C, and so on.
Since 1970 there have been 2 of these supercold months (February's 1979 and 2019), compared to 6 superwarm ones. Prior to 1970 the only superwarm month was February 1931 at +9.9°C, and that is compared to 16 supercold months.
The +/-9°C cutoff used here is just arbitrary and is based on February 2019. But while we might occasionally get a supercold month, they have been much less common than they used to be.

Here we have the count of the really cold days each year, and we are using Lows of -25°C as the cutoff.
2019 had 19 Lows of -25°C or colder. That was more than double the average of 9, and it was the most since 1996 which was way, way up at 38.
We can also use this dashboard to look at the -20°C Lows, and 2019 had 29 compared to an average of 22. And for -30°C Lows 2019 had 4 compared to an average of 2.
So 2019 had more really cold days than is typical, but what is really interesting is when it got them:

Here we have the same chart that we were just looking at, but it is zoomed in on the last 25 years to make things easier to see.
In a normal year the really cold days are scattered throughout January, February, March, November & December. But for 2019 the first -25°C was on February 2nd, and the last one was on March 2nd. For -20°C Lows there were 4 in January, and the other 25 were all in February and the first few days of March.
So 2019 had enough cold days for 2 years, and they were basically all crammed into a single month.
Summary:
- 2019 was cool compared to most recent years, but was still 0.4°C warmer than the 20th century average. And it makes 22 years in-a-row that were warmer than the 20th century average.
- For 2019 that warming all came from the daily Low temperatures. The daily Highs were actually just a bit cooler than the 20th century average.
- February 2019 was the revenge of the polar vortex, and was unlike anything we had seen in 40 years. I personally hope that it will be another 40 years before we see the next one, but with climate weirding, who knows?
- The summer of 2019 was not warm, and that was quite a change from 2015, 2016, 2017 & 2018 which had all been top-10-warmest. But summer 2019 was not as exceptionally cold as people might think, because we had colder summers in 2010, 2005, 2004, 2000, 1999, etc.
That brings us to the end of the 2019 Year-in-Review Part 1 - Temperatures. We will be back in a few days with Part 2 to look at precipitation.
No comments:
Post a Comment