
High Temperatures

Here we have the High temperatures for July.
Things cooled-off in mid-June, and those cold days hung around until mid-July. After that we had a few above-average days, but nothing really hot.
Two highs were the coldest-since-1996, with July 1st topping-out at 18.6°C and July 18th way down at 16.5°C. July's warmest day was the 23rd at 29.6°C which is well below any records.

In July 2019 we had 24 Highs of 20°C or more, which is just a bit below the average of 26 days.
We also had 8 Highs hit 25°C, which is below the average of 12. That's not as low as years like 2005, 2006 & 2010 which were all down around 5-6. But it's half of what we have been used to recently, with 2014, 2015, 2017 & 2018 all up at 17-19 Highs of 25°C.
We didn't have any 30°C Highs, which happens about a quarter of the time in July.
And even with the cold start to the month we didn't have any Highs below 15°C (like 2014, 2011 & 2009) or below 10°C (like 2002).
Low Temperatures

In July our range of Low temperatures is very narrow, typically varying from about 8°C to 13°C. And for July 2019 we were mostly below-average, and had two coldest-since-1996 Lows with July 2nd at 7.3°C and July 4th at 8.1°C.

In this chart you can see how little variation there is in our July Lows, with almost everything the same shade of beigey-orange. We did have 6 Lows below 10°C, and that's just a bit more than the average of 4.
Warm & Cold Months

When we add up the Highs & Lows July 2019's average temperature was 17.1°C. That is just a touch colder than the 20th century average of 17.2°C, and ranks this as the 80th warmest out of 139.
The average High of 22.5°C was also below average, in 98th spot. And the average Low of 11.7°C ranked as 55th.
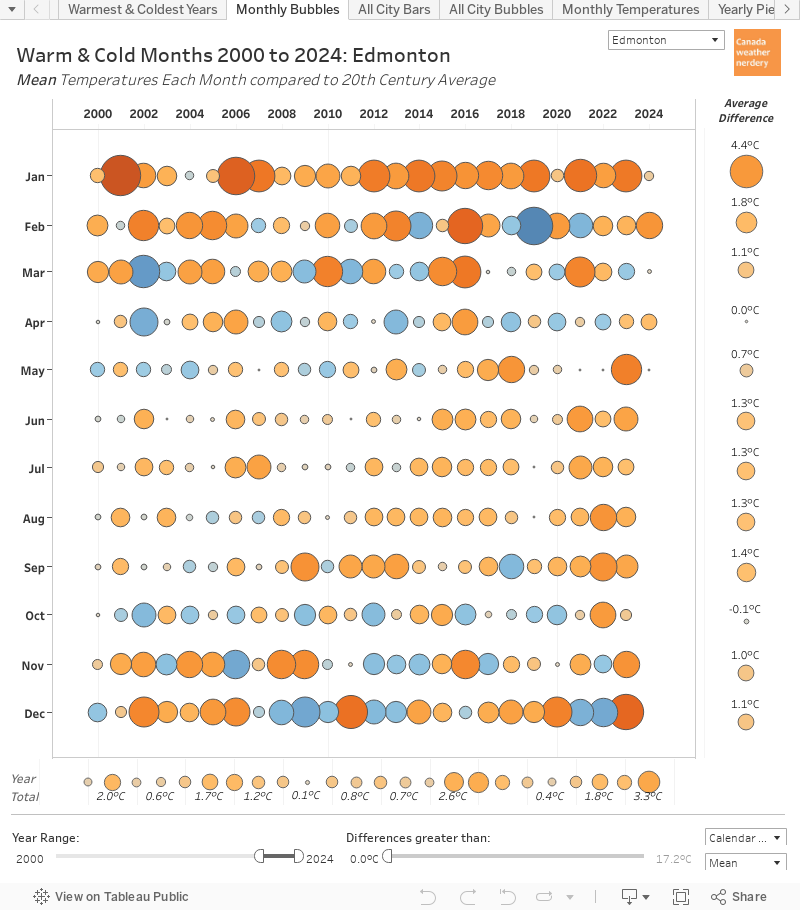
This shows warm & cold months for the past 20 years, with above-average months in orange and below-average in blue. This dashboard is interactive, so you can change the range of years if you want to see all the way back to 1880.
July 2019's -0.1°C below average shows up as a tiny blue dot. July 2014-2018 were all above average, and are all fairly large orange bubbles. And in recent years both 2011 & 2013 had colder Julys than 2019 did.
So July wasn't super-cold, but it wasn't super-warm either. And part of the problem is that July followed an also-not-very-warm June. The last time that we had a cool June & July was back in 2013.
Hot Days

Here's another dashboard which lets us look at the number of "Hot" days that we've had so far in June and July (May 2019 had some warm days too, but everyone forgets about that).
For June & July we had 0 30°C days, compared to an average of about 4. In recent years 2005, 2010, 2011 & 2016 all had no 30°C days in June & July.
For 28°C days June & July had 2, compared to an average of 7. Recently 2010 had 1, and 2011 had 0.
And for 25°C days in June & July we had 12. That's way down from the past 4 summers which were all up over 20. But it was pretty typical for 2008-2013.
So this summer hasn't been that cold, but it's been a lot less warm than the past 4 summer were.
Rainy Days

July is usually a rainy month, and July 2019 recorded 18 days with precipitation at the International, and 20 at Blatchford. The average is 15 days, which is what we had last year. Back in 1996 the International had 23 days with rain, and this year was well below that.
Monthly Precipitation

So we had a few more days of rain than average, but nothing too extreme. It sure seemed rainy though, so how rainy was it?
July is usually our rainiest month, with an average of 92mm at the International. For July 2019 the International recorded 118.6mm, which is right at the 75th percentile, so it's pretty high, but not huge.
Blatchford recorded 43mm more than the International with a total of 163.4mm, and that is pretty high. In recent years only 2001 at the International was higher with 187mm.
And Blatchford also had a rainier June than the International did. For June & July combined the International recorded 204.2mm, while Blatchford was 76.6mm higher at 280.8mm. In a typical year we average about 400mm of precipitation, so a gap of 76.6mm is about 20% of a yearly total.

I don't have a good precipitation dashboard yet, so we will make do with this one for now.
The bottom chart here shows the total precipitation for June & July at Blatchford, going back to 1880. In 2007 Environment Canada switched from recording Rain & Snow to only recording combined precipitation, and that is why the colour changes from blue to green for the most recent years.
With a total of 280.8mm this was Blatchford's 6th rainiest June & July, and the rainiest since 1988 with 297.3mm.
For July alone the 163.4mm made this Blatchford's 7th rainiest July, and the rainiest since 1982 with 175.7mm. We also just saw that the International had a very rainy July 2001 with 187mm.
Year-to-Date Precipitation

When we add up all of the precipitation for 2019 so far this is what we get.
Both the International and Blatchford had a dry spring, with the blue and green lines down in the yellow section through May & early-June. But then the rainy June & July have pushed the International up to the average with 278.4mm, and Blatchford is around the 75th percentile with 333.4mm.
At this time last year in 2018 the fairly dry July had us down at around 255mm, and close to the 25th percentile.
August Temperatures


For August the daytime Highs are above 20°C most of the time, with typically about 25 warm days each month. We also average a week or two of days above 25°C, but 30°C days only happen about half of the time in August. For the Low temperatures it should be a lot of the same 10-20°C orange which we saw for July, but with a few more nights in the 5-10°C range, and every 5 years-or-so a night below 5°C.
No comments:
Post a Comment