
High Temperatures

The High temperatures in October 2019 bounced around the average, with a few warmer-than-average stretches, but overall more colder-than-average days.
The bar graph at the bottom of this chart shows how the Highs compared to the 30-year average, and October 2019's average Highs of 8.6°C was -1.4°C cooler than the recent average. It was still warmer than October 2016 with an average High of 5.7°C, 2012 at 5.9°C or 2012 at 6.0°C.

Looking at the individual days we had one High below -5°C with October 28th at -5.8°C. In the past 20 Octobers there were only two other days with Highs below -5°C: October 31st 2012 at -6.6°C and October 30th 2003 at -6.8°C.
And October 2019 didn't have any Highs which hit 20°C, which only happens about half of the time. The warmest day was the 7th at 18.8°C.
Low Temperatures

The Lows also bounced around the average, with October 10th's -7.1°C right at the bottom of the recent range.
The average Low of -1.7°C was below the 30-year average October Low, but was warmer than 2012 or 2009.

For individual days we had one Low below -10°C, with October 29th at -12°C. The last time that October had a Low below -10°C was 2012, and before that 2002-2004. 2002 was also the last time that October had a Low below -15°C, with October 29 2002 at -16.3°C.
2019 So Far
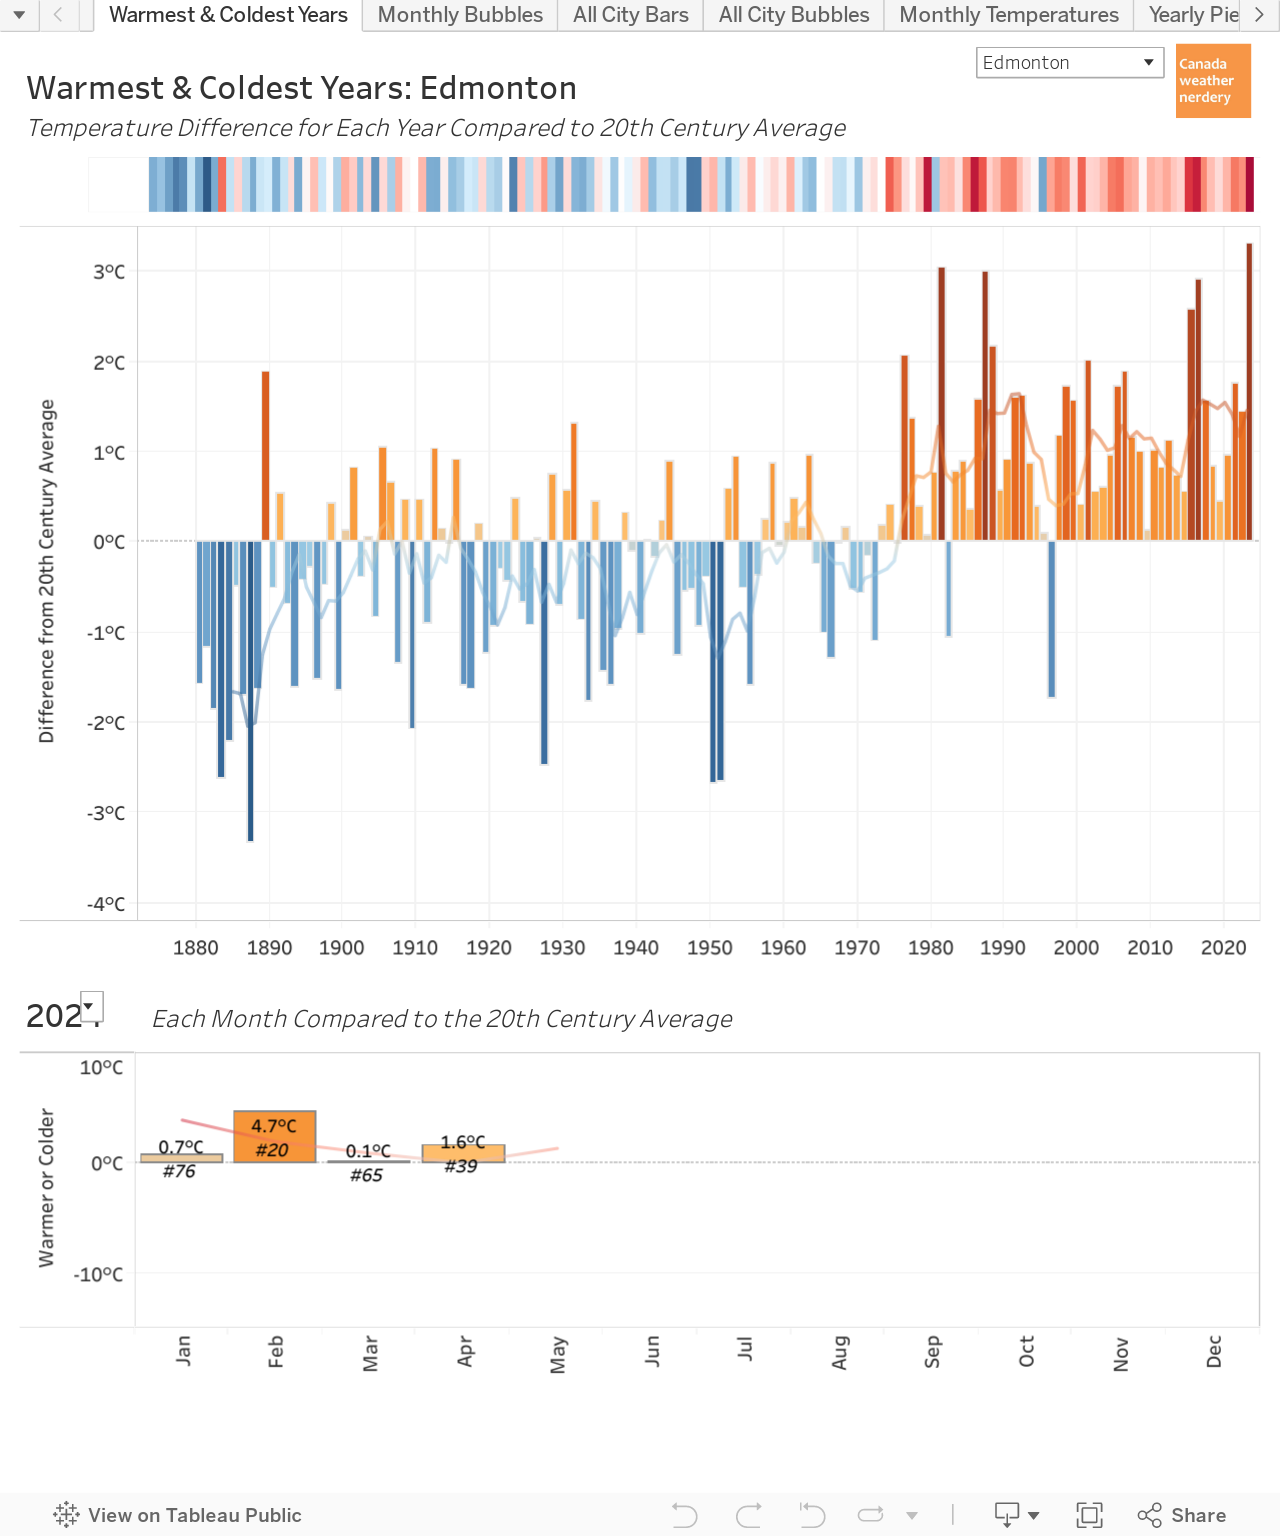
The bars at the top of this dashboard represent how warm or how cold the average temperature each year was relative to the 20th century average. On the far left we have the cold 1880s in blue, and on the right the warm 2010s in orange.
2019 is the small bar on the far right, and as of the end of October so far 2019 is 0.1°C warmer than the 20th century average. That's down from 2018's 0.8°C, 2017's 1.6°C, or 2016's 2.9°C (that was a big el niño year).
Right now 2019 is Edmonton's coldest year since 2009, and the last time that we had a year which was colder than the 20th century average was back in 1996 at -1.7°C below the average. 2019's ranking could still change substantially though, depending on how November and December play out.
At the bottom of this dashboard there are bars which show how warm or cold each month of the year was compared to its 20th century average. 2019 has had a warm January, a cold February, a just-a-bit-above-average March-September, and now October was -2°C below average.
Using the dropdown at the top of this dashboard we cycle through various Canadian cities. October 2019 was Calgary's 15th coldest October, and it was Regina's 9th coldest.
And for 2019 overall, so far it is just a bit colder than the 20th century average in Calgary, Ottawa, Regina, St. John's, Toronto & Winnipeg. Of the 9 cities here only Vancouver, Montréal & Edmonton (just barely) are warmer than the 20th century average so far.
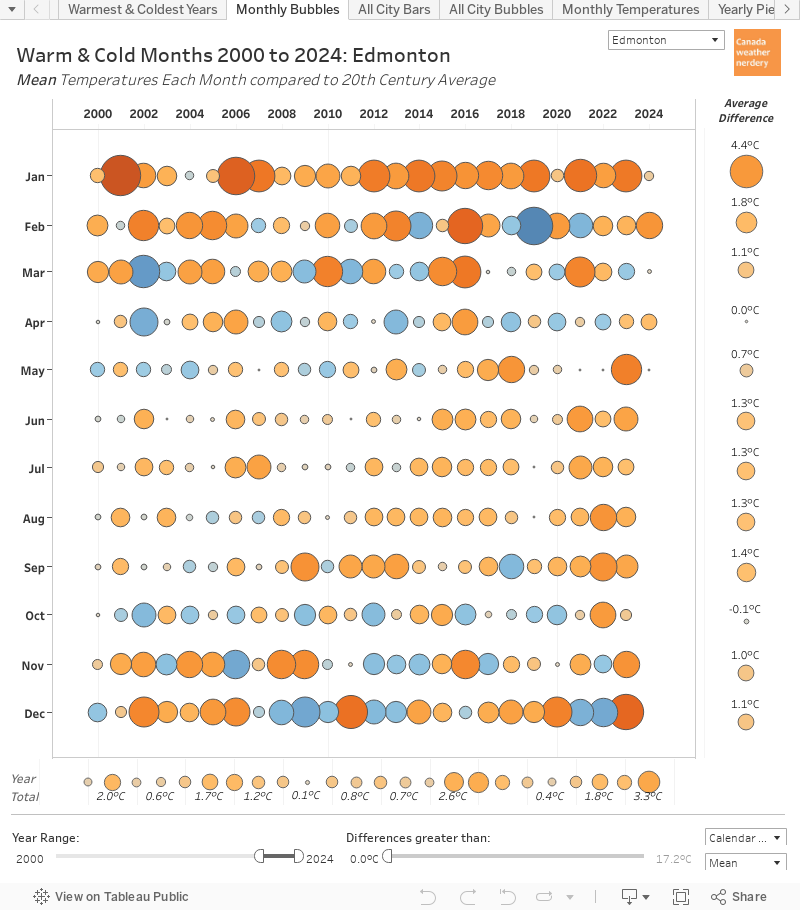
Here we have the recent history of warm & cold months for Edmonton - blue circles were colder than the 20th century average, and orange circles were warmer.
While a month like January has been very consistently warmer than the average, October is much more variable. October 2019's medium-sized blue circle is similar to 2016, 2012, 2009, 2006, 2004 & 2002. Over the last 20 years October's temperatures have actually average 0.3°C colder than the 20th century average (the bubbles on the far right), while January has seem a warming of 4.6°C.
Precipitation

For precipitation (rain+snow) October 2019 was fairly typical with Blatchford at 21.6mm and the International at 14.7mm, compared to October's average of 21.4mm.

And for 2019 overall, so far Blatchford is just a bit above average at 429.3mm and the International is just a bit below at 388.5mm
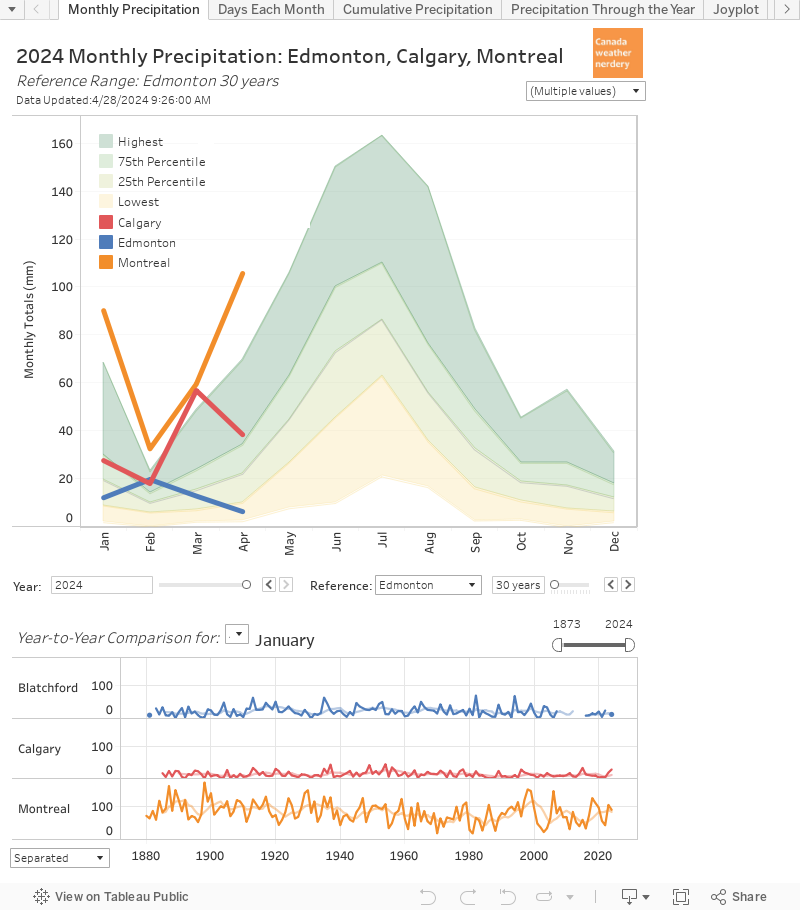
For some Canadaian trivia, Montréal recorded it's most precipitation-y October with 259.8mm, blowing away the old record of 198.4mm.
Snow
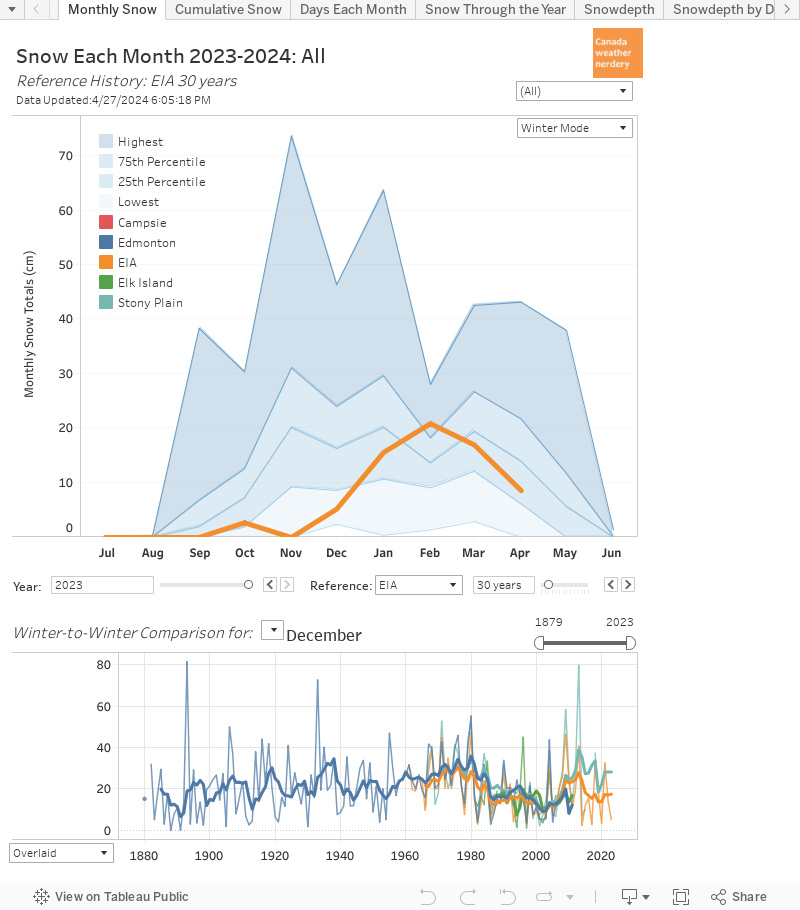
Environment Canada's Blatchford station doesn't record snowfall anymore, but for October 2019 the International recorded 4.2cm. That's below October's average of 9.5cm, and below the 7.8cm we had in 2018, the 14.8cm in 2017, and the 22.2cm in 2016.

The International's first snow of the year was recorded on October 7th. That is later than the past few years which all had September snow, but it's about average over the longterm.

For some more Canadian trivia, Winnipeg just had its snowiest October since 1971. Calgary just had a snowier-than-average October, following its snowiest September since 1972 (and last year October 2018 was its snowiest October ever recorded)
Snowdepth

There's not much to say about snowdepth yet. The bars at the bottom of this dashboard show the history of snow on October 31st, and its pretty sparse. 1984 & 1991 were both bit years with more than 10cm, and 2001-2006 has a bunch of years with snow. Recently 2017 had 2cm at the International.
If you move the date slider over though things start to build up by mid-November, and by the end of November most years had notable snow cover.

Here's another way of looking at how our snow builds up over the year. It usually starts to hang around in early-to-mid November, and then it lasts until early April.
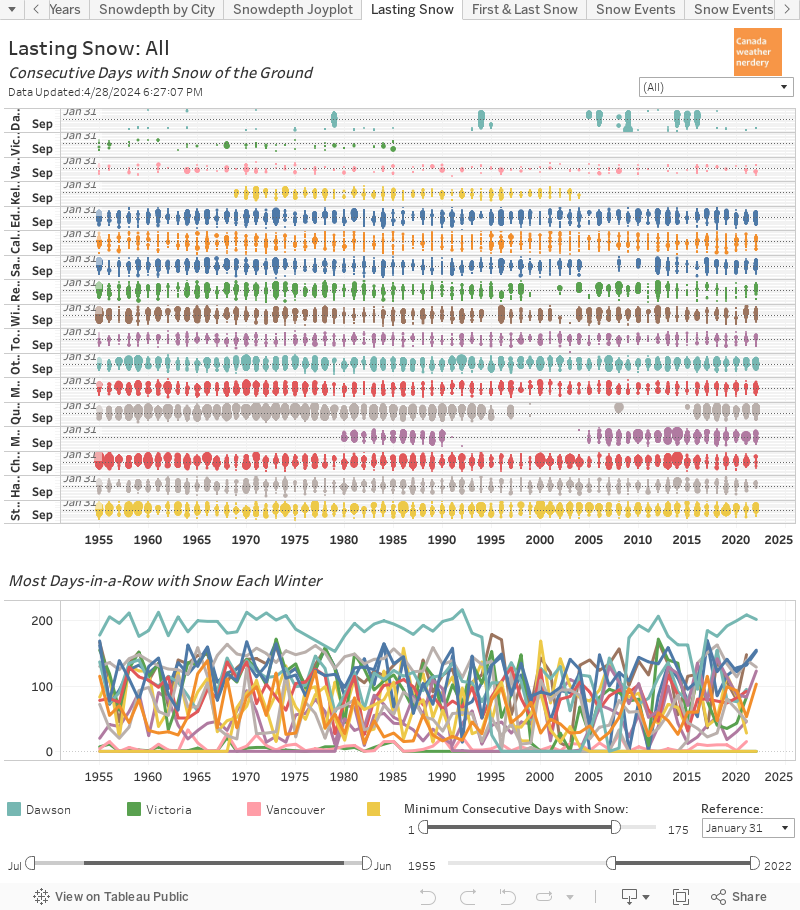
And for some more comparisons, Calgary's snow doesn't actually hang around but disappears and reappears throughout the winter. Winnipeg is similar to Edmonton, with both cities getting about 125 days of consecutive snow on the ground each winter.
November Temperatures


Looking ahead to November are frequently still a lot of days above freezing - recently 2006 had 7 and 2017 had 9, but plenty of years were up around 20, including last year with 19 in 2018. But about half of the time November is when we'll see our first -20°C Low of the winter.
No comments:
Post a Comment