
Total Precipitation
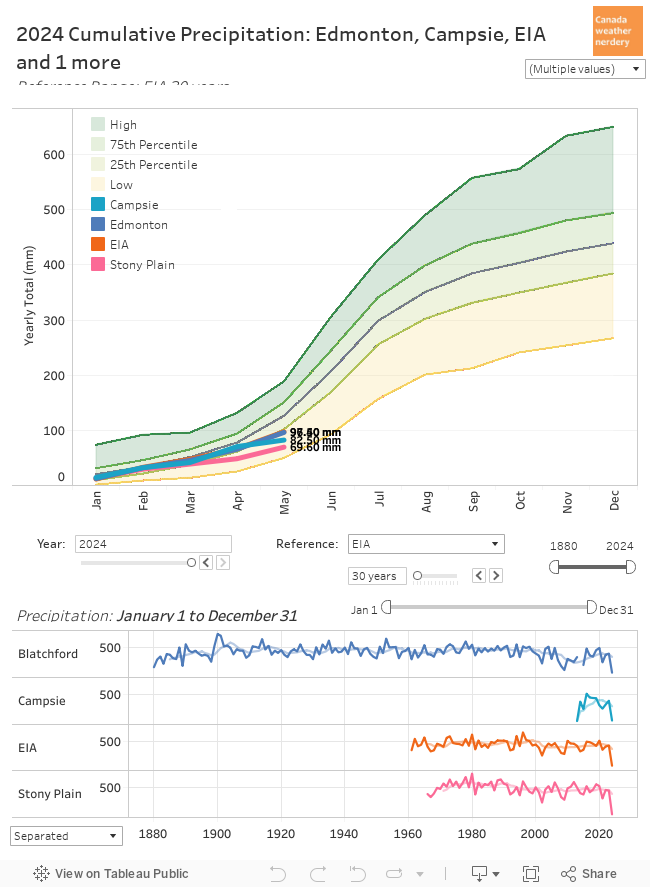
2019 finished the year with 464.7mm of combined Precipitation (Rain + Snow equivalent) at Blatchford, and the International was 35mm lower at 429.2mm. The yearly average is 440mm, so Blatchford was a bit above that, and the International was just below.
That is a reversal compared to both 2017 & 2018 where Blatchford was 100mm below the International.
Other Cities

For comparison, here are the yearly totals for several other Canadian cities, compared to Edmonton's typical range.
- Regina was down at 375mm, which is right on their average.
- Winnipeg isn't shown here because it's too close to Edmonton, but it was at 457mm, and just below their average of 500mm.
- Calgary's 525mm was quite high compared to their average of 435mm.
- Ottawa's 900mm was just below their average of 928mm.
- Toronto's 949mm was well above their average of 813mm.
- Vancouver's 966mm was well below their average of 1,178mm.
- Montréal's 1,196mm was well above their average of 1,031mm.
- And St. John's 1,405mm was actually low compared to their average of 1,610mm (which sounds ridiculous to me).
Today we will really be focusing on Edmonton, but if you want more details on the other cities the overall precipitation is here, and the snow is here.
Monthly Precipitation

Here we are back to Edmonton again, and the stations for Blatchford and the airport.
The two big precipitation stories for 2019 were a very dry spring, and then a very wet summer.
For March, April & May Blatchford recorded only 25.9mm of precipitation, compared to a 5-year average of 87mm for those months. That might actually be Blatchford's driest recorded spring. 2009, 2011 & 2015 all technically have lower totals, but they are also all missing a month or more of data (you can click through them in the dashboard). For years with all 12 months of data the next lowest was 1898 with 27.9mm for March, April & May.
The International recorded 42.9mm for March, April & May. That was more than Blatchford, but it was still in the bottom-5 for the airport, going back to 1961.
In the summer things switched around with a rainy June, and a very rainy July.
The June average is 75mm, and the International recorded 85.6 with Blatchford up at 117.4mm. For July the average is 90.6, and the International was at 118.6mm and Blatchford was way up at 163.4mm.
Blatchford's 163.4mm in July was its 7th highest, and the most since 1982. The record was 282.7mm from way back in 1901. June & July at Blatchford combined for 280.8mm, which was its 6th rainiest June & July, and the rainiest since 1988.
Other than that the rest of the months: January, February, and August-December were all pretty typical.
Days with Precipitation
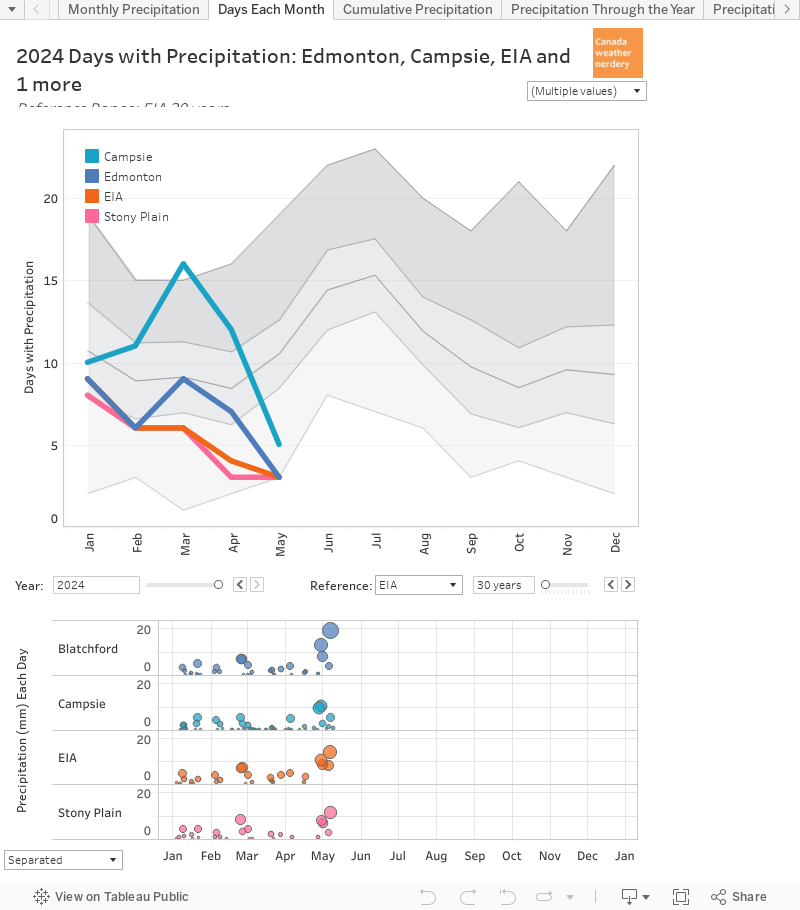
Here we have the days each month that had recorded precipitation.
- January & February were a little high at Blatchford, and were really high at the International. The averages are 10 & 8 days respectively, and the International had 17 & 15.
- March, April & May were all low at both stations, which isn't surprising given the dry spring. The average for those months is 9-10 days, and in March we were down at 2 and 3 days.
- The rainy summer had a few more rainy days than usual. The average is about 15 days, and Blatchford and the International were at 17-20 days.
- September & October had a few more rainy days than average.
- November was well above the average of 9 days, with the International at 13 and Blatchford at 17.
- And we ended the year with an average December.
Big Storms

This chart shows all of the "big" storms with more than 20mm of precipitation for Blatchford. Blatchford used to record snow & rain separately, but that stopped in about 2007, so now we just know that there was precipitation.
And Blatchford had 5 big storms in June & July, with the largest on July 17th at 38.8mm. That's a pretty big storm, and most years will have one day around 40mm or more.
If you switch this dashboard to show the International (at the lower left) it only had one 20mm day, with 25mm on July 19th. And so the big difference in the June & July numbers for Blatchford and the International were because several of the big storms which hit Blatchford mostly missed the airport.
Snow

Switching over to snow, here we have the snowfall for each month of 2019 for the International.
It wasn't a very exciting year, with a slightly low January, slightly high February, slightly low March & April, and then everything else was pretty average.
The total snowfall for the year was 111.2mm, which ranks as #39 out of 58 for the International. The average is around 125mm, so this was a bit low.
Normally when we talk about snow we talk about "winters" (Oct-Apr) rather than the Calendar Years (Jan-Dec) that this dashboard uses. The rest of the charts today will be using winters, and they will be a little bit less straight, but hopefully they will still make sense.
First & Last Snow

Last spring the last snowfall at the International was on May 4th, which was about a week later than the average of April 26th. Looking back over the years that average has moved around, but late-April is right in the middle of the range for both stations.
The first snow of the fall was on October 7th which is pretty average, but which was much later than 2014, 2016, 2017 & 2018 which had all been in early-mid September. The very early snows during the past few autumns have pushed the average date to September 22nd, which is just about as early as it has ever been. It was briefly earlier in the mid-1970s with an average first snow of September 16th. But even 10 years ago in 2010 the average first snow was a month later at October 24th.
So 2014, 2016, 2017 & 2018 were all very early, and 2019's October 7th was more typical, but still on the early side of things.
Lasting Snow
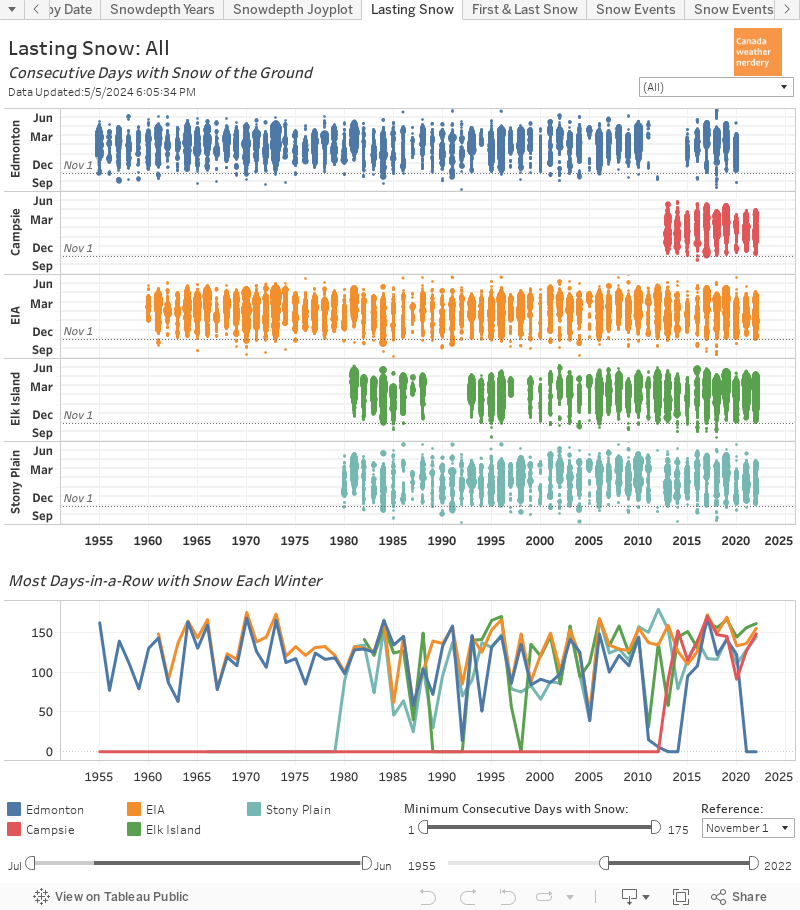
In the spring the snow at the International disappeared on March 31, and for Blatchford it was April 1. That is on the early side of things, although several recent years were earlier.
(Blatchford also shows a blue stripe of 5cm of snow in late May, and that totally did not happen. But it is in Environment Canada's data, but I 100% know that it is incorrect. I'm leaving it here as a reminder that sometimes data that looks weird really, truly is wrong.)
In the fall the snow started to hang around at the International on November 5th. That wasn't as early as 2017 or 2018 which were right around Halloween, but it was still pretty early. For Blatchford the lasting snow started several weeks later on November 27th, and that is fairly typical for Blatchford.
Snowdepth - Spring

This chart shows the snowdepth for the winter of 2018-2019, so the right half has the spring of 2019.
In 2019 February and early-March were very cold, so there was no melting. The snowdepth at both Blatchford and the International were over 30cm, and well over the average of about 20cm.
Once the the cold finally broke the big melt happened quickly. Snowdepth at the International fell from 45cm to 0cm between March 10th and March 31st. Blatchford fell from 37cm on March 9th to 1cm on the 24th, and then hung on for another week before finally melting.
Snowdepth - Fall
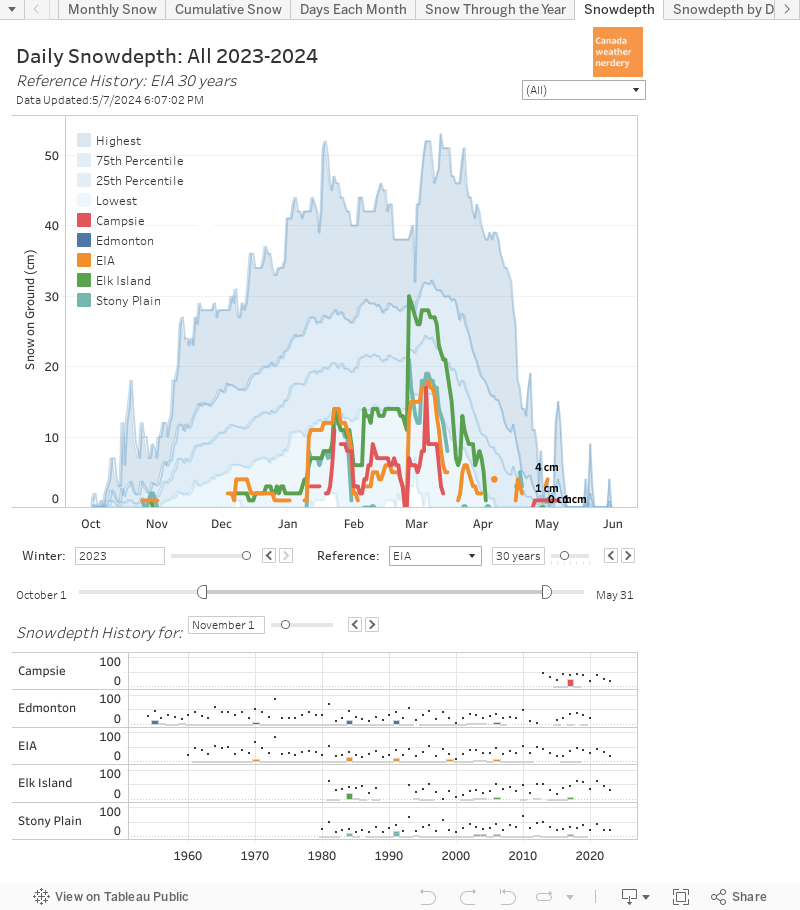
And here we have the snowdepth for the winter of 2019-2020, with the right half as the autumn of 2019.
The snowdepth at both stations spiked at the beginning of November with a big storm, but at Blatchford that melted-off while the International stayed at about 10cm. Both stations gained snow through December, and Blatchford ended the year below average at 8cm, with the International above average at 22cm. (then things spiked again in January).
Snowstorms

Finally, this dashboard shows every "large" snowstorm each winter. Here the cutoff is set to 5cm, but that can be raised or lowered with the slider.
2019 had 2 snowstorms of 10cm or more: March 8th with 12.8cm, and November 9th with 11.4cm.
And there were 2 more storms of 5cm or more: February 1st with 6cm, and April 30th with 6.2cm.
We average about 7 5cm storms each year, but for 10cm storms 1 or 2 is pretty typical.
And that brings us to the end of the 2019 Year-in-Review: Precipitation. The most interesting parts were the very dry spring followed by the very wet summer, and other than that things were pretty normal.
No comments:
Post a Comment