
Last week we saw that since about 2000 we have had below average precipitation. There have been some high years and some low years, but it has mostly been low years. The average for the last 15 years has only been 400mm per year, compared to 470mm for the 40 years before that.

Today I just want to look at recent history, so I'm going to be using data from the International Airport going back to 1995. I want to know what is typical today, rather than the theoretical "normal" that we haven't really seen in a generation. I'm also going to be using Environment Canada's "Total Precipitation" which is a combination of snow & rain, and that will keep things simple for now.
So to start off, when do we get precipitation?

This graph shows the days per month that we get precipitation. It is similar to what I've been doing for temperatures - with the average in white, a band for the 25th-75th percentile (where roughly 50% of the years will fall), and then the highest, second highest, lowest and second lowest since 1995. I've also added in the years of each of the monthly highs, for interest.
And here we see that July is the precipitation-iest month, with on average 15 days of rain, and a max of 23 days in 1996. June is second at 14 days, and February is the lowest with an average of 8 days. The maxes and mins and percentiles all follow the average pretty nicely too, with the exception of a pair of outlier maxima in October and December.
So that is the number of days with precipitation, but probably more important is the amounts that we actually get:

And again, July is the big winner with on average about 30% more precipitation than second-place June. And whether talking about the average, highs, lows, or quartiles, July basically doubles the May or August numbers.
This surprises me, because I tend to joke that May and June are Edmonton's "Monsoon Season". Throughout the year I spend a fair bit of time in the river valley - either on the bike trails or in the dog parks - and May and June are gloomy and slimy. But I guess that July must get a lot of evening thundershowers that dump a lot rain. And then the temperatures during the day are high enough to burn that off so that things don't seem soggy.
I'm also surprised by how July compares to the winter months. As I've said, this is the "total" precipitation, which means that snow is measured as its melted-water-equivalent. Comparing the height of fluffy snow to rain wouldn't really be fair, and so the way that Environment Canda does things 10mm of snow is equal to roughly 1mm of rain.
The average total precipitation for November through March is 87mm, compared to 93mm for the month of July alone. And in the last 20 years the most precipitation during a winter was 130mm, whereas the most rainy July was 186mm. For the 4 "summer" months of May-August we generally get 3x more precipitation than in the 5 "winter" months of November-March.
And as for 2016, after a few months of below average precipitation, in May we got drenched. With 107mm it was the rainiest May since 1977, which had 132mm.
Monthly data is pretty broad, so for a slightly more granular look at things, here is the data broken down by week:

Also, the May long weekend this year was the second rainiest week going back to 1995.
Breaking the data down even further to a daily basis is tricky, because precipitation is so variable. But here is a chart that looks pretty, even if it is impossible to read:

It shows every precipitation event since 1995, and there is a nice ridge in the middle where that June-July monsoon season really stands out.
Finally for today, I've said that the Blatchford data isn't any use for recent comparisons. But there is more than a century of data which can be used for historic records. Here are two of the charts from today, redone to include the all-time highs from Blatchford:
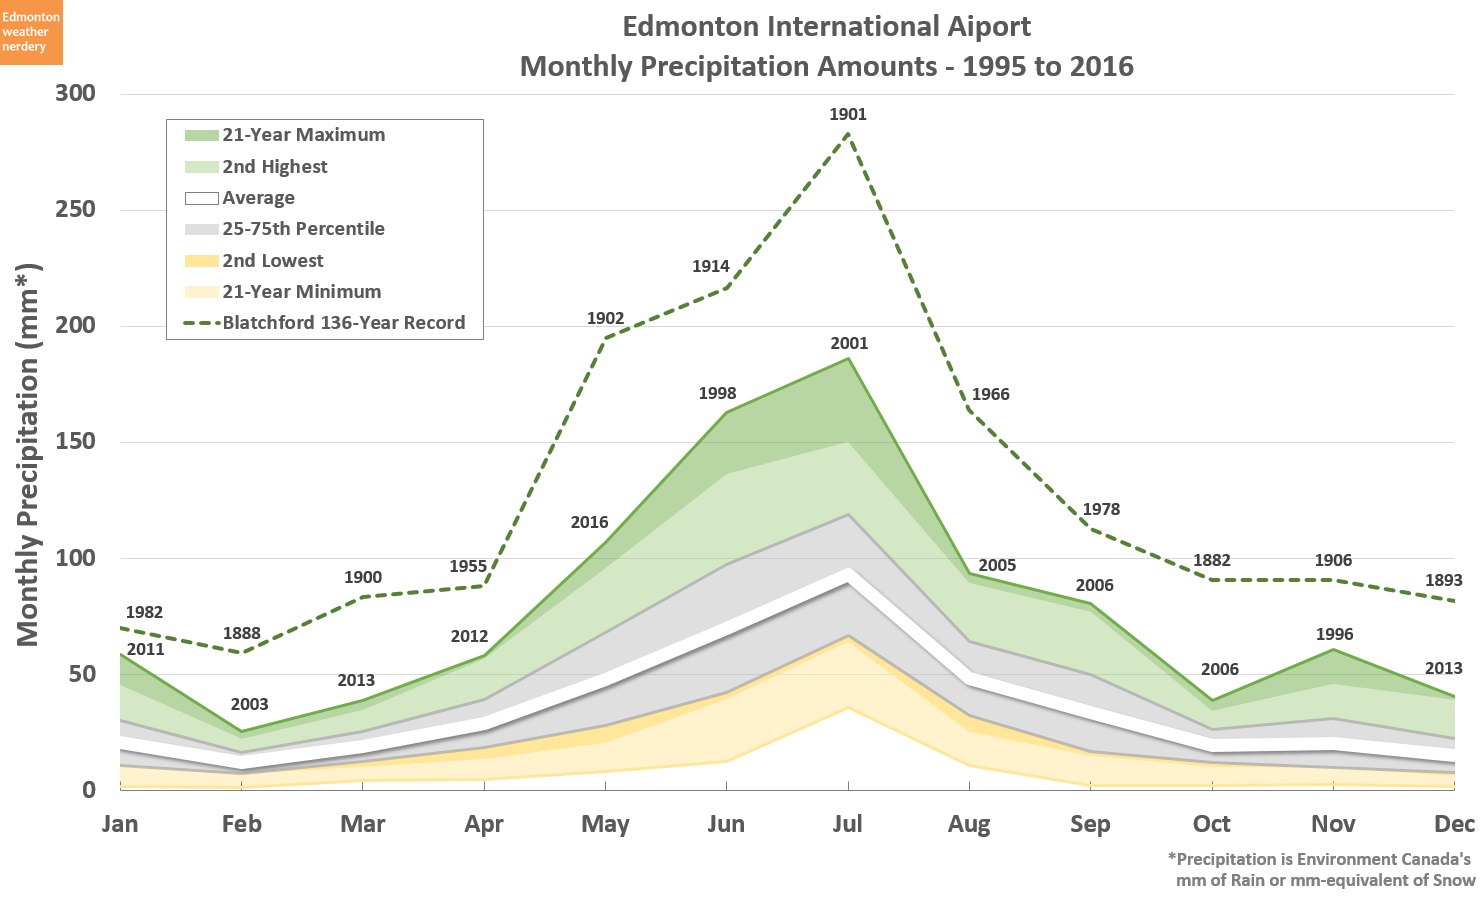
For monthly precipitation, the all-time records are anywhere from 30% to 130% more than what we've seen recently. The closest we've come to a record was January of 2011, with 59mm versus 70mm in 1982. I remember that pretty clearly, because it was my second winter commuting on a bike, and it was the only time I've seen anything even close to this:
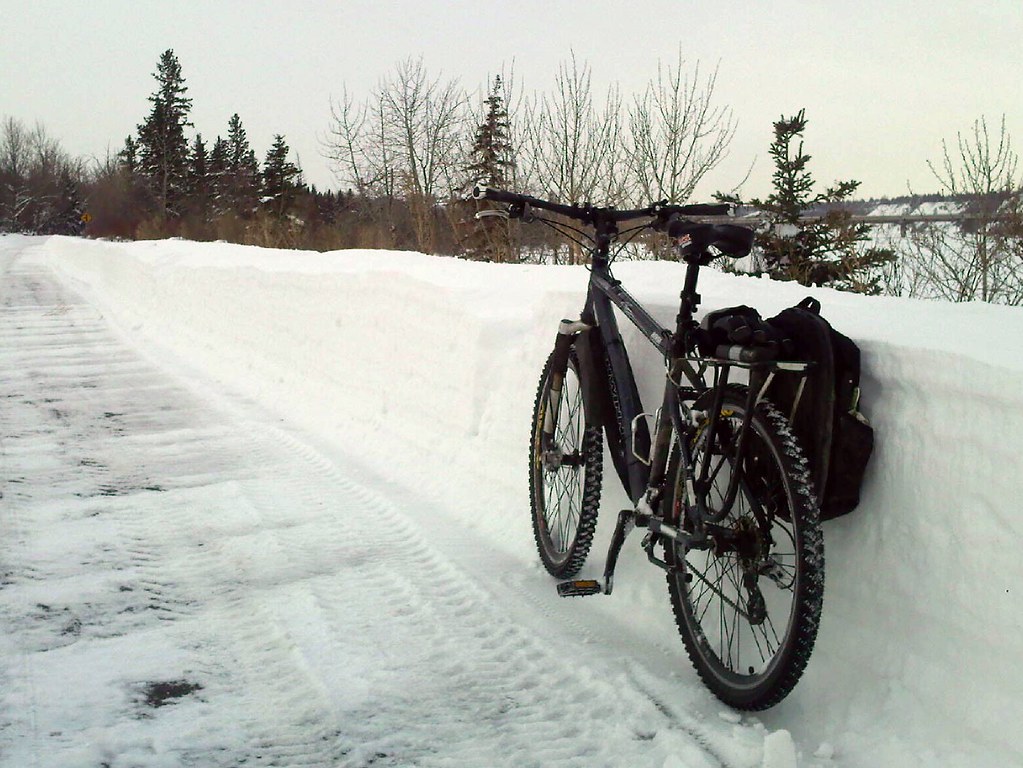
At the time I figured every winter was going to be like that, but thankfully that is not the case.

Because this chart is a mix of data from Blatchford and from the International there are a few cases - like the last week of April, Victoria day, last week of June, and 2nd last week of July - where the International's recent maximum is actually higher than Blatchford's all-time record.
No comments:
Post a Comment