It's time for our look back at Edmonton weather for November 2020. It was a pretty quiet November, but sometimes that's okay. Let's take a closer look.
High Temperatures
This seems to come up a lot, but does anyone remember all the way back to the beginning of November? We started off with two warmest-in-30-years Highs, before dropping down to the cooler side of things for 2 weeks. It didn't get super-cold though, with the coldest High at -11.1°C on the 19th. TFor the final week things warmed up to around the average, and on the 30th the temperatures jumped way up, although still well below the top of the range.
For the month overall there were 17 days with Highs below average, and 13 above (including the 2 warmest-in-30-years days).
Looking at the numbers November 2020's average High of 0.6°C was right in the middle of recent years. It was cooler than 2019 & 2018, but warmer than 2017 down at -3.3°C.
We started November with a High of 17.5°C on November 1st, and in the last 30 years the only Novembers to record a High above 15°C were 2001, 2005, 2009, 2016 and now 2020.
Overall November had 13 days with Highs of 0°C or warmer, and that is actually fewer than the average for November which is 18 days.
The coldest High was -11.1°C on the 19th, and the last time that we had a November High hit -15°C or -20°C was in 2014.
Low Temperatures
The Low temperatures for November 2020 also started warm, had a few cool weeks, and then ended warm. 17 Lows were below average and 13 were above, including 1 warmest-in-30-years Low of 2.7°C on November 3rd.
The coldest Low was -18°C on November 20th, which means that we made it through November without hitting -20°C, and that is always nice. The average Low of -8.3 was right in the middle of recent years.
Warm & Cold Months
Here we have average High and Low temperatures for November going back to 1880. 2020 is right on the long-term average, with the average High of 0.6°C ranking as 71st warmest and the Low of -8.3°C as 73rd.
November is a bit of a strange month, in that its average temperatures have stayed very constant over the past century:
Here we have a comparison of the average temperatures for November and January.
November's average High has theoretically decreased by about 1°C from 1.3°C in the 1880s to 0.1°C today, although it has been hanging out right around 0°C since about 1930. And the average Low for November has increased about 1°C from -9.3°C to -8.1°C today.
On the other hand, for January the average Highs have increased by 8°C while the Lows have increased by 10°C, and most of that has been since 1970.
You can add in other months too as a comparison, although it gets a little messy. December is also pretty flat, with the Highs increasing by about 2°C and the Lows by 4°C. And February is our 2nd most changed month after January, with the Highs increasing by 4°C and the Lows by 7°C.
When we add up the Highs & the Lows, November 2020's average temperature was 0.1°C warmer than the 20th century average for November.
In this chart months that were warmer than average are big orange bubbles, and cold months are blue bubbles. And November 2020 was so close to the average that it barely shows up.
Across Canada
November 2020 was fairly middling in Edmonton, but across the rest of the country it was quite warm. The means temperatures for the central cities were 2.5-2.9°C warmer than their 20th century averages, amd even Calgary was 2.2°C warmer which seems unfair.
You can switch this chart to show the High temperatures, and the central Canadian cities were all about 3.8°C warmer than their November averages. In Toronto the Highs were the 3rd warmest on record for November, for Ottawa it was the 5th warmest, and for Montreal it was the 3rd warmest.
Snowfall
Our average snowfall for November is 20cm, and in 2020 the International recorded 31cm. That was the International's 9th snowiest November since records started in 1961, although in recent years 2013 hit 45cm and 2014 hit 37cm.
And looking across the country Edmonton's 31cm of snow in November beat St. John's at 23cm, Toronto at 21cm, Calgary at 18cm, Ottawa at 13cm, and Montreal at 12cm.
Snowdepth
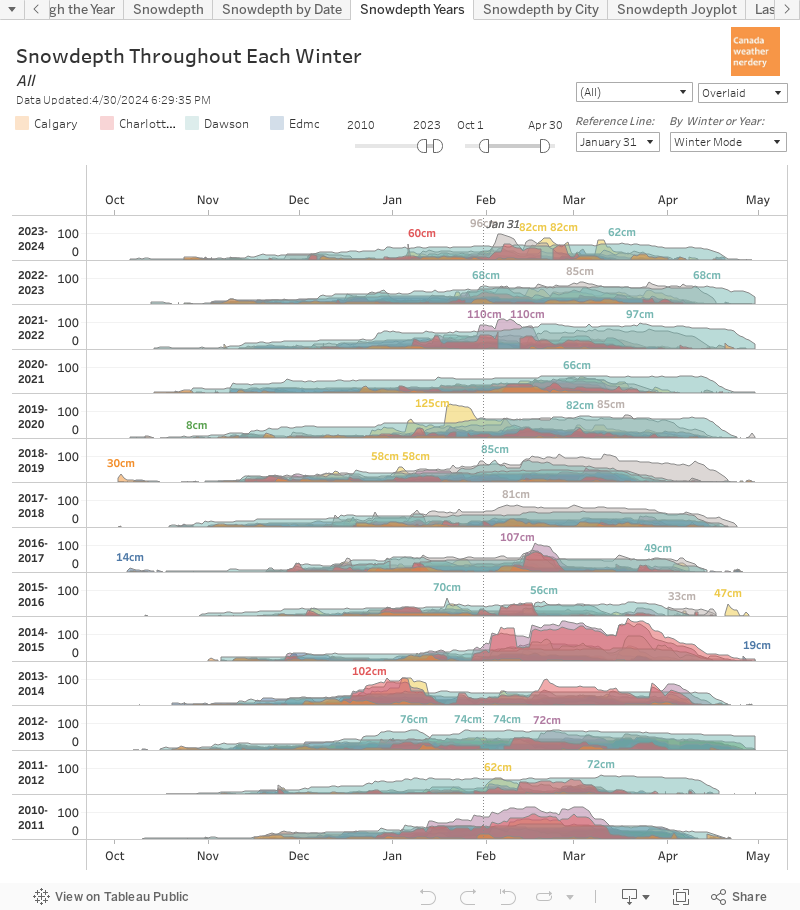
November 2020 was a bit snowier-than-average and a bit less melty-than-average, and so our snowdepth was quite high at both Blatchford and the International. The average snow depth at the end of November is about 10cm, while Blatchford spent a lot of this month with 19cm of snow on the ground, and the International was between 25-29cm.
Here we have the history of snowdepth throughout the winter for Blatchford and the International, and it has been a long time since we have had a November with as much snow on the ground, and as little melting as 2020. Every winter is different, but in recent years 2013, 2006 & 1996 would have been comparable to 2020.
Across the country Edmonton is out to an early snowdepth lead for the winter of 2020-2021.
December Temperatures
For December Temperatures on average we have about 10 days with Highs above 0°C. Some years have more than 15, like 2017, 2011, 2006-2002, etc. And then others have 7 days or less, like 2020, 2012, 2010-2007, etc.
For the Lows, since 1990 there have been 5 Decembers which didn't hit -20°C: 1993, 1997, 2002, 2001 and last year in 2019. And about half of the time December will hit -25°C, and about half of the time we will escape it.
Here we have the chart for average monthly temperaturas again, and it's a little bit messy, but it compares the average temperatures for December compared to January.For most of Edmonton's history January was the month with the coldest average temperatures. As we saw earlier January has warmed up a lot over the past century, while December has stayed relatively flat. And so for the past ~5 years January's average Highs and Lows have actually been warmer than December's, leaving December with the title of Edmonton's coldest month.


No comments:
Post a Comment