
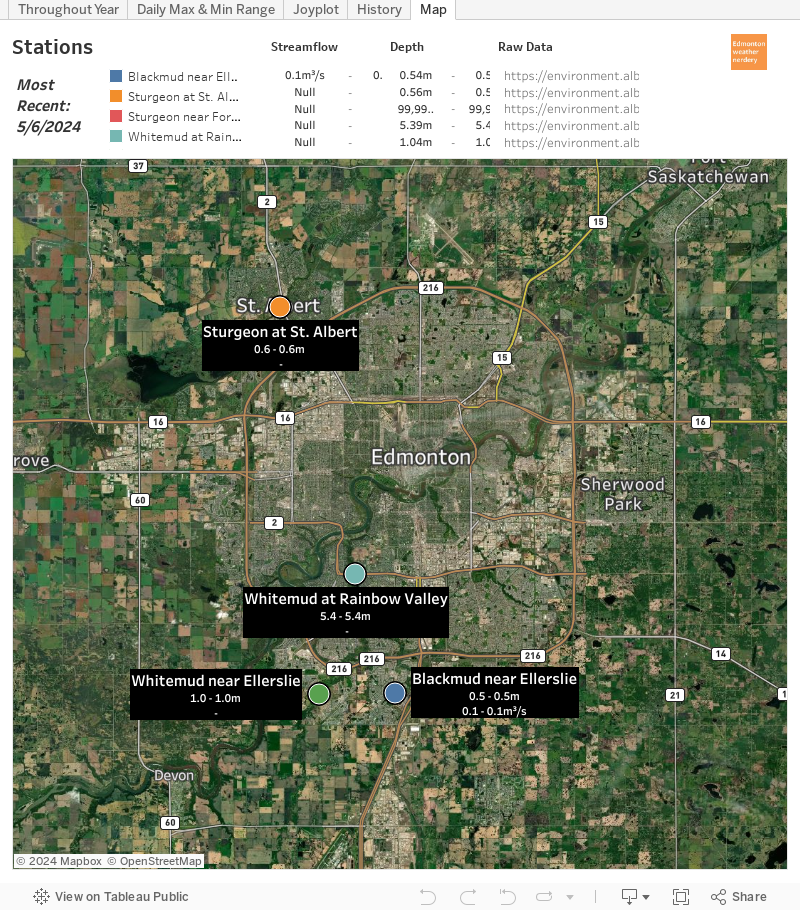
This dashboard shows the most recent readings from some of the stations around Edmonton. If you hover over each of the dots a graph of the recent depths and streamflows will appear.
Why are the depths and streamflows interesting?
Whitemud Creek and the Sturgeon are both paddleable throughout the spring and summer...but that is dependent on the water levels.
The province provides the data at https://rivers.alberta.ca/. That is a great site with some basic charts, and it provides near-realtime updates. But for data as spikey as creek levels average and quartiles don't give the whole context.

So this dashboard pulls the data from https://rivers.alberta.ca/ once per day, and it shows the daily maximum & minimum streamflows for all of the available years.
(A note about the depth for the Whitemud Creek at Rainbow Valley: it's waaaaay too high. I don't know what datum is being used, but the number never drops below 5m, and that is completely incorrect. I had thought that maybe it was measured relative to the same datum which is used for the North Saskatchewan, but that is not the case either. In a flood state like we just had the river measured 8m while upstream the creek depth was only at 6.6m.)
Late Summer

With the government site it is difficult to know exactly what to expect later in the season, and so this chart shows how often the levels are high later in the season. And late-season spikes are common throughout July & August, but they only last about 3~4 days before the levels return to normal.
 The data for these stations only goes back 10~20 years, and so there isn't a huge history.
The Sturgeon
But just for some trivia, so far in 2020 the Sturgeon has been very high with a depth close to 2m and streamflow of 15m³/s. More typically in July the depth would be below 1.5m and the streamflow would be under 5m³/s. And in this chart if you click on the line for 2019 it was very high in August with a depth of over 2m and streamflow of 10m³/s.
This dashboard is definitely a niche interest. And if you need realtime data the https://rivers.alberta.ca/ site is a much better source. But for a more granular history and some context this dashboard can be handy. If you do find this dashboard useful the fullsize version here is probably better than the one embedded in this blogpost.
No comments:
Post a Comment