
If you want to skip to the final results then please just head over to: Freeze/Thaw Cycles: Part 1.
But if you are wondering about the assumptions which were made (and their inherent inaccuracy) then by all means please keep reading...
The challenge with counting freeze/thaw cycles comes down to Daily data versus Hourly data.
Daily Data

Here we have an example of Daily data, with the Highs & Lows shown for 2 days.
The temperatures flip from below freezing Lows to above freezing Highs, and it is natural to assume things went something like:
- cold night > warm day > cold night > warm day
That would give us 2 thaws and 1 freeze, or 1.5 complete freeze/thaw cycles.

In this case things would have gone:
- cold night > warm day which stayed warm through the next morning > cold day
With the Daily data we never know what order the High & Low temperatures actually occurred in, and so there is always uncertainty in exactly how many freeze/thaw cycles there were.
In the first example we are assuming that there was an extra freeze or thaw overnight, so that approach may overcount the total number of freeze/thaw cycles. In the second example we are assuming that there was not a freeze or thaw overnight, and so it may undercount the number of cycles.
We will come back to these in a bit, but for now we are going to move on to:
Hourly Data
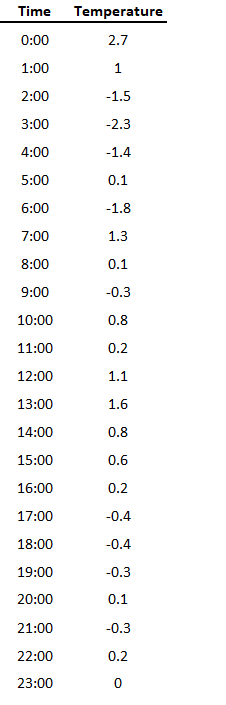
Switching over to Hourly data, here we have 24 hours which went through a total of 5.5 freeze/thaw cycles. This is the daily data for January 12, 2010, and it is a good example of the challenges of the Hourly data.
So how do should we count something like this? When people ask "Do we get more freeze/thaw cycles now than we used to?" they really aren't talking about all of these intra-day temperature swings as separate freeze and thaws.
Daily Data versus Hourly Data

Here we have a comparison of different counts:
- The orange line is our upper estimate based on the Daily data (the example with 1.5 cycles from earlier).
- The green line is our lower Daily estimate (the example with 1 cycle).
- The blue line counts every, single temperature swing from the Hourly data.
- The dotted red line uses the Hourly data, but it filters-out intra-day freeze/thaw cycles by putting a cap on the number of temperature swings each day.
The "Daily - Lower Estimate" is very low, counting about half of the number of freeze/thaw cycles of the other methods. It does not include the overnight temperature swings, and so it is missing a lot of the freeze/thaw cycles.
The "Hourly - All" is almost always the highest, because it is counting all of the intra-day temperatures changes, like the 5.5 cycles on Jaunary 12, 2010. The "Hourly - Adjusted" filters those out, and so it is lower - usually by about 10 cycles each year. Days like that really did have 5.5 freeze/thaw cycles, but counting those intra-day cycles as 1 is probably a better match to how people would have perceived it.
The "Daily - Upper Estimate" is in the same range as the Hourly counts. Typically the difference is less than 10 cycles for an entire year (or about 10%) but for some reason in 2001-2003 the Hourly counts are quite a bit higher, with differences of 20-30.
Summary
For our look at Freeze/Thaw cycles we will be using the "Daily - Upper Estimate". That is mostly for practical reasons, because there is Daily data available back to 1881, while for Hourly data there are only a few decades available.
For both the Daily and Hourly data it is difficult to determine the "exact" number of freeze/thaw cycles that people actually perceive. Theoretically the "Daily - Upper Estimate" method which we will be using may tend to over-count the number of freeze-thaw cycles (1.5 cycles compared to 1 cycle as we saw in the first example), but in practice it is in the same range as the results from the Hourly data.
So using the Daily - Upper Estimate will not be perfect, and there is easily 10% uncertainty in the counts. But it is the best that we've got. And it should work pretty well to discuss the question "Do we get more freeze/thaw cycles now than we used to?"
No comments:
Post a Comment